
Following the rapid drop from $40,000 to $26,000, Bitcoin had been moving sideways inside a descending triangle. It finally broke the triangle to the upside on May 30, but could this just be a fakeout?
In the meantime, Ethereum and other altcoins continue to bleed against Bitcoin. A demoralized market following the Terra/UST debacle has been reluctant to buy into altcoin dips at large volumes. Recession fears and ongoing drops in tech stocks, due to rising interest rates, negatively impact the risk appetite for technology-related assets and thus the demand for altcoins.
In this issue of the crypto ecosystem update, we will analyze Bitcoin’s current price action and discuss whether the breakout that started on May 30 could be a fakeout. We will also discuss the approaching death cross for Ethereum as well as Terra’s forking to a new blockchain, Tron’s new algorithmic stablecoin ecosystem, and Vitalik Buterin’s guide on how to tell if an algorithmic stablecoin is stable.
Bitcoin price analysis
Bitcoin was moving inside a descending triangle for over 20 days and it broke out of the triangle on May 30. This could well evolve into a relief rally up to the next major resistance level as Bitcoin has printed nine consecutive weekly red candles since the March 28 top. But whether this potential rally can mark the absolute bottom and start a new growth cycle for Bitcoin is contingent upon the convergence of short and long-term momentum indicators, as well as the on-chain activity.
- Breakout from the descending triangle
You can see in the chart below Bitcoin’s descending triangle that it has formed since May 13. Bitcoin is currently trying to break out of the triangle. A weekly (week of May 30) or monthly (May) close above the triangle can push the price of Bitcoin to the $38,000 resistance.
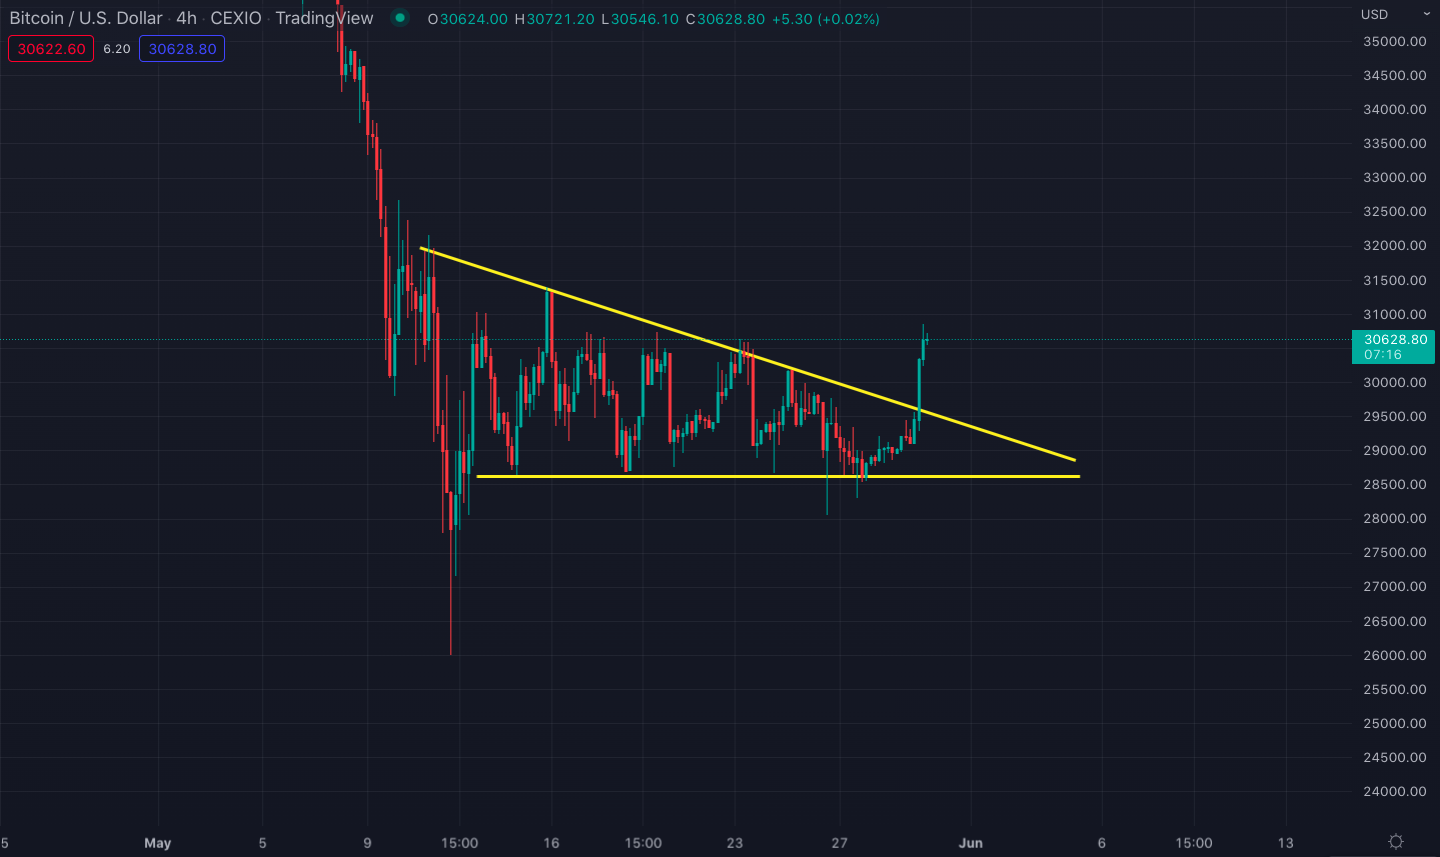
Bitcoin/U.S. Dollar price chart on a 4-hour time frame. Source: Tradingview
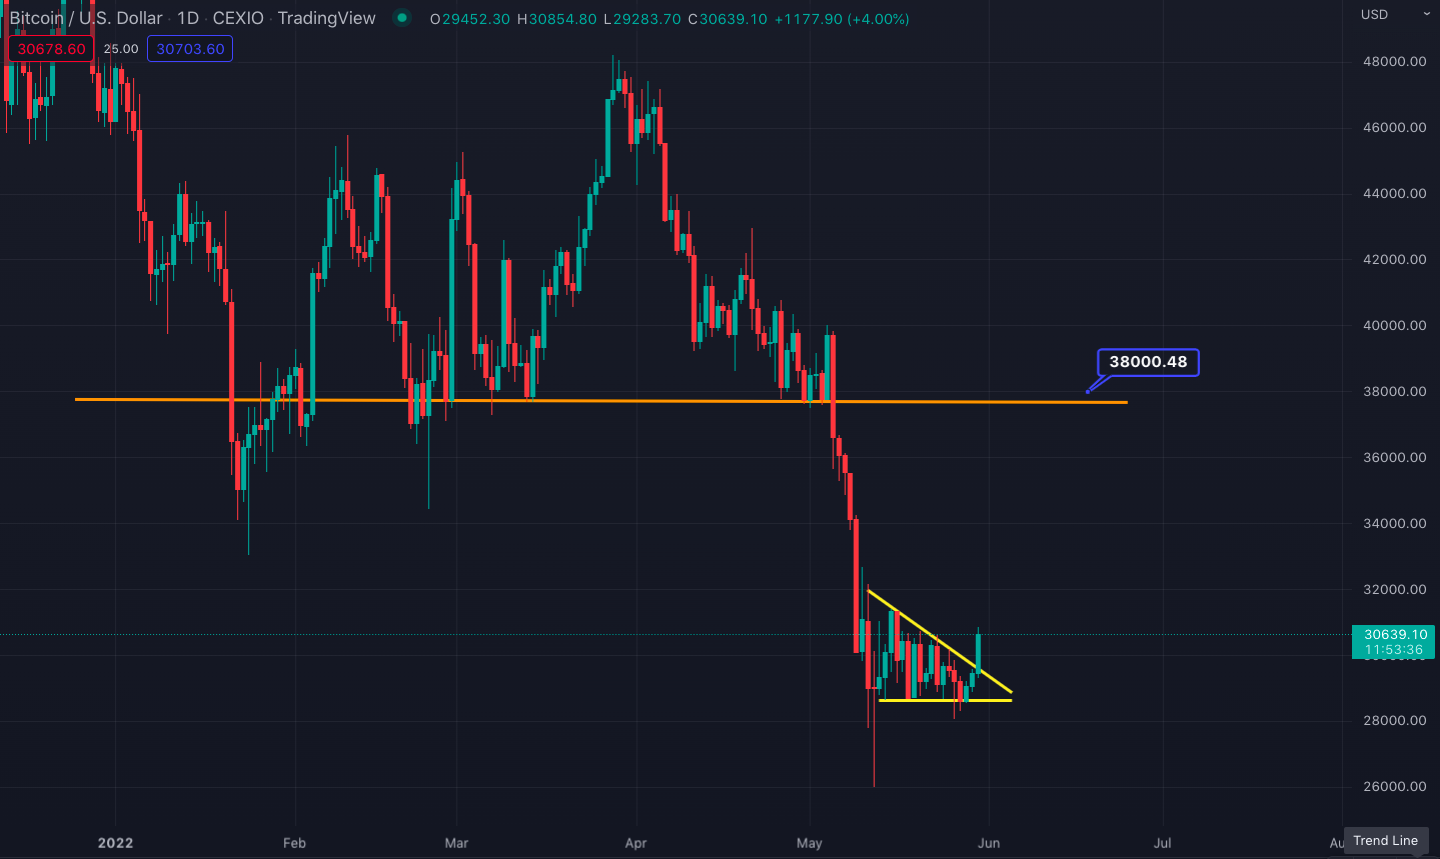
Bitcoin/U.S. Dollar price chart on a daily time frame
Statistically speaking, descending triangles are continuation patterns during downtrends, which means they tend to break downwards. As a result, the current breakout may be a fakeout. Convergence needs to be found among Bitcoin’s short and long-term momentum indicators to confidently suggest that this could be the start of an uptrend.
- Divergence between short and long-term indicators
Bitcoin’s stochastic RSI has become overbought both on the four-hour and the daily time frames immediately after the breakout from the descending triangle (see the charts below). The stochastic RSI compares the closing price of an asset to a range of its prices over a certain period. The indicator’s values can range between 0 and 100, where values above 80 indicate overbought conditions and values below 20 indicate oversold conditions.
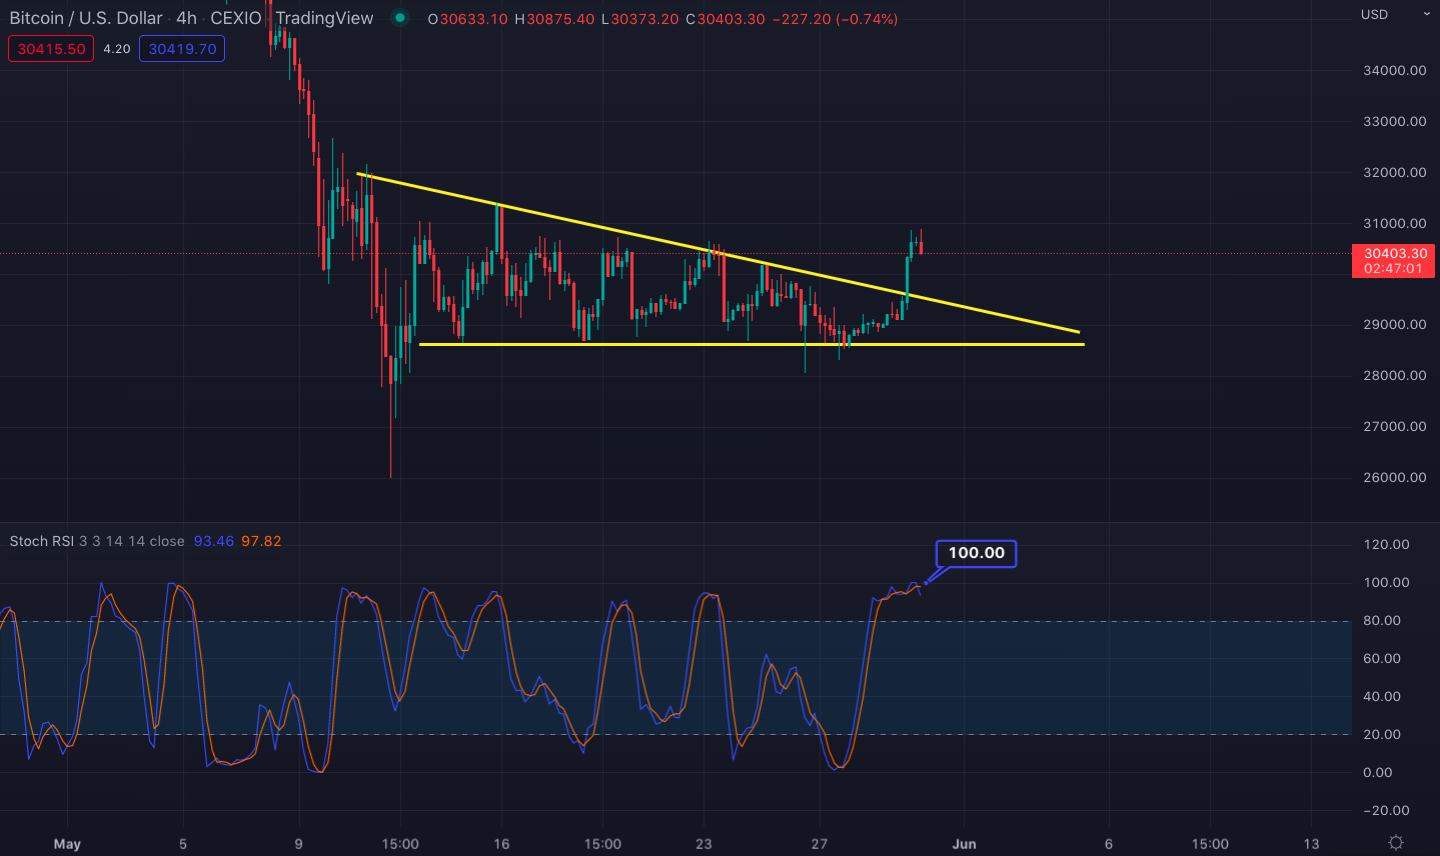
4-hour Bitcoin/U.S. Dollar price chart with the stochastic RSI momentum indicator
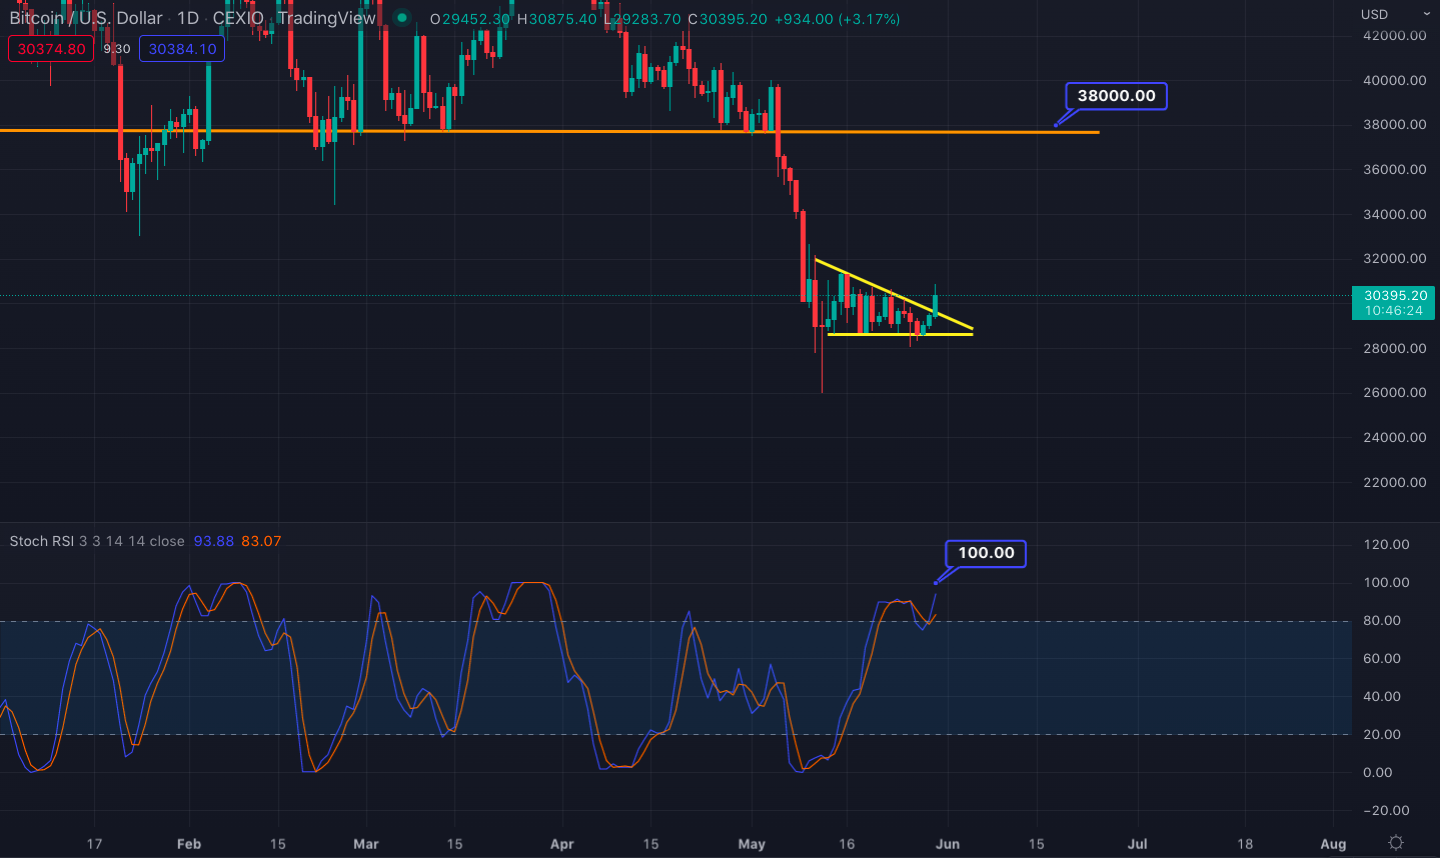
Daily Bitcoin/U.S. Dollar price chart with the stochastic RSI momentum indicator
Getting overbought this quickly with such little price movement indicates a weakness in the trend and is observed frequently during bear markets.
When we compare Bitcoin’s shorter-term stochastic RSI values with the monthly figure, we see a divergence instead of a convergence. In contrast to shorter time frames, the monthly stochastic RSI has almost zeroed out at 3.24 (see the chart below) This means the current price of Bitcoin is very low compared to the prices during the previous 12-14 months. The price has to climb and take the monthly stochastic RSI above the critical 20 threshold. Historically, Bitcoin’s bull runs started once the monthly stochastic made a close above 20.
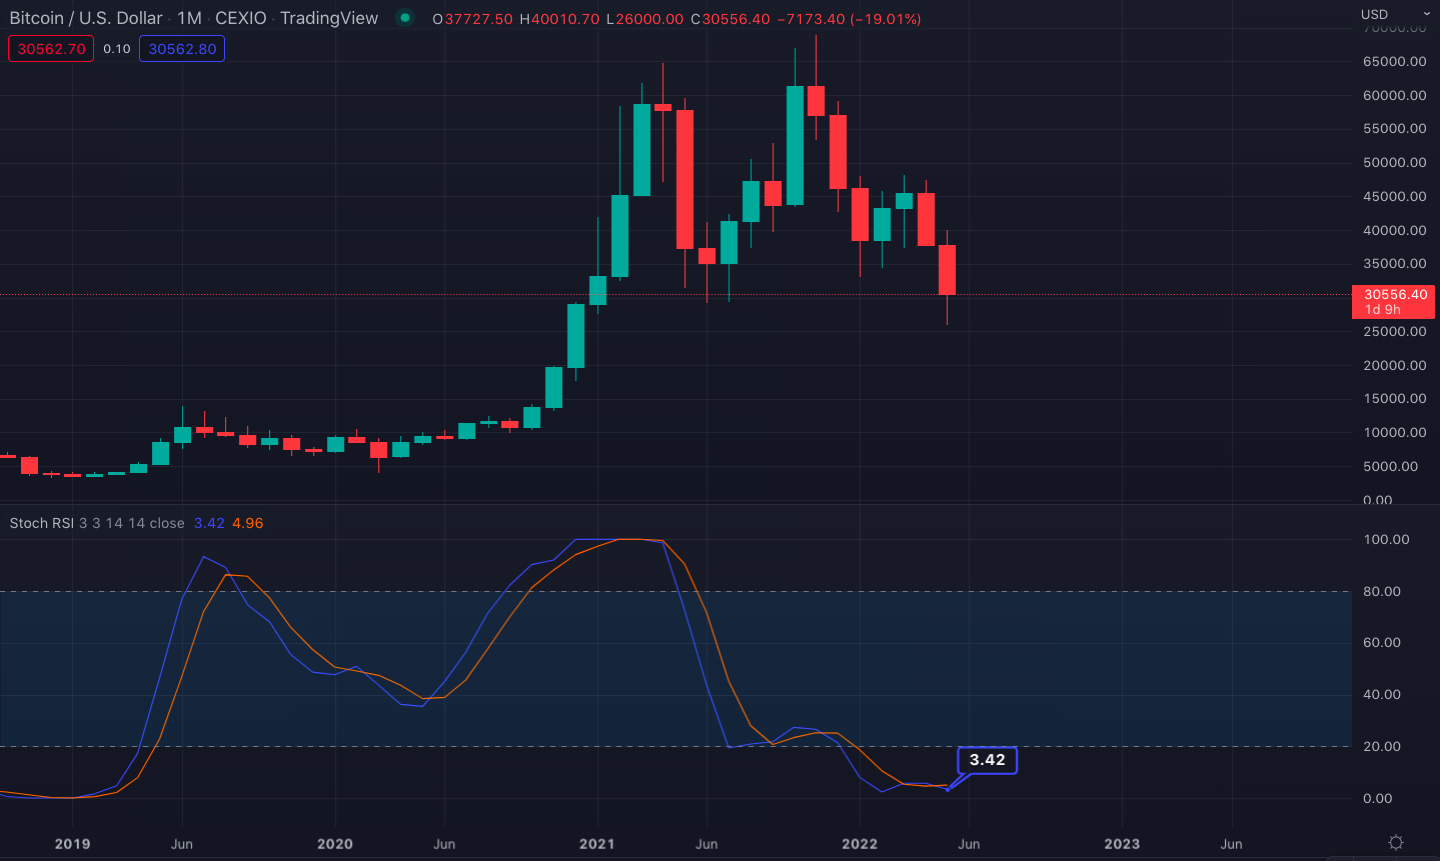
Monthly Bitcoin/U.S. Dollar price chart with the stochastic RSI momentum indicator
The divergence between the shorter and longer time frames suggests that the current bounce may not have the necessary momentum to pass the $38,000 resistance and start a new uptrend.
- A sudden drop in the hashrate
After recording its all-time high hashrate at around 228 EH/s in late April, Bitcoin’s mining difficulty had a sudden drop on the week of May 16, when it fell to as low as 205 EH/s. This could be dangerous for Bitcoin because we would like to see an increasing hashrate during consolidation periods.
Although the hashrate has bounced significantly since then, failing to make a new high in the upcoming days could be followed by an even steeper drop, which could lead to a miners’ capitulation, an event that has preceded Bitcoin market bottoms in the past.
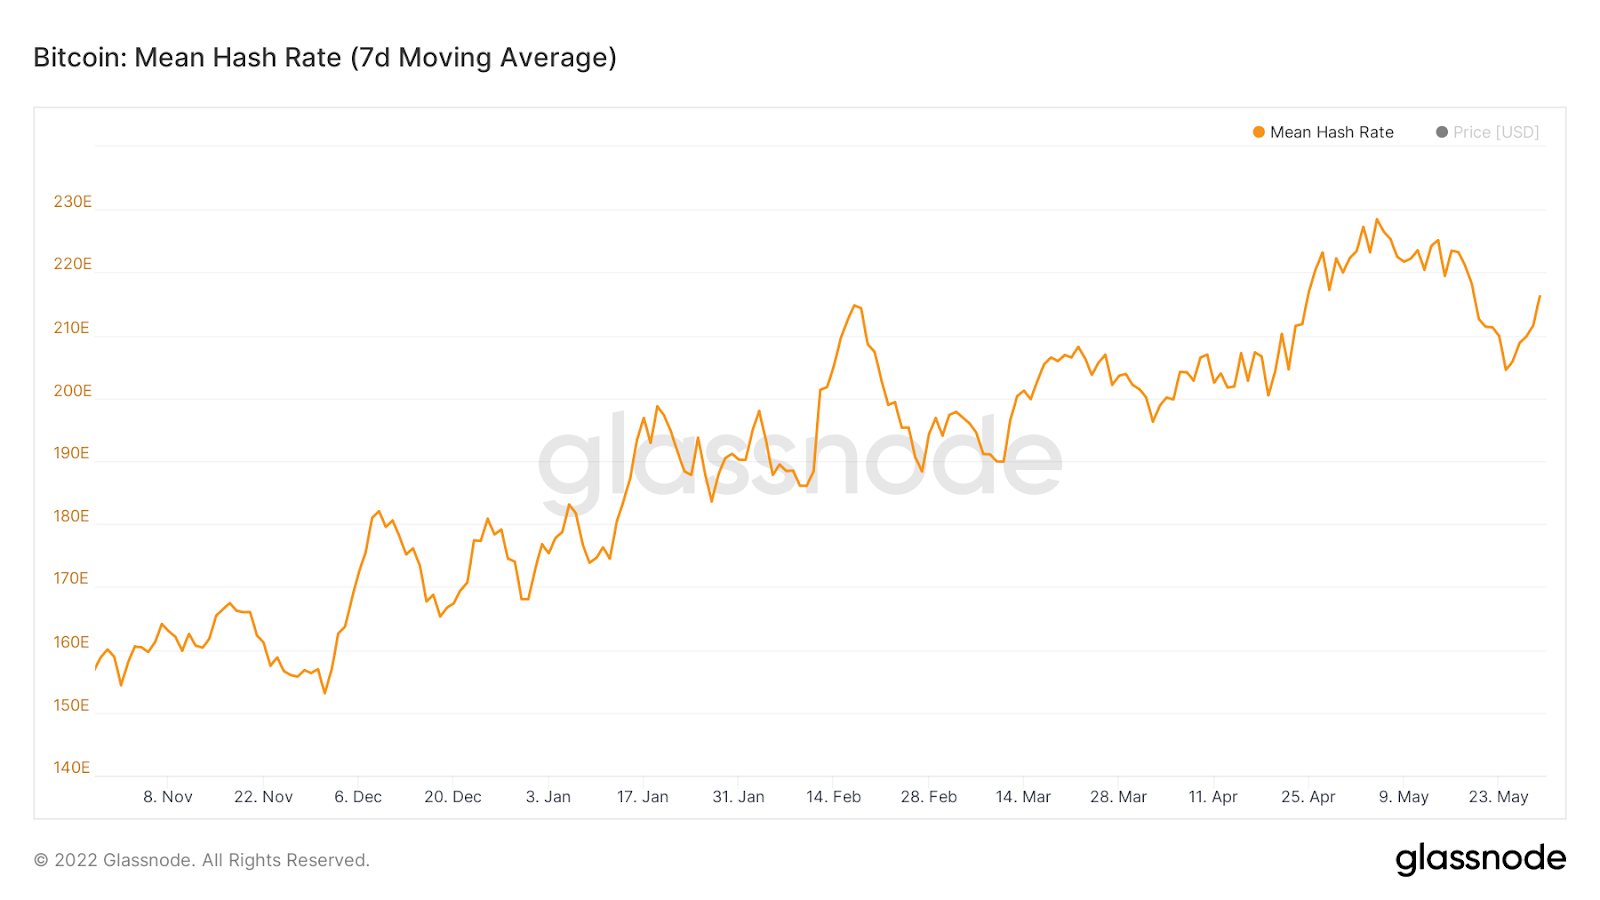
Source: Glassnode
Ethereum price analysis
Ethereum’s uptrend against Bitcoin since the start of 2021 may have come to an end with Ethereum finally breaking down from its rising channel.
During the collapse of Terra and UST, investors got fearful of all altcoins including Ethereum and many of them converted their altcoin positions into stablecoins and Bitcoin. This caused a large drop in the Ethereum/Bitcoin parity and the rising channel that has been intact since January 2021 may get invalidated if the parity closes the month below the channel.
To add salt to injury, a major death cross is approaching for the Ethereum/US Dollar trading pair, which consists of the 50 simple moving average (SMA) crossing down the 200 SMA on the 3-day chart. When the same death cross happened in 2018, the Ethereum/Dollar pair ended up in a 70% crash.
- Breakdown of the ETH/BTC rising channel
After forming a rising channel for exactly 52 weeks, the ETH/BTC parity finally broke down from this channel on the week of May 16. A monthly close below the channel could spell further trouble for the parity and indicate that money will flow to Bitcoin and stablecoins in the coming months.
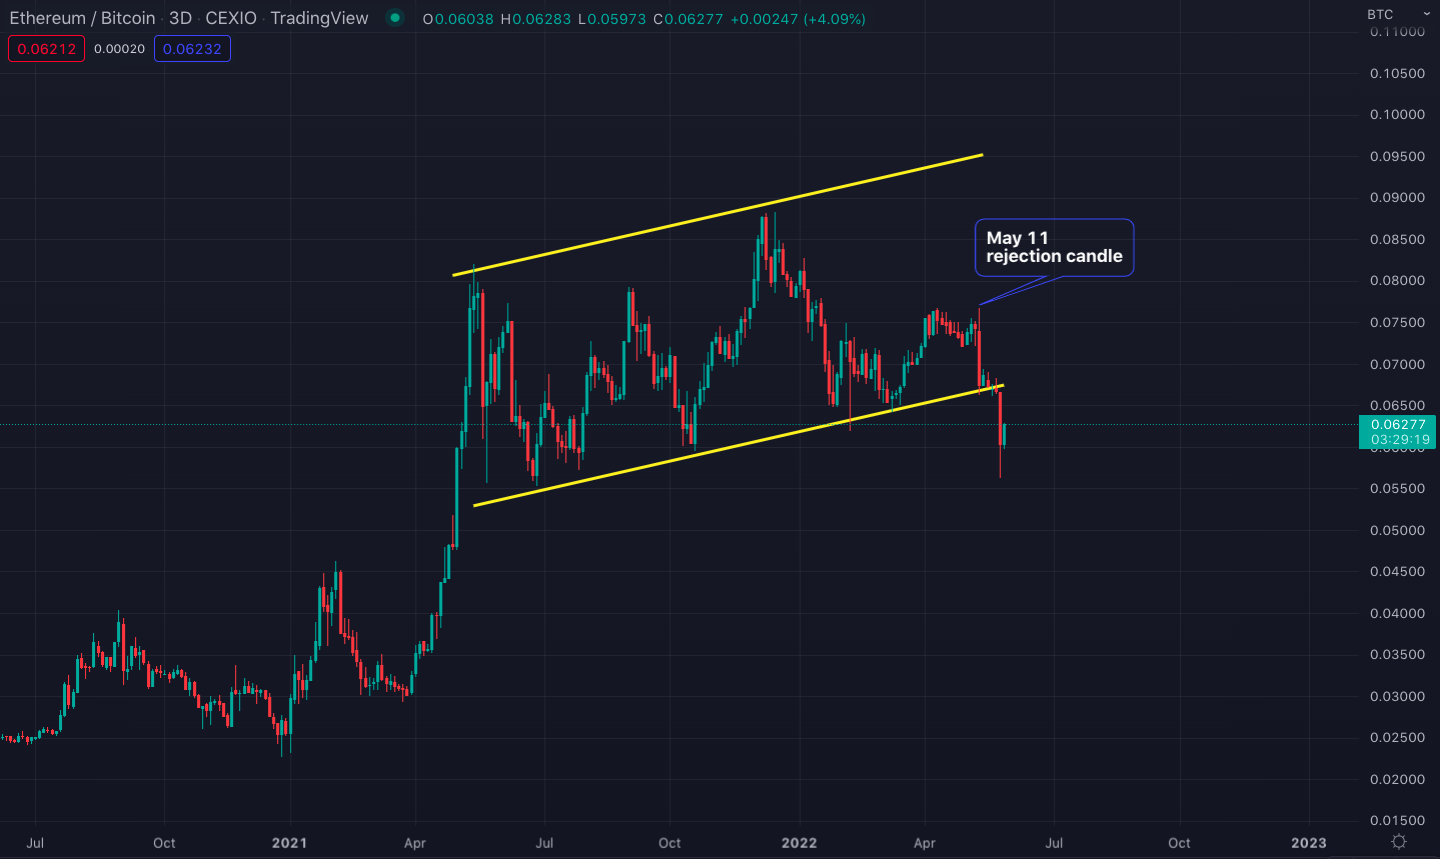
Ethereum/Bitcoin parity chart
If the current downtrend in the cryptocurrency market continues throughout 2022, the next major support for the ETH/BTC parity will be at around 0.04.
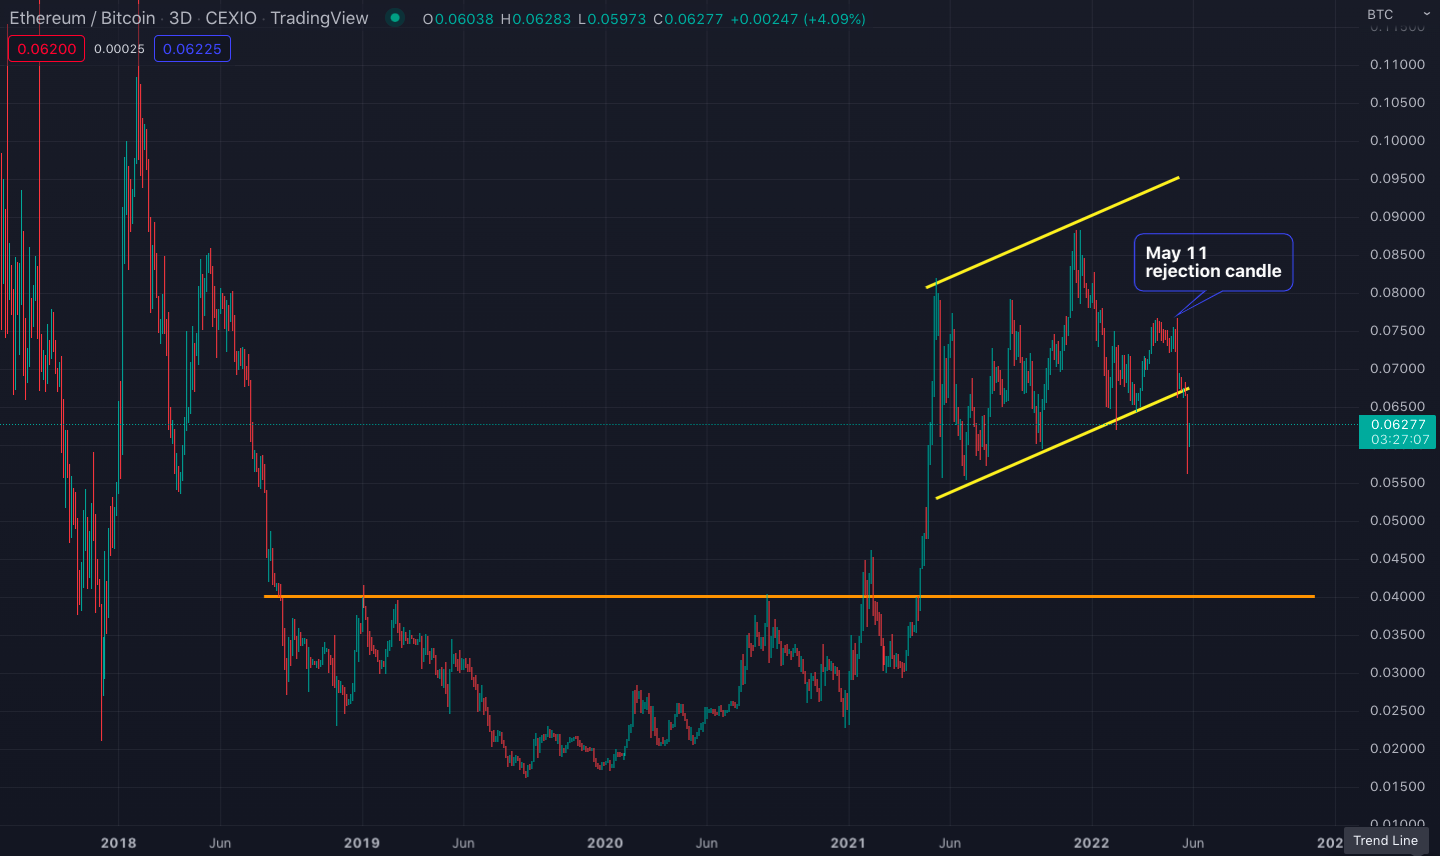
Ethereum/Bitcoin parity chart
- The 3-Day death cross on the ETH/USD chart
Similar to Bitcoin’s recent three-day death cross, Ethereum’s death cross is also approaching for the US Dollar trading pair. The three-day death cross happens when the 50 SMA (the green line in the chart below) crosses down the 200 SMA (the red line). Ethereum had only one three-day death cross in its history, which crashed the price by 67%.
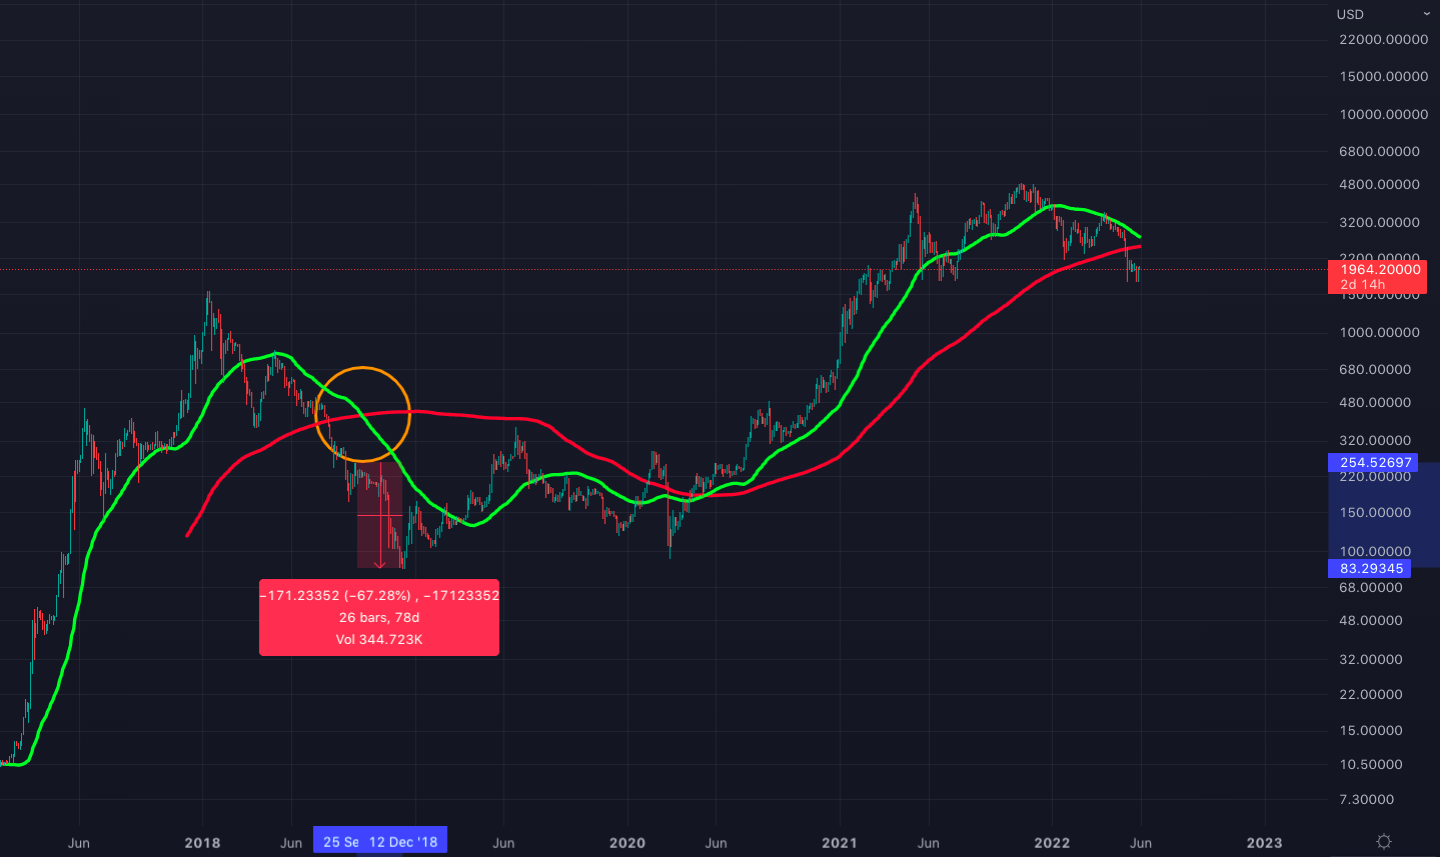
Ethereum/U.S. Dollar 3-day price chart. The green line represents the 50 SMA and the red line represents the 200 SMA.
As you can see in the chart above, there was an Ethereum death cross back in October 2018 (circled in orange). During bull runs, the price hovers above the 50 SMA and in bear markets, the green 50 SMA line becomes resistance. The line also acted as resistance during the March 2022 rally and since then, Ethereum could not hold the red 200 SMA line as support.
The current price action has been identical to 2018 so far. Even retracements and advances between the two moving average lines are identical at around 50%. If history repeats itself, the moving average lines are expected to cross each other by approximately June 24 (see the chart below).
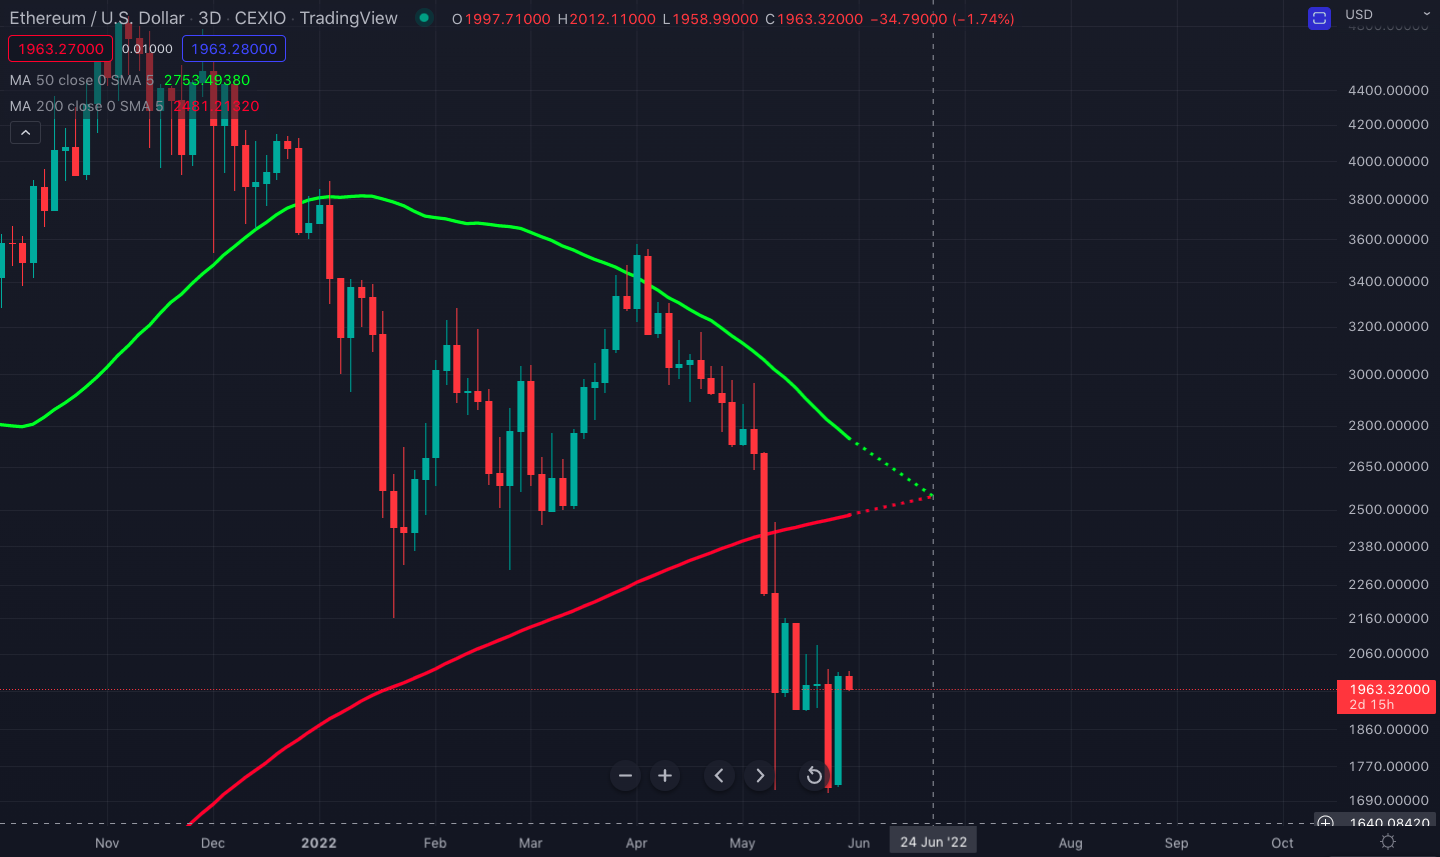
Extrapolation of the 50 and 200 simple moving average lines on the 3-day Ethereum/Dollar chart
- Massive Ethereum inflow to an exchange
On May 30, an Ethereum wallet address rumoured to belong to Three Arrows Capital sent 32,000 ETH (worth $64 million) to a cryptocurrency exchange. Below are the records for the transactions:
The same address had deposited another 26,700 ETH to exchanges in early May. Funds are most usually sent to exchanges to sell them for other assets, so such bulky exchange transfers raise suspicions for a new breakdown in the Ethereum price in the coming days.
Terra asks for a second chance with Luna 2.0
Last week, the Terra community voted in favor of a proposal to fork the original blockchain to a new network in an effort to save the ecosystem. The fork took place on May 28 and the new network is called Luna 2.0. This time, there is no algorithmic stablecoin but whether the new blockchain has anything special for its disheartened community remains to be seen.
Several applications have already migrated to the new chain, including Astroport, Prism, RandomEarth, Spectrum, Nebula, Terraswap, Edge Protocol and others.
The community governance changed the name of the original network to “Terra Classic” and the original Luna tokens are now called LUNA Classic (LUNC).
New LUNA tokens are distributed to Terra holders by airdrops. Investors of the original token are earmarked to receive 70% (700 million tokens) of the new token’s total supply. The amount of LUNA 2.0 airdrop each investor receives will vary depending on whether the original Luna tokens were held before or after the UST depeg.
Tron becomes the third largest blockchain with USDD
Despite the ongoing fears and reservations about algorithmic stablecoins, the crypto market welcomed Tron’s new algorithmic stablecoin, USDD with much enthusiasm. Activity on Tron’s network increased significantly following the launch of USDD.
What is even more interesting is USDD offers more than 20% annual percentage yield (APY), just like Terra’s UST used to do.
And similar to UST’s working mechanism, investors can swap 1 USDD on the Tron network and receive 1 USD worth of TRX whenever USDD’s unit price drops below 1 USD. In return, they are able to pocket the difference by selling the TRX tokens on the open market.
With the boost from USDD activity, Tron has become the third largest blockchain in terms of the total value locked (TVL) surpassing major blockchains like Avalanche and Solana.
When you look at Tron’s historical TVL data, you will see that it has been steadily increasing since 2021 (see the chart below), although many competitors topped out during 2021 and experienced significant drops since then.
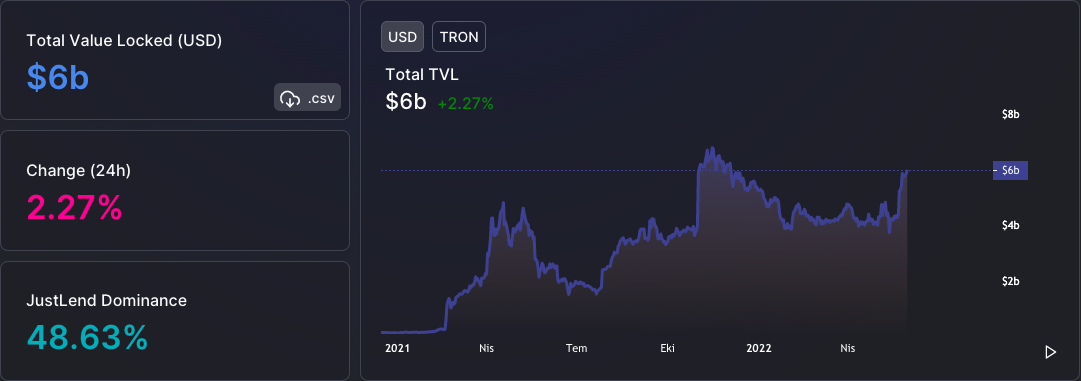
Source: Defi Llama
In the meantime, Tron’s token price has also held up well, recording a relatively small 30% loss since the November 2021 top while Ethereum, its major competitor dropped by 60% and other blockchains like Avalanche and Solana have dropped by over 80%. Tron’s positive divergence from the market can be a consequence of its rising TVL and the pricing of its USDD algorithmic stablecoin in advance.
JustLend, Tron’s decentralized lending platform currently offers 23% APY for USDD deposits. This caused JustLend’s TVL to spike from $1.80 billion to $2.89 billion in less than a month.
On the other hand, Tron’s stablecoin platform SUN offers up to 64% APY for staking USDD-TRX liquidity tokens.
Although there is currently a lot of interest for both Tron and USDD, the tremendously high return rates for USDD deposits and USDD-TRX staking also raise suspicions from skeptics as the Terra ecosystem had similarly lucrative return rates before it eventually collapsed.
Buterin’s guide on how to pick stablecoins
Vitalik Buterin has shared in a recent blog post his approach to determining whether an algorithmic stablecoin is sustainable and listed the two critical factors to consider:
- Would users be able to extract any value out of the stablecoin if its network activity drops to zero?
- Is it possible to implement a negative interest rate on the stablecoin if its demand spikes?
If a stablecoin has intrinsic value even when its network activity drops to zero while being able to handle negative interest rates, then Buterin thinks it is worth taking another look.
Buterin added in the blog post that algorithmic stablecoins still have a potential for significant growth even if many of those currently in existence are “fundamentally flawed and doomed to collapse eventually.”