Bitcoin performance as demonstrated through metrics
The story of Bitcoin (BTC) is interwoven with a series of triumphs and pitfalls. At this point in its timeline, few detractors doubt the potential that blockchain and cryptocurrencies provide. The last decade has been a spectacular exercise in free market economics as the public collectively attempted to determine what these digital assets should truly be worth.
However, this is no easy task. Especially as developers continuously build on top of these networks, adding more functionality, and ultimately value, to cryptocurrencies like Bitcoin. We have also been witness to several major cryptocurrency recessions since the birth of this industry, with some shaving up to 80% of the value of these assets.
When we refer to the macro picture, Bitcoin appears to be continuously marching towards higher highs, as every bear market was immediately followed by a new all-time high in price. After the crypto winter of 2022, will the Bitcoin phoenix rise again?
BTC trend at a glance
It’s no surprise that BTC has had a difficult time this year. The decline that began in November 2021 continued throughout the first half of 2022. Much to the dismay of BTC purists, we broke through the historic $20,000 marker, ultimately hitting a bottom of around $17,500. This brings the total drawdown year-to-date (YTD) at around -58%.
From the lows we witnessed on June 18th, BTC price has since established $19,000 as a support level, regrouping here two other times over the past 40 days. Now, many analysts believe the short-term lows are in and BTC may be ready to make a bullish move.
Historical monthly comparisons
Historical price data can be useful for traders who want to understand how an asset has performed in the past and get an idea of where it could be headed. This past June was certainly record-setting for BTC, though not in a way that bulls would appreciate. After plummeting more than 35% in June, BTC officially experienced one of the worst months in its history. There have only been four other months since 2010 that were as catastrophically bad as this recent price collapse.
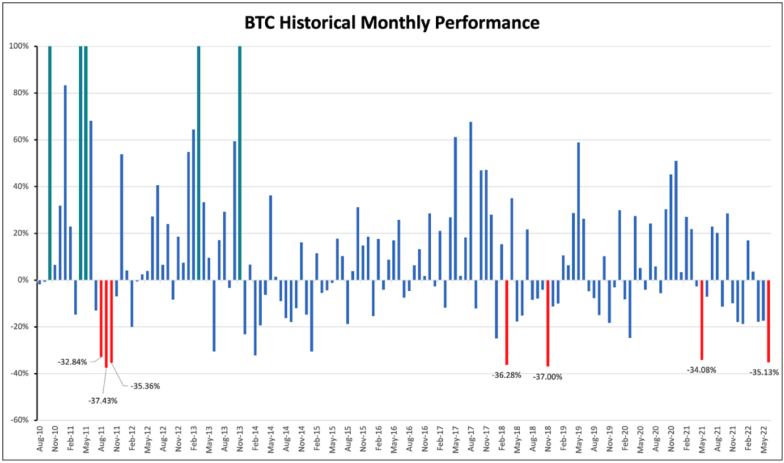
Data Source: Glassnode
Despite this drawback, BTC may have brighter days ahead. Over the last two years, both July and August were green. With July of 2022 now closing also as a green month, it could be setting the stage for a large bounce in August that helps to offset some of the declines from the first half of 2022.
Network Metrics
Hash rate
Bitcoin’s hash rate is the combined computing power of its network. All of the mining systems that are participating in Bitcoin’s proof of work (PoW) protocol contribute to the total hash rate. This is an imperative metric that exemplifies the health and capabilities of Bitcoin at any given time. Without the miners, how could Bitcoin process transactions, or secure its network?
The BTC hash rate grew by 3.5% in the last seven months when you refer to a 14-day simple moving average (SMA). The quarter ended with reports pointing to around 210 million terahashes per second. Hash grew 4.14% in the second quarter of the year but is ultimately down 6.83% from the all-time high that was recorded in May.
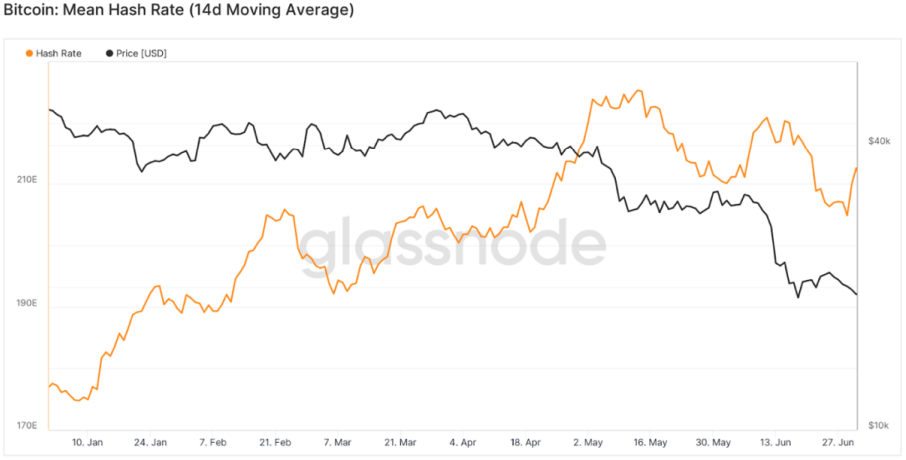
Data Source: Glassnode
Difficulty
Difficulty is the measure of the amount of work it takes to discover (mine) new BTC. The difficulty has risen 22% YTD, with a 3.4% increase in the last quarter alone. This increase happens automatically in response to how fast blocks are being mined. Each Bitcoin block should take about 10 minutes to process. Otherwise, the difficulty is adjusted by the algorithm.
Active addresses
Active addresses are categorized as BTC addresses that were recently used on the network as either a sender or receiver. This is a helpful statistic to refer to when you want to understand how many people are potentially using Bitcoin and is another metric that can demonstrate the overall health of the asset.
Generally speaking, a drop in BTC prices seems to correlate with a drop in activity as well. The recent quarter ended with a 7-day SMA of around 872,369 active addresses. This figure represents a YTD decline of 9%. This is unsurprising considering the large pullback that BTC has experienced during this time. When the price begins to recover, there will likely be more address activity as well.
New wallets
Now we can take a look at new BTC addresses that have been created since the beginning of 2022. From January 2022, through June 2022, 73 million new BTC addresses were created despite the unrelenting selling pressure. Compared to 87.5 million for the first half of 2021, this is a 16.5% decline. As price recovers, the rate of newly created addresses is expected to rise in tandem as both media and retail attention returns.
Exchange BTC balance
One metric that may be particularly illuminating in these chaotic times is the amount of BTC that is held on exchanges. While easily overlooked, this metric could have serious implications for the short-term future of the asset. As crypto evangelists preach, “not your keys, not your crypto.” If users are not planning to sell or trade their BTC why would they continue to hold it on exchanges?
Though everyone has their own needs and overall strategy, it’s generally observed that long-term holders keep their crypto in a 3rd party wallet, hardware wallet, or a wallet service that can generate staking rewards, as opposed to an exchange wallet that is only used for trading.
March 2020 marked the peak of BTC held on exchanges at over 3.1 million BTC. From that moment onwards, there has been a substantial decline. Reflecting on just the last seven months, there has been an 8.7% reduction with 230,935 BTC having left exchanges. This includes a 5.3% reduction in the second quarter alone. As of June 30th, there was only 12.6% of the circulating BTC supply remaining in exchange wallets.
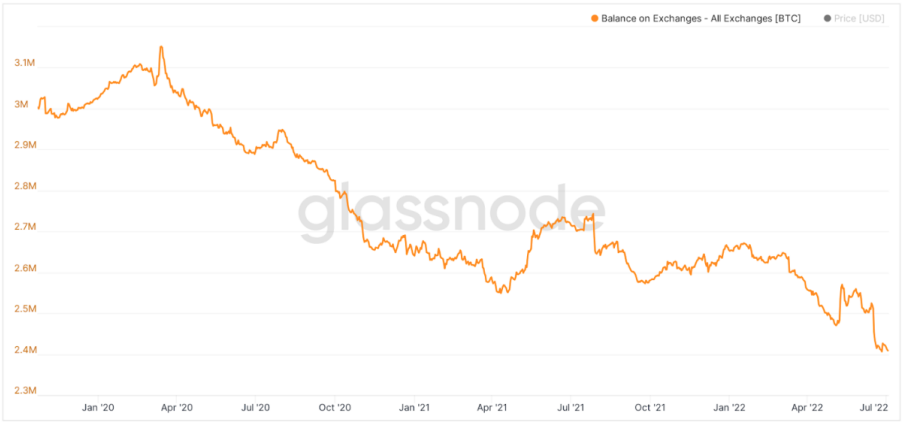
Source: Glassnode
Many analysts will debate the overall market effects of this trend, but it is difficult to disagree that it could potentially be an indication that a bottom is forming. This is because long-term holders are migrating their BTC to more secure wallets, such as cold storage. Of course, there are innumerable other factors involved that could also be at play here. However, it is hard to ignore the fact that as BTC leaves exchanges, the selling pressure on the cryptocurrency market has receded as well.
Futures
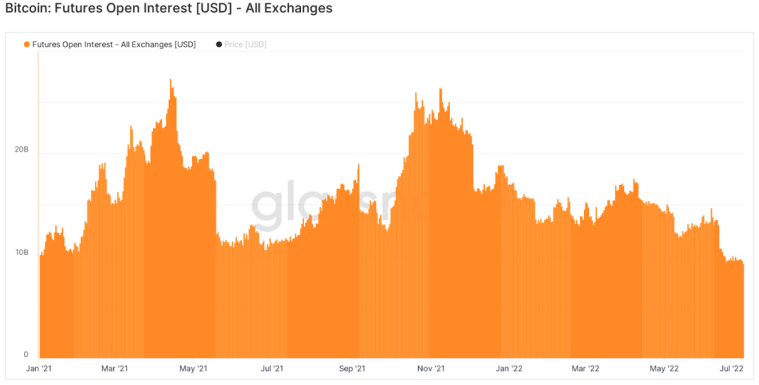
Source: Glassnode
Open futures contracts can illustrate how much money is currently in position and looking to capitalize, as well as what direction the majority of spectators believe we could be headed. Open interest has been on a clear decline through the first two quarters of the year, a signal that retail traders could have their attention focused elsewhere. Even as future interest is fading, there was still $9.5 billion in positions for the last quarter. However, this is down 65% from the highs of May 2021 at $27.5 billion and 44% down YTD overall.
In addition, the funding rate can add an extra signal regarding the expected direction of the market. A positive funding rate can mark bullish sentiment, while a negative funding rate could mean spectators are leaning bearish. This past quarter ended on a more bearish note with a negative funding rate of -.009%.
Lightning Network
Many Bitcoin enthusiasts feel that the Lightning Network is paramount for the future of the cryptocurrency and its potential real-world applications. Lightning is a Layer 2 solution that can potentially aid BTC to overcome its scaling roadblocks by making transactions both faster and cheaper. The success of this Layer 2 has massive implications for the future of BTC as the scaling and network congestion issues have been the among most criticized aspects of the cryptocurrency.
The last quarter closed with more than 4,000 BTC on Lightning. Compared to June 2021, that is more than double the amount. It also accounts for a 21% increase from the 3,300 BTC that was noted on January 1, 2022.
Disclaimer: Information provided by CEX.IO is not intended to be, nor should it be construed as financial, tax or legal advice. The risk of loss in trading or holding digital assets can be substantial. You should carefully consider whether interacting with, holding, or trading digital assets is suitable for you in light of the risk involved and your financial condition. You should take into consideration your level of experience and seek independent advice if necessary regarding your specific circumstances. CEX.IO is not engaged in the offer, sale, or trading of securities. Please refer to the Terms of Use for more details.