
Support and resistance zones are some of the most important concepts in technical analysis, and foundational to understanding numerous aspects of trading. Whether analyzing chart and candlestick patterns or assessing indicators and oscillators — all this is done with support and resistance basics in mind.
Support and resistance areas can act as barriers that occur where the price has shown a tendency to reverse in the past. At first glance, the idea behind identifying these levels seems quite straightforward. However, support and resistance zones come in various forms, and understanding their nuances is critical to mastering each concept.
In this article, we’ll dive into different ways to spot support and resistance zones, as well as how to evaluate their significance.
Understanding support and resistance
Support indicates a price level where the buying pressure can be potentially more significant than the selling pressure. As the price of an asset drops, the demand for that asset may increase, at which point the downward price movement would cease. These points are known as support zones. Meanwhile, resistance zones arise because of increased selling interest as the price moves upwards. As a result, support and resistance are considered areas that could be more difficult for the price to overcome. If both support and resistance are considered strong, the price may remain within a certain range.
To put it simply, imagine two opposing forces (buyers and sellers) that put pressure on the market, moving the price in one direction or another. In this case, the resistance area may act as a seller’s fortress, which could be difficult for the buyers to come through without enough pressure. Conversely, the support area represents the buyer’s fortress which buyers would like to protect.
Once the price approaches the support or resistance zones, there are two possible outcomes: rebound or breakout. If a rebound occurs, it means “those who attacked the fortress” put less pressure on the market than defenders, and retreated. In turn, breakout appears when the attacking force wins. In the case of a breakout, resistance levels tend to become support levels, and vice versa. This means the attacking force will most likely try to protect captured fortresses in the future.
Horizontal support and resistance
When it comes to support and resistance zones in trading, a key point of interest is the horizontal line. To identify horizontal support and resistance areas, try to touch as many lower or higher points as logically possible. Horizontal support and resistance lines are typically easily visible, meaning traders shouldn’t have to hunt or look hard for them.
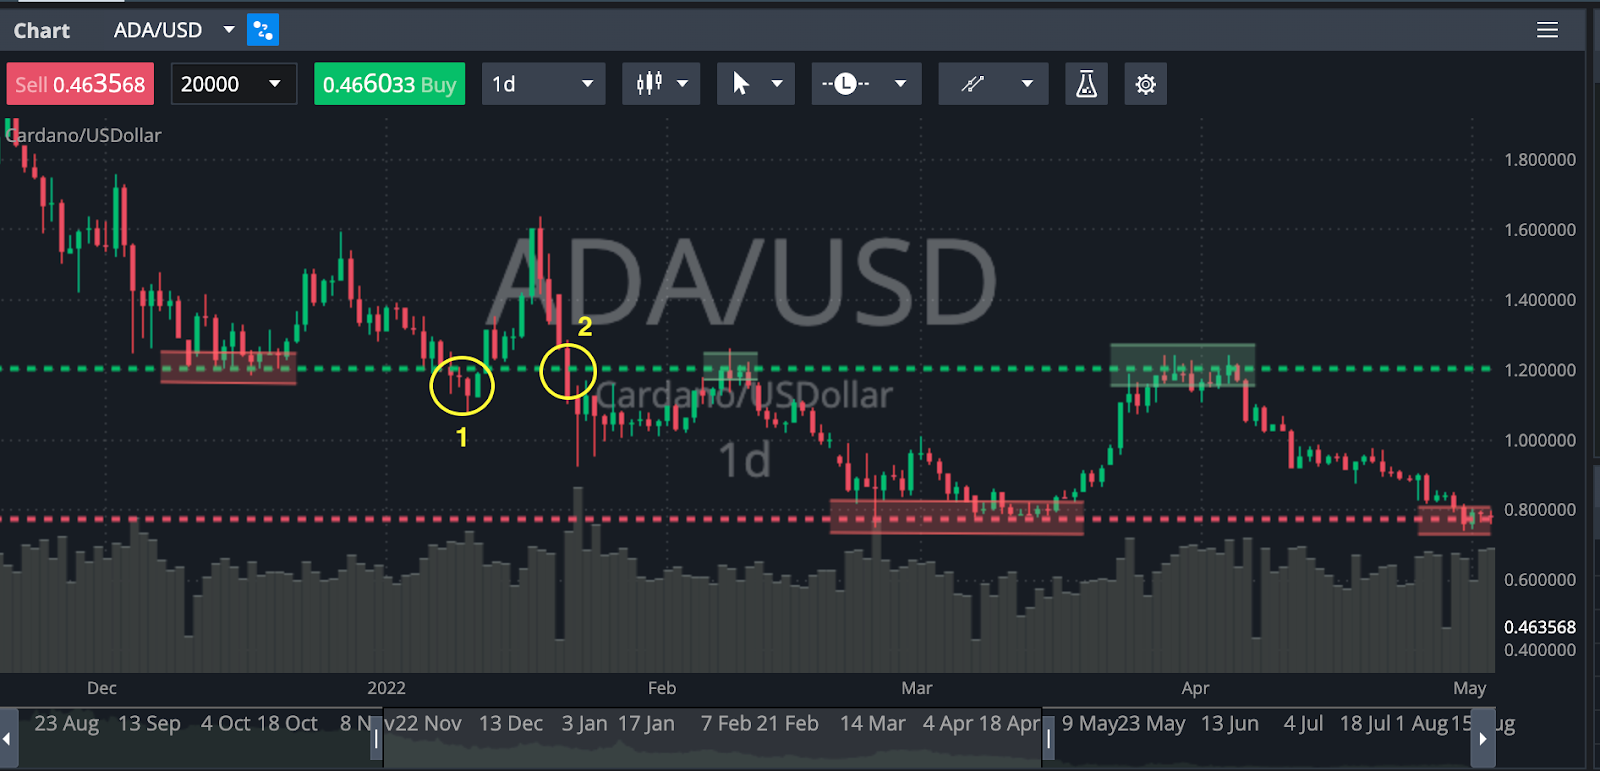
In the chart above, the green areas represent resistance, while the red blocks indicate support zones. It is acceptable if the support/resistance line crosses a candle or only touches the wick. Horizontal lines don’t have to be perfectly aligned since we try to identify zones rather than a perfect price line. It is worth noting that the green price level once acted as support, but then became a resistance line after the range of price dropped.
The first breakout (yellow circle 1) shows a vital concept of a false breakout, which is when the price quickly retraces back. It means there was not enough demand to defend recently broken support. The price also retraced back after the second breakout but sellers managed to protect it this time, forming a resistance area. These retraces are quite common and referred to as retests of support and resistance areas. If the area was defended after the breakout, the breakout is considered successful. However, if there is significant pressure after the breakout, there can be no pullback.
Psychological support and resistance
Quite often, support and resistance can be found near round-number exchange rates. These support and resistance areas are also known as psychological levels. Psychological levels are purely the result of human behavior as traders interpret these levels to be important. As a result, market participants tend to put their buying or selling orders near these levels, forming strong price barriers.
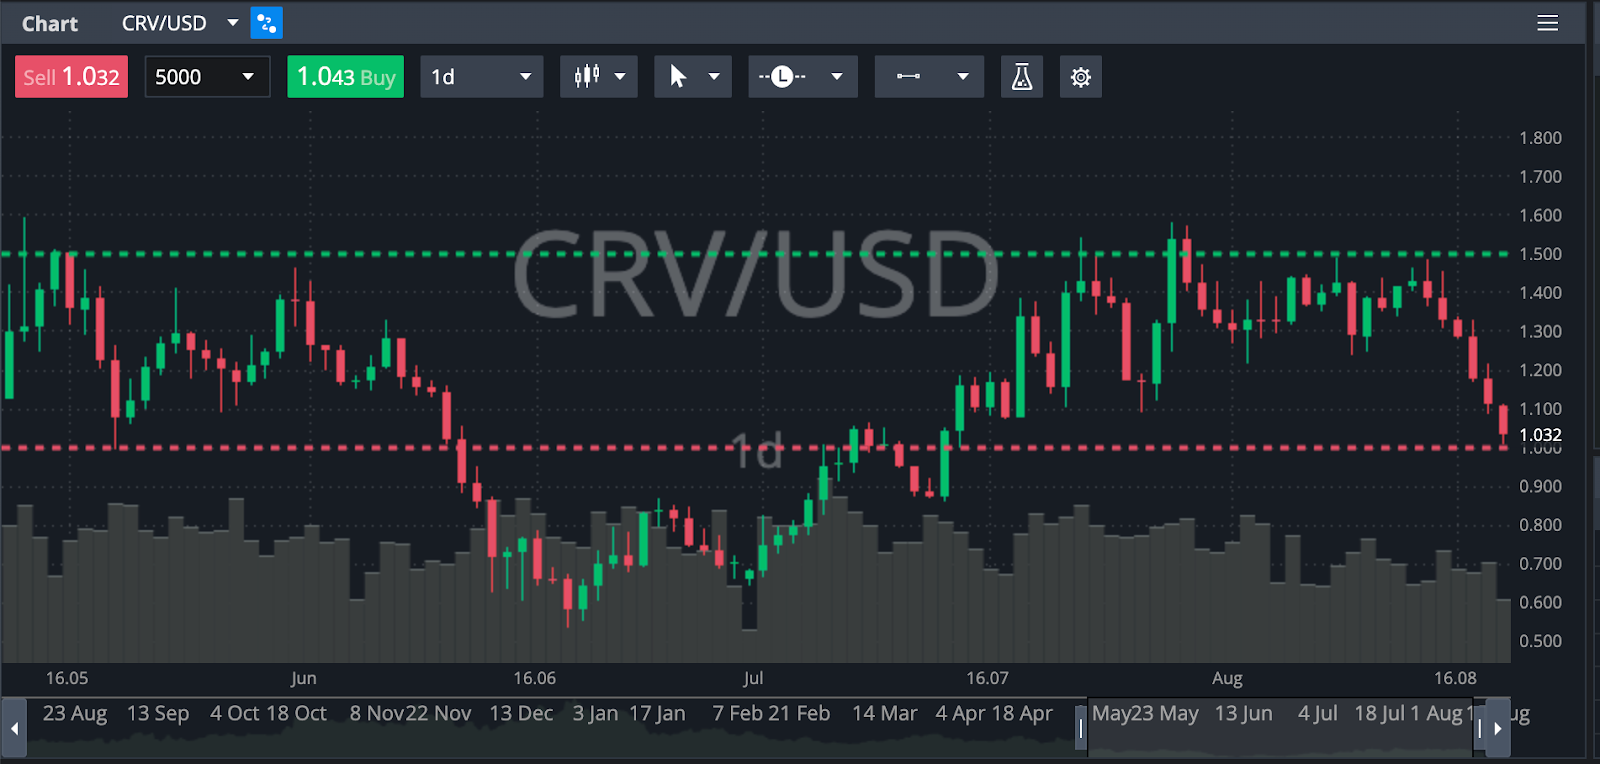
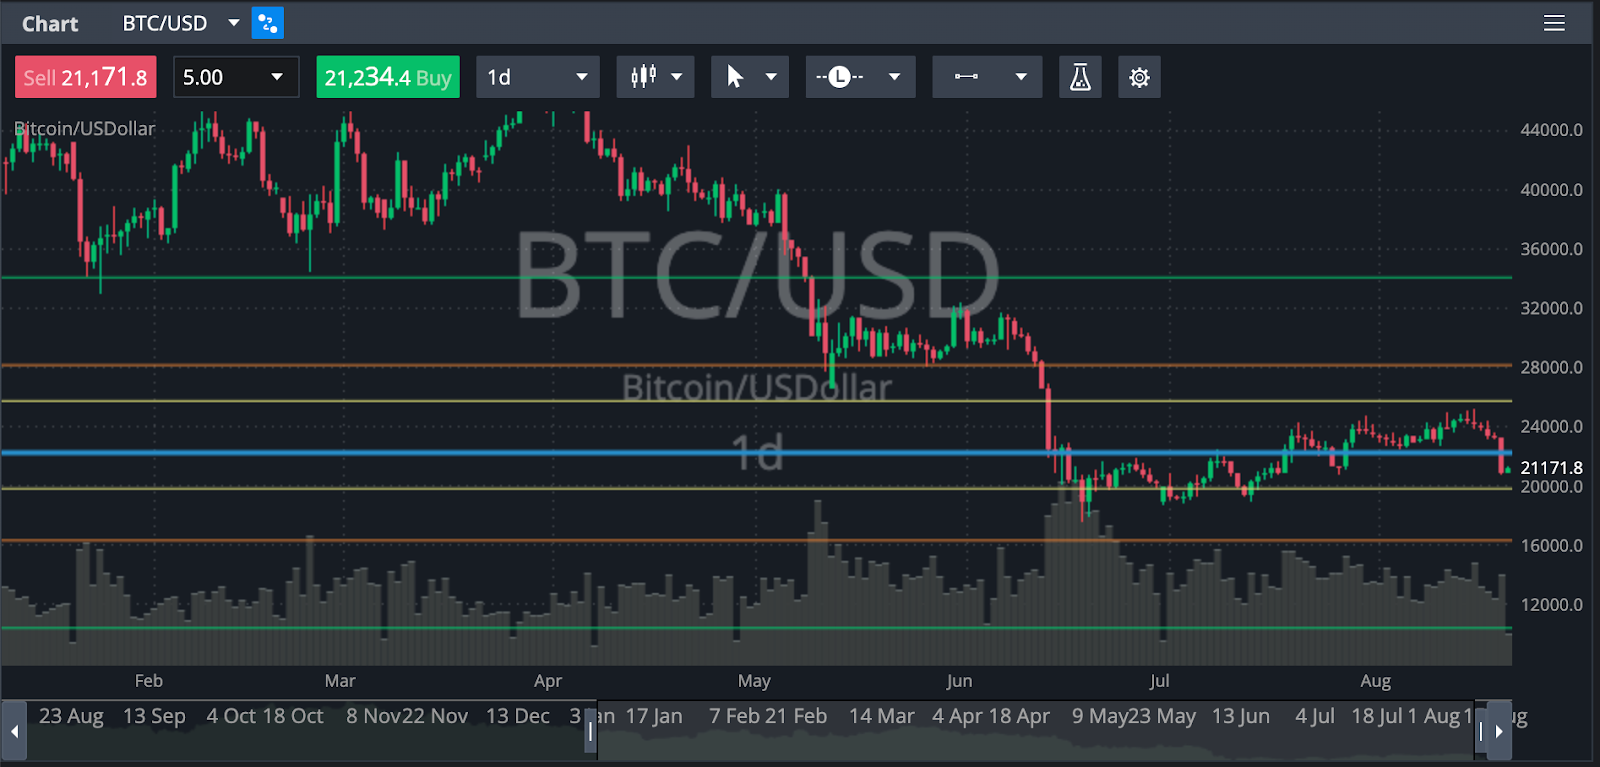
In some cases, round-number support and resistance levels may form horizontal lines. For example, in the chart below, the resistance and support areas can be found near psychological levels of $1.50 and $1 respectively.
Trendlines as support and resistance
Support and resistance areas can follow the price as the trend progresses, forming what are called trendlines. Consecutive valleys form a support line, while a series of peaks with similar highs indicates the formation of a resistance line. Each time the price approaches a trendline, there is a higher chance that the price will bounce off it. To draw a trendline, you need to locate at least two major valleys or peaks during the trending market and connect them. However, it’s important to note that it takes at least three valleys/peaks to confirm a trend line.
The steeper the trendline, the less reliable it is considered to be, which means it is more likely to break. However, trendlines become more valid the more times they are tested. A breakout of the trendline can be considered a potential trend reversal or a change in momentum.
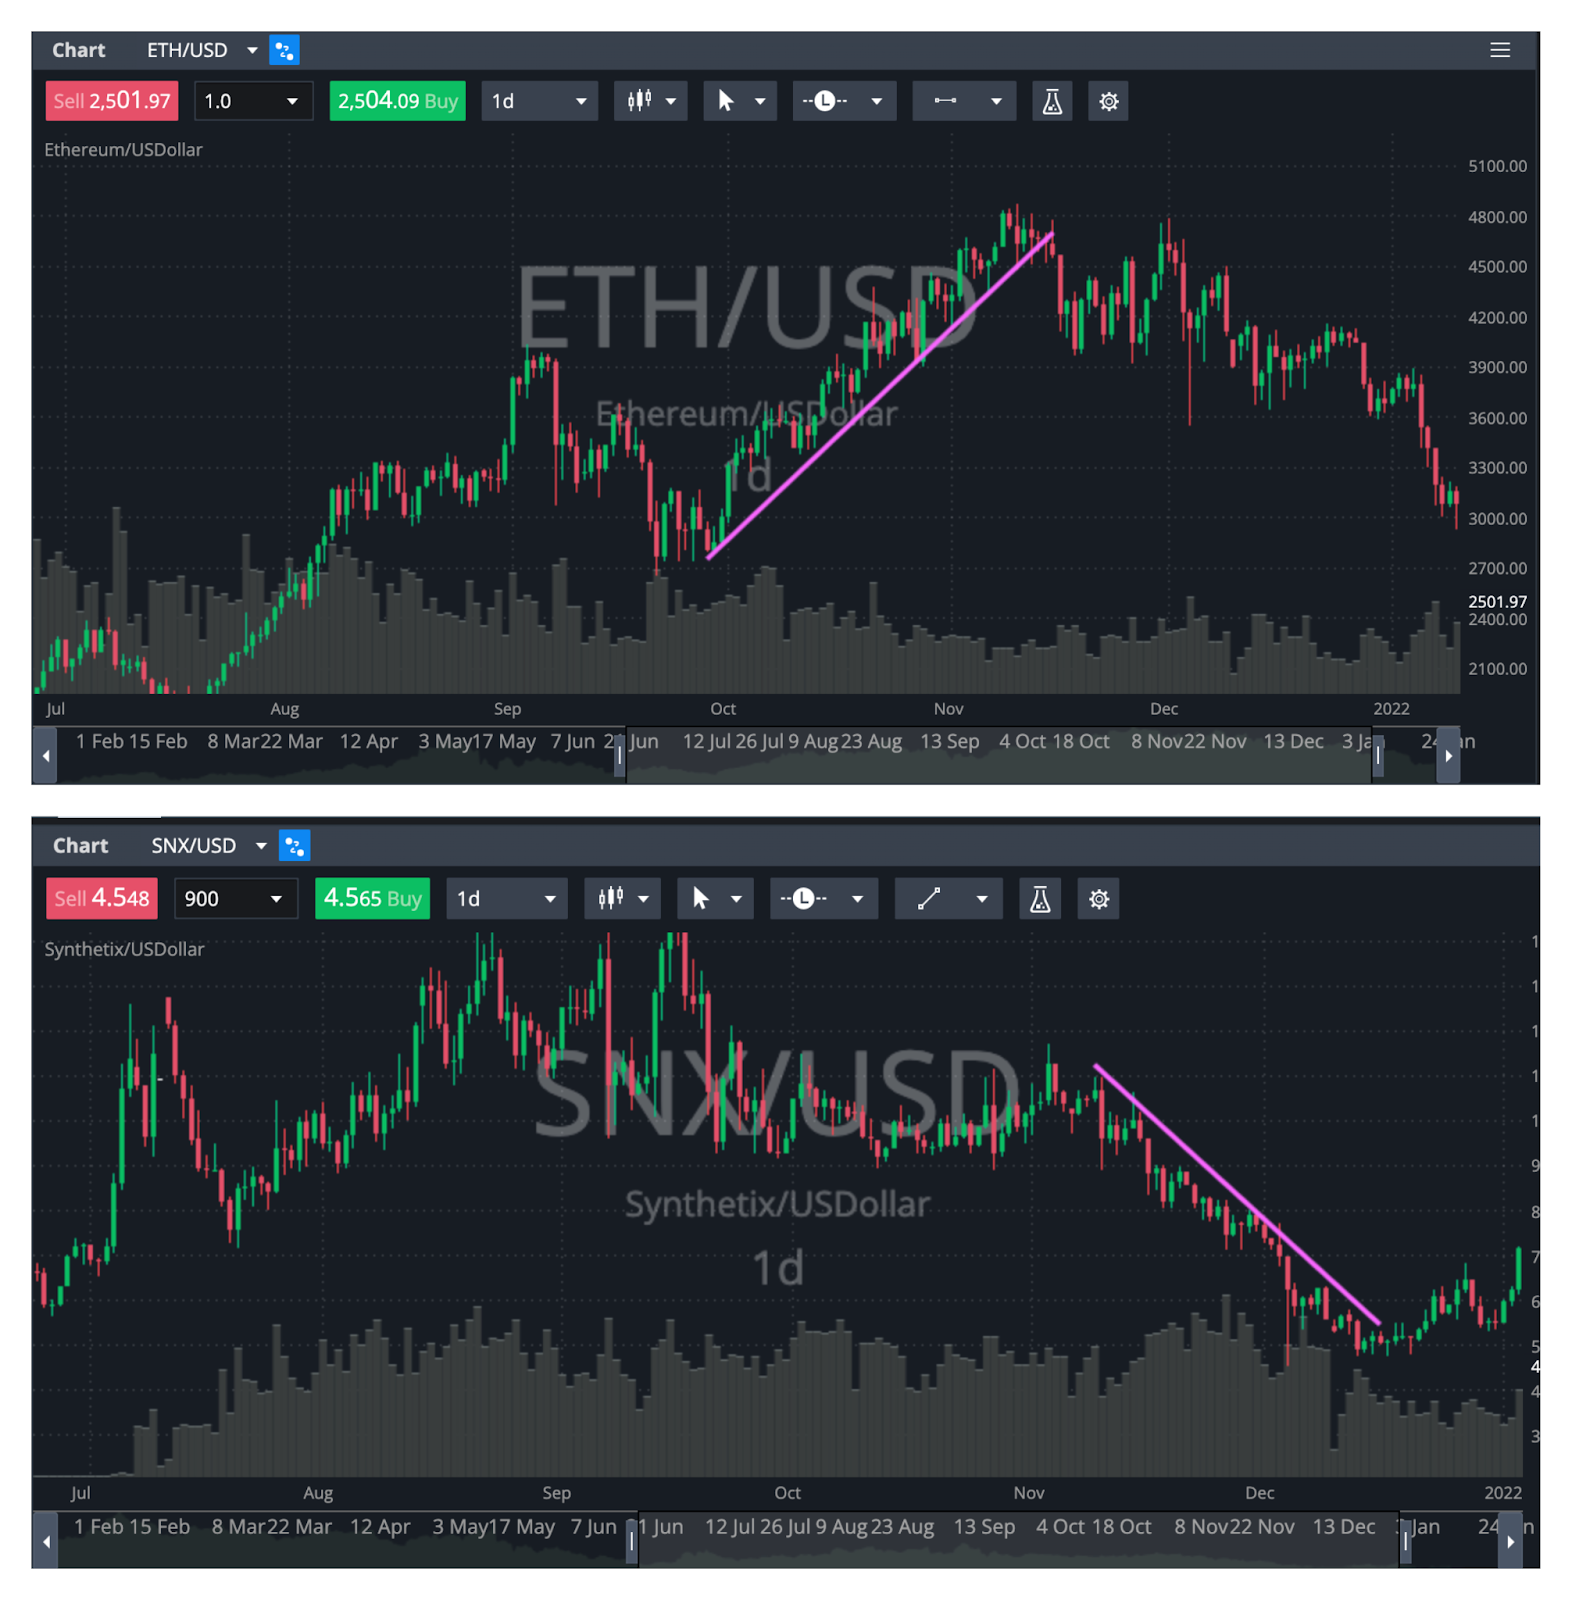
The upper image: support line during the uptrend. The lower image: resistance line during the downtrend.
Similar to trendlines, trading channels can also be used to identify support and resistance levels. A channel provides both support and resistance for the price by its lower channel line and upper channel line respectively. Learn more about using trendlines to uncover support and resistance levels in this CEX.IO University article.
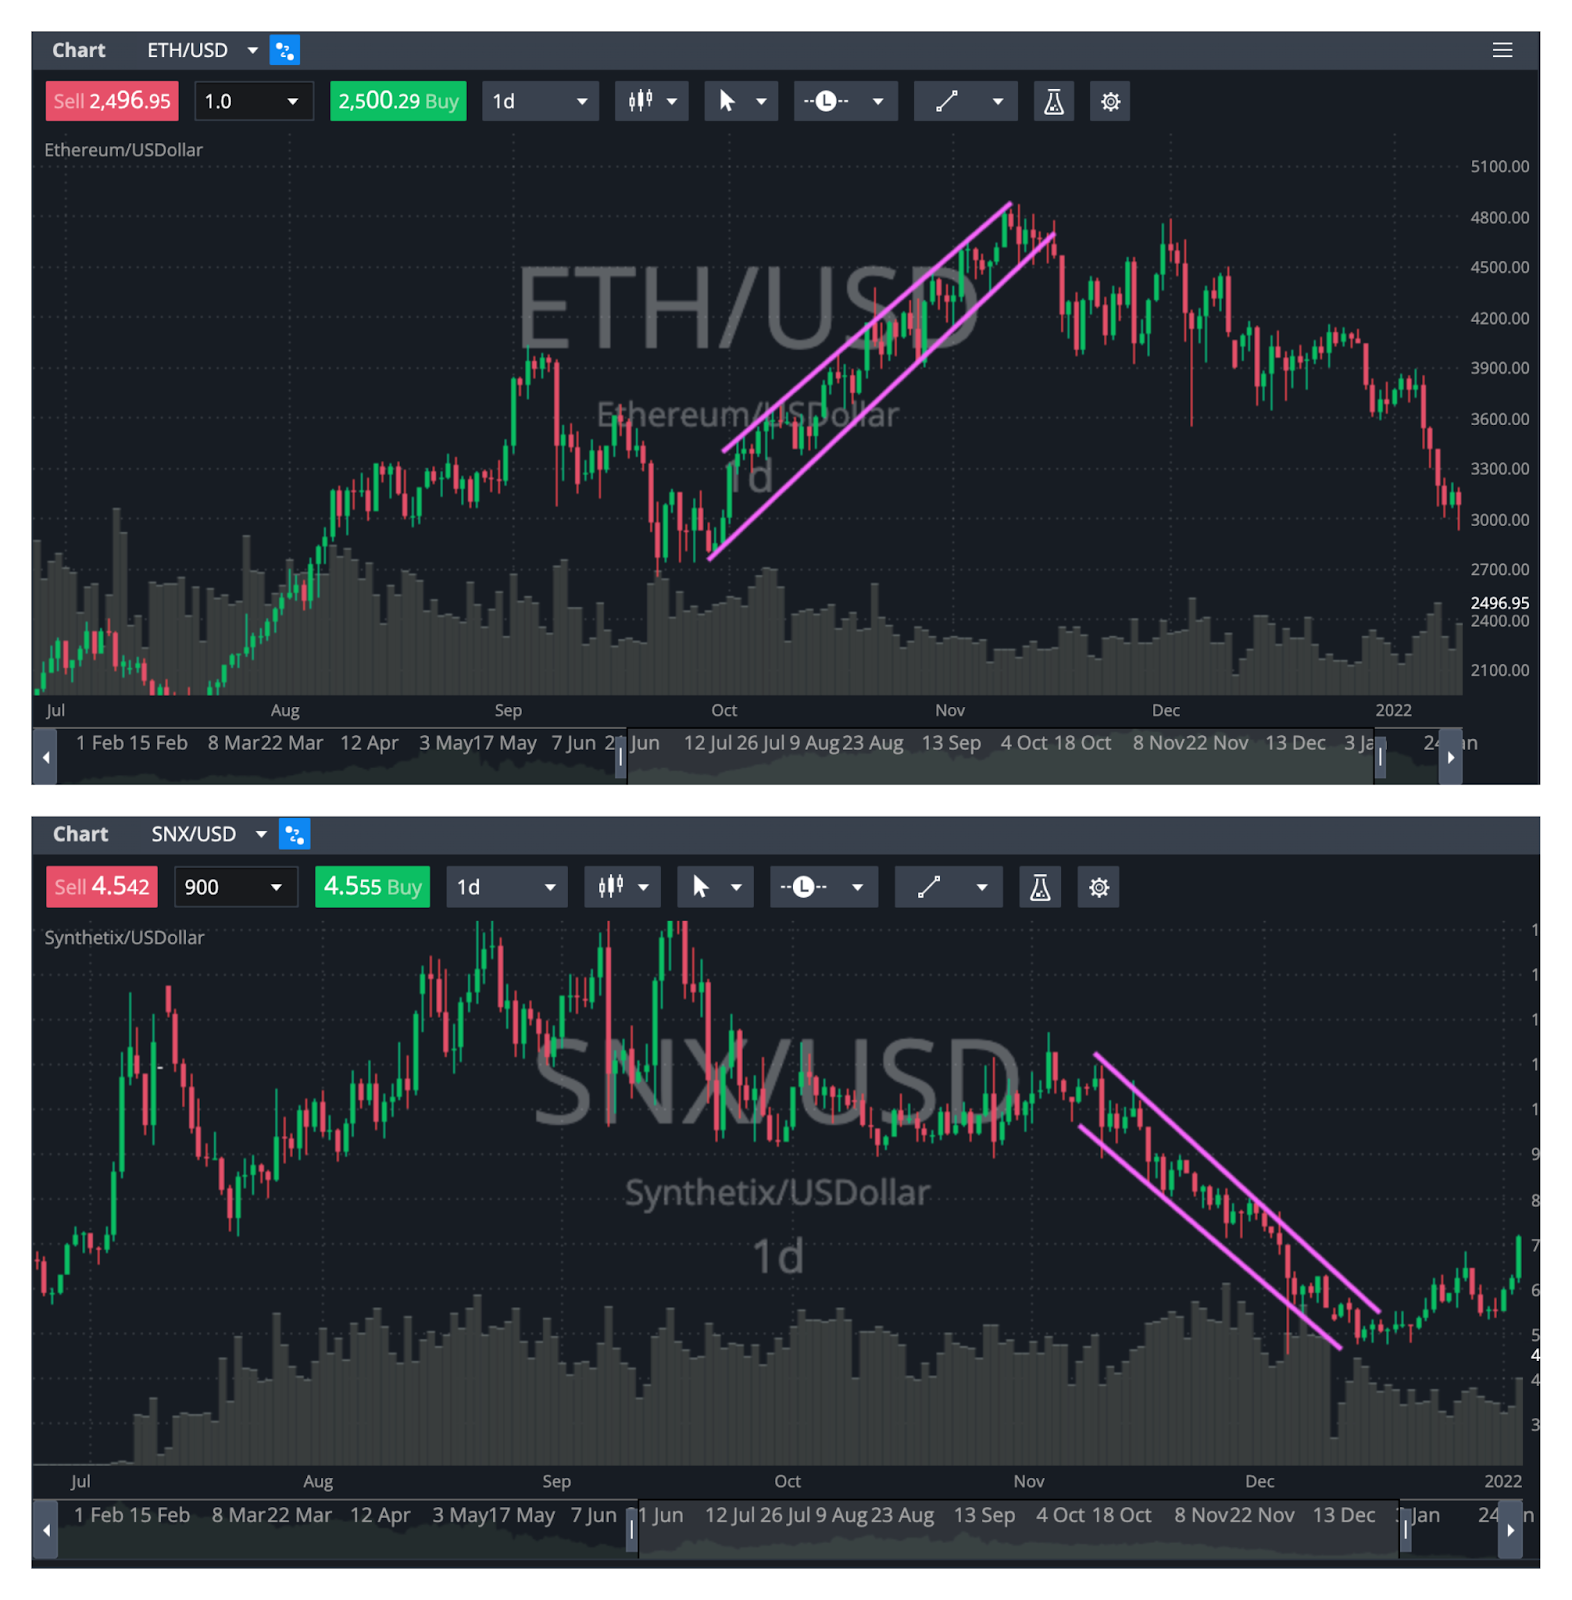
The upper image: ascending channel. The lower image: descending channel.
Dynamic support and resistance
As the name suggests, dynamic support and resistance levels change with consecutive price movements (candlesticks). Moving averages are considered the most common way to identify potential dynamic support and resistance levels, especially exponential moving averages (EMA). EMA gives additional weight to the most recent price data and a quicker response to price changes than a simple moving average (SMA).
When selecting a length, traders typically observe moving averages of round numbers like 20, 50, 100, 200, etc. When using EMA, Fibonacci numbers are also commonly used to determine support and resistance levels. Fibonacci numbers include 8, 13, 21, 34, 55, 89, etc.
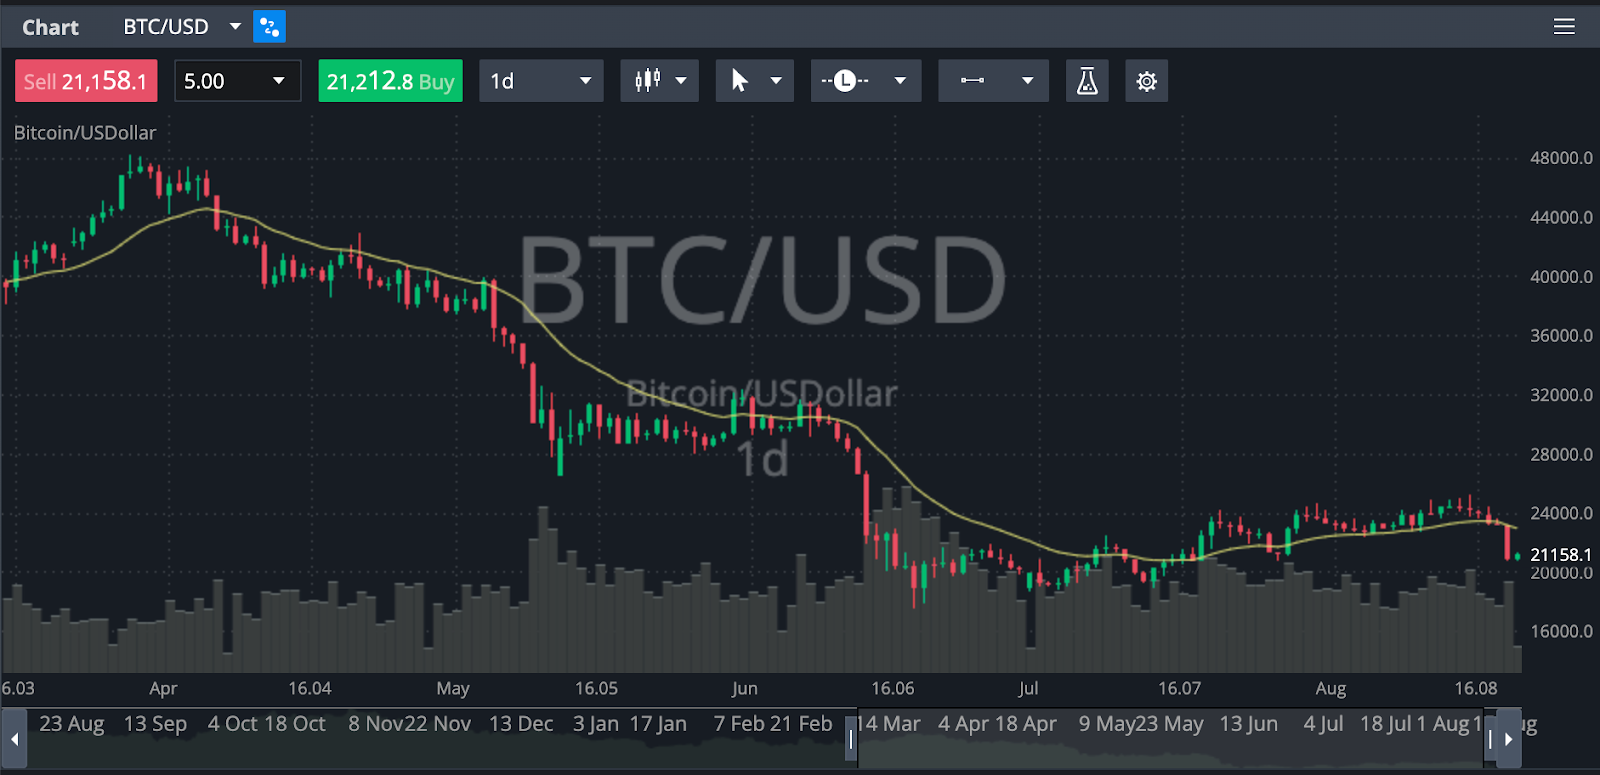
For example, in the chart above, the yellow line represents the 20-day EMA. It typically acts as dynamic support during an uptrend and as a dynamic resistance during a downtrend. Breaking through major moving averages such as 20-day EMA may indicate a potential change in momentum or a trend reversal. Regardless of the length used for moving averages, traders might want to watch for support and resistance in different time frames to evaluate the significance of observed levels.
Traders may also use moving averages to anticipate potential price action when moving averages cross each other or assess potential price targets after breakouts. To learn more about EMA trading strategies, check out our article.
Other ways to identify support and resistance
In technical analysis, multiple indicators may help traders identify potential barriers to future price actions. These indicators may look complicated at first, but they predominantly interpret support/resistance lines similar to more basic methods.
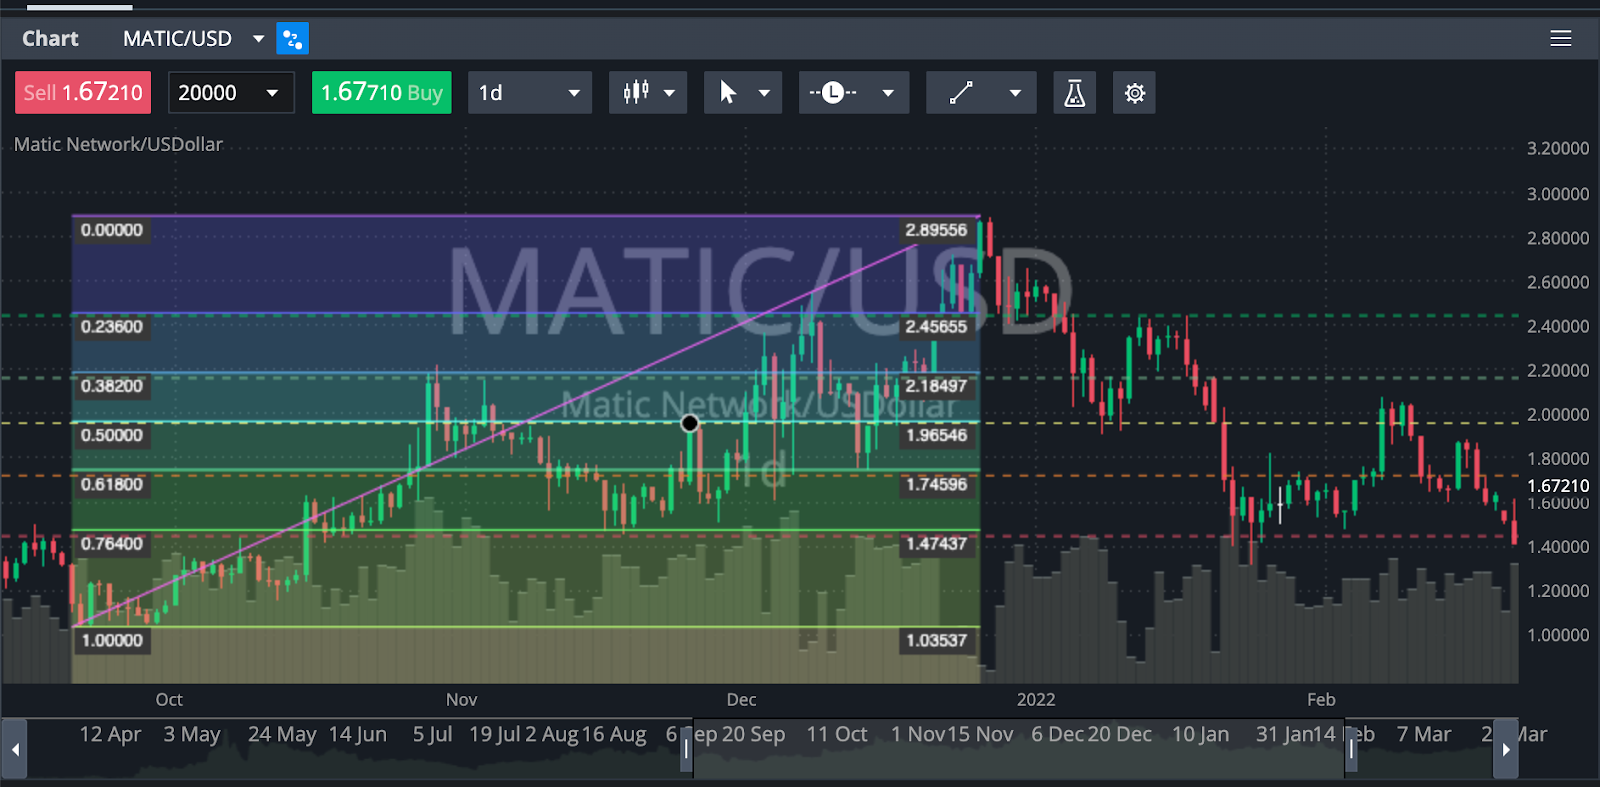
For example, the Fibonacci retracement tool is quite popular for identifying price levels where a price correction might end or face a barrier. This indicator is based on the Fibonacci ratio, also known as the Golden Ratio, which is quite common in nature. The reasoning behind how this indicator calculates various levels of support and resistance can be quite difficult. But to use it, traders just need to find recent significant highs and lows.
As you can see in the chart below, the Fibonacci retracement tool provides a set of levels between the selected swing high and low that may act as support or resistance for the price.
Another way to identify support and resistance zones is pivot points. Pivot points are very similar to Fibonacci levels but with a few key differences. Where Fibonacci retracement tools are considered more subjective, because of picking swing high and low, pivot points are mathematical computation levels based on the previous day’s high, low, and closing prices. Most charting tools can automatically generate pivot points, so those who hate algebra can use pivot points without the fear of making a mistake.
Trading tools will typically show an intermediate pivot point and three lines for both support and resistance at approximately the same distance. In the chart below, the intermediate pivot is shown as a blue line, meaning it is located in the middle, between the potential support/resistance levels.
How to measure the significance of support and resistance
Price charts allow traders to visually identify support and resistance areas and infer clues regarding their significance. When analyzing the charts, traders typically look at the following parameters.
Number of touches
It is generally accepted that the more times the price tests the support/resistance area, the more significant the level becomes. Due to consecutive retests, more buyers and sellers that notice bounces from support/resistance may choose to start adapting their trading decisions on these levels.
However, as levels are tested, support/resistance can get stronger or weaker depending on who is putting the most pressure on the market. This can be compared with the siege of a fortress. If the attacking force is constantly trying to capture the fortress but fails, it may eventually exhaust itself and lead to a change in momentum. At the same time, if significant pressure from the attacking force remains, it may become more difficult for defenders to protect the fortress. Eventually, if there is enough momentum, a breakout could happen after a series of retests.
Time
If the support/resistance is not tested constantly but at regular intervals, this can also increase its significance. If buyers or sellers manage to defend a certain level numerous times, the level becomes more noticeable. Let’s call it an iconic fortress. Capturing such a fortress may provide a significant morale boost for the attacking force, meaning a breakout of this level could attract new buyers/sellers.
Preceding price action
If the support/resistance zone occurred after the steep price movement, it could become more significant in the future. People typically notice what level becomes the final point of a steep price movement, because such price actions attract a lot of attention. It could be called a heroic fortress that stopped the major attack. In the future, traders could consider breaking this point a major achievement for buyers or sellers.
Volume behavior at certain price levels
The more buying and selling that has occurred at a particular price level, the stronger the support or resistance level is likely to be. Volume may hint at how much effort buyers or sellers put into proceeding with the price movement.
Conclusion
Support and resistance are key concepts used in technical analysis that often prove foundational for many advanced trading strategies. Determining potential support and resistance may help traders anticipate future price movements by inferring how market participants may behave at different price levels. It is worth noting that there is no best method to determine support/resistance and that a variety of approaches may prove effective in different market conditions. If you want to put your knowledge of support and resistance into practice, you can trade crypto on CEX.IO. CEX.IO features over 200 crypto-to-crypto and crypto-to-fiat markets, empowering users to trade major cryptocurrencies, utility tokens, DeFi tokens, and stablecoins. Check our Trade page to discover markets supported on CEX.IO.
Disclaimer: Information provided by CEX.IO is not intended to be, nor should it be construed as financial, tax, or legal advice. The risk of loss in trading or holding digital assets can be substantial. You should carefully consider whether interacting with, holding, or trading digital assets is suitable for you in light of the risk involved and your financial condition. You should take into consideration your level of experience and seek independent advice if necessary regarding your specific circumstances. CEX.IO is not engaged in the offer, sale, or trading of securities. Please refer to the Terms of Use for more details.