The U.S. Consumer Price Index (CPI) figure for May is scheduled to be released on Friday, June 10 which can have a strong say on financial markets’ next direction.
Although high inflation can be beneficial for markets in the longer run, in the short term it could cause uncertainty about how the Fed would react in terms of the interest rates. Markets do not like uncertainties so a higher-than-expected May CPI figure could trigger a new sell-off across the board, including cryptocurrencies.
The annual Consensus 2022 conference is set to take place this week between June 9 and 12 in Austin, Texas. Although this annual conference used to bring a lot of positive sentiment in the past years, which was accompanied by market rallies, altcoin prices have barely moved ahead of the event.
Considering that, investors should be careful about a possible sell-off following the conference as the market may run out of catalysts.
In this issue of the crypto ecosystem update, we will discuss Bitcoin’s next possible price moves by reviewing its technicals and on-chain activity. We will also analyze Ethereum’s ongoing descending triangle, which could be critical for the altcoin market as so many altcoins are undergoing the same bearish formation since their early May bottoms.
Bitcoin analysis
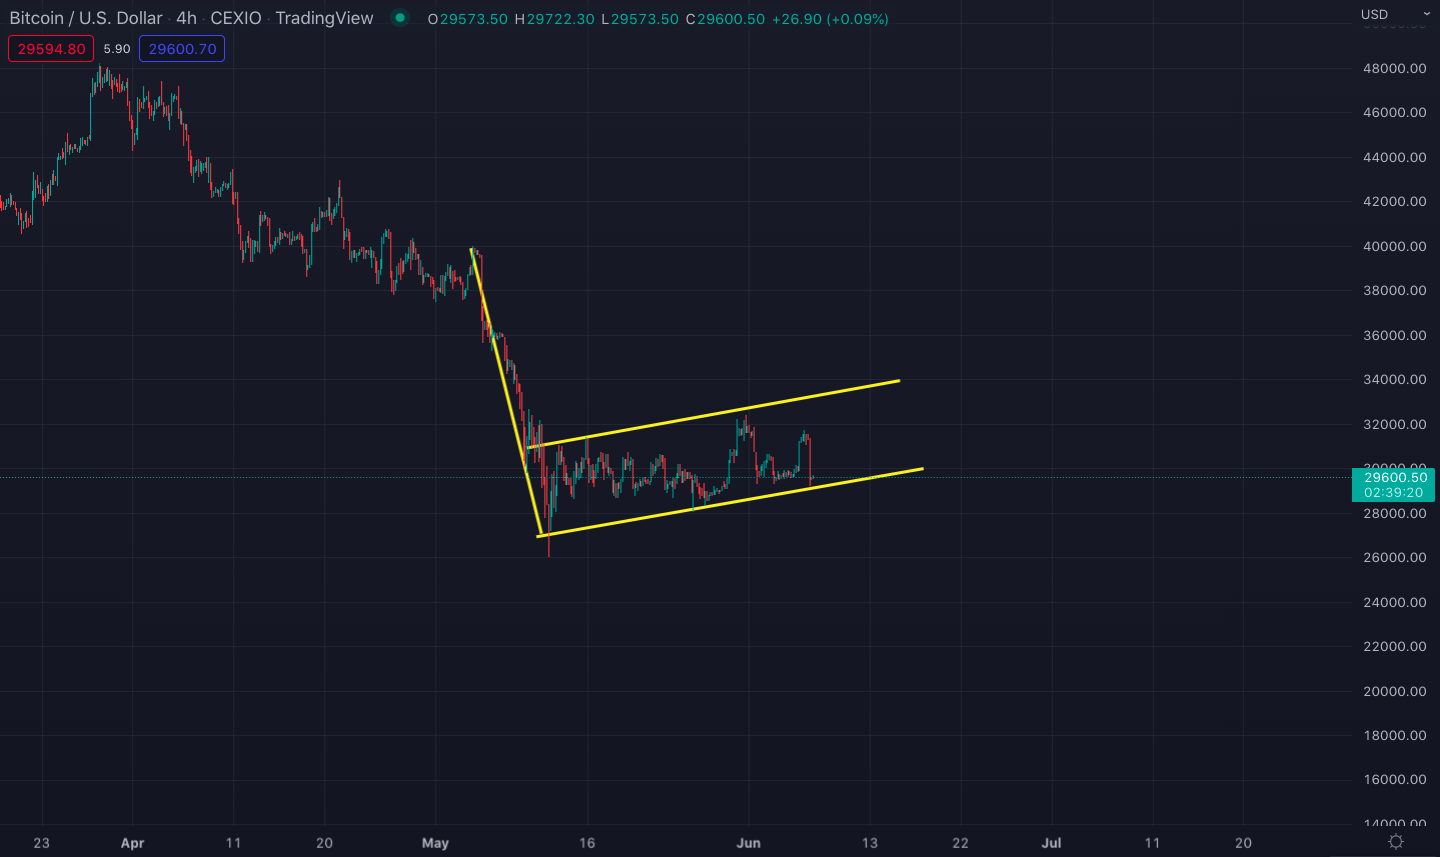
After Bitcoin broke out of its descending triangle on May 30 following a 20-day consolidation in the triangle, the price got rejected at $32,500. The top of the triangle worked as support on the way down at $29,300, which was followed by a 5% bounce on June 6. Bitcoin needs to break above the $32,000 resistance to advance to its next resistance at $38,000.
On the other hand, Bitcoin’s monthly stochastic relative strength index (RSI) has bottomed at zero as of June 1. Although this is a good sign for the long term (as the indicator is oversold now), it may also mean weakness in the shorter term which puts suspicion on Bitcoin’s recent uptrend.
- $32,000 resistance
You can see in the below chart that Bitcoin touched the top of the descending triangle at around $29,300 after getting rejected at $32,500. The price needs to make a few daily closes above $32,000 to be able to move upwards to its next resistance level.
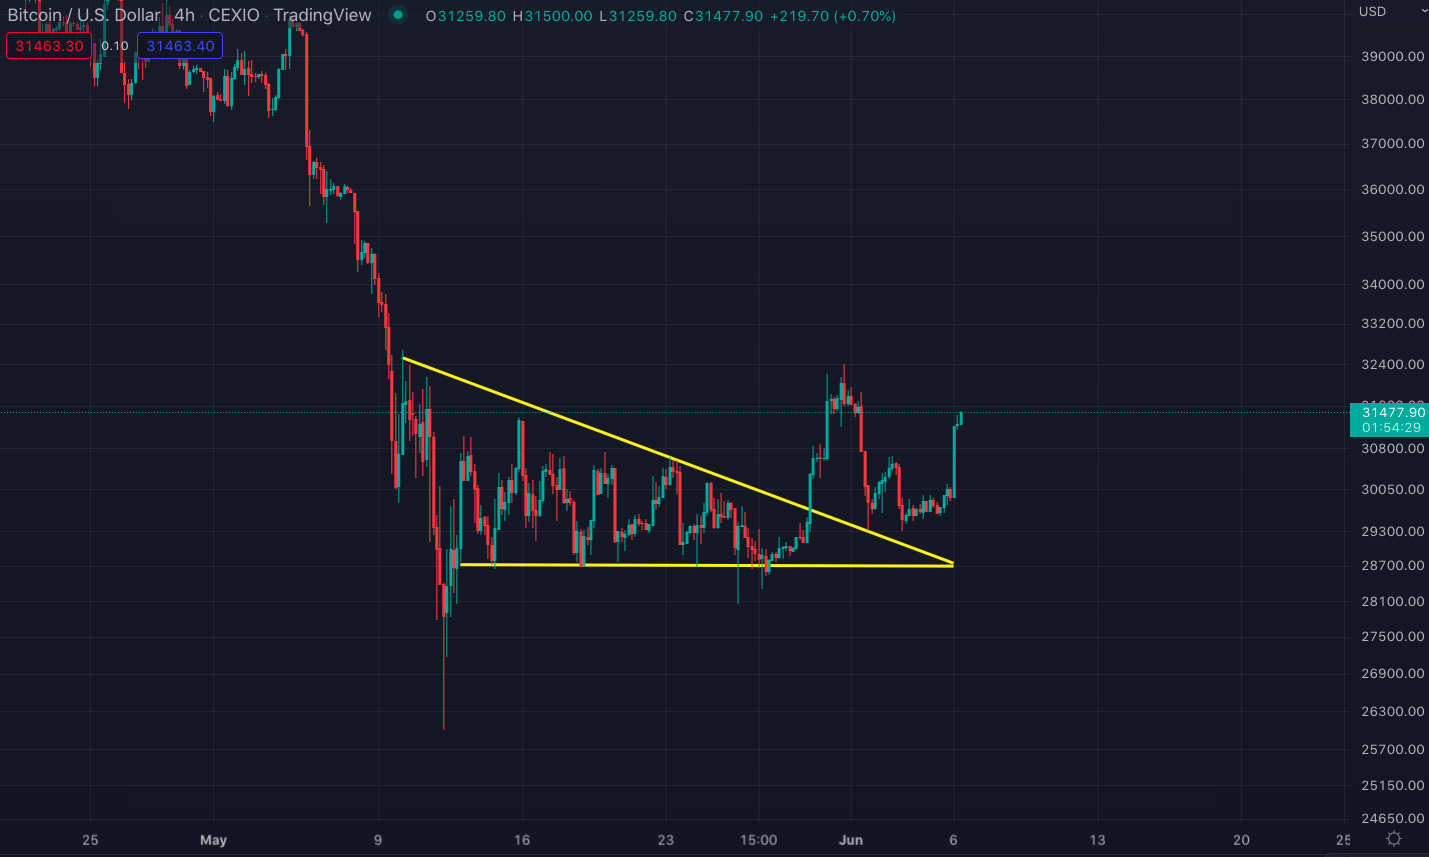
Bitcoin/U.S. Dollar price chart on a 4-hour time frame. Source: Tradingview
- $38,000 resistance
If Bitcoin can realize daily closes above $32,000, the next major resistance it would face is at around $38,000 because there is both a horizontal and a diagonal resistance at that level.
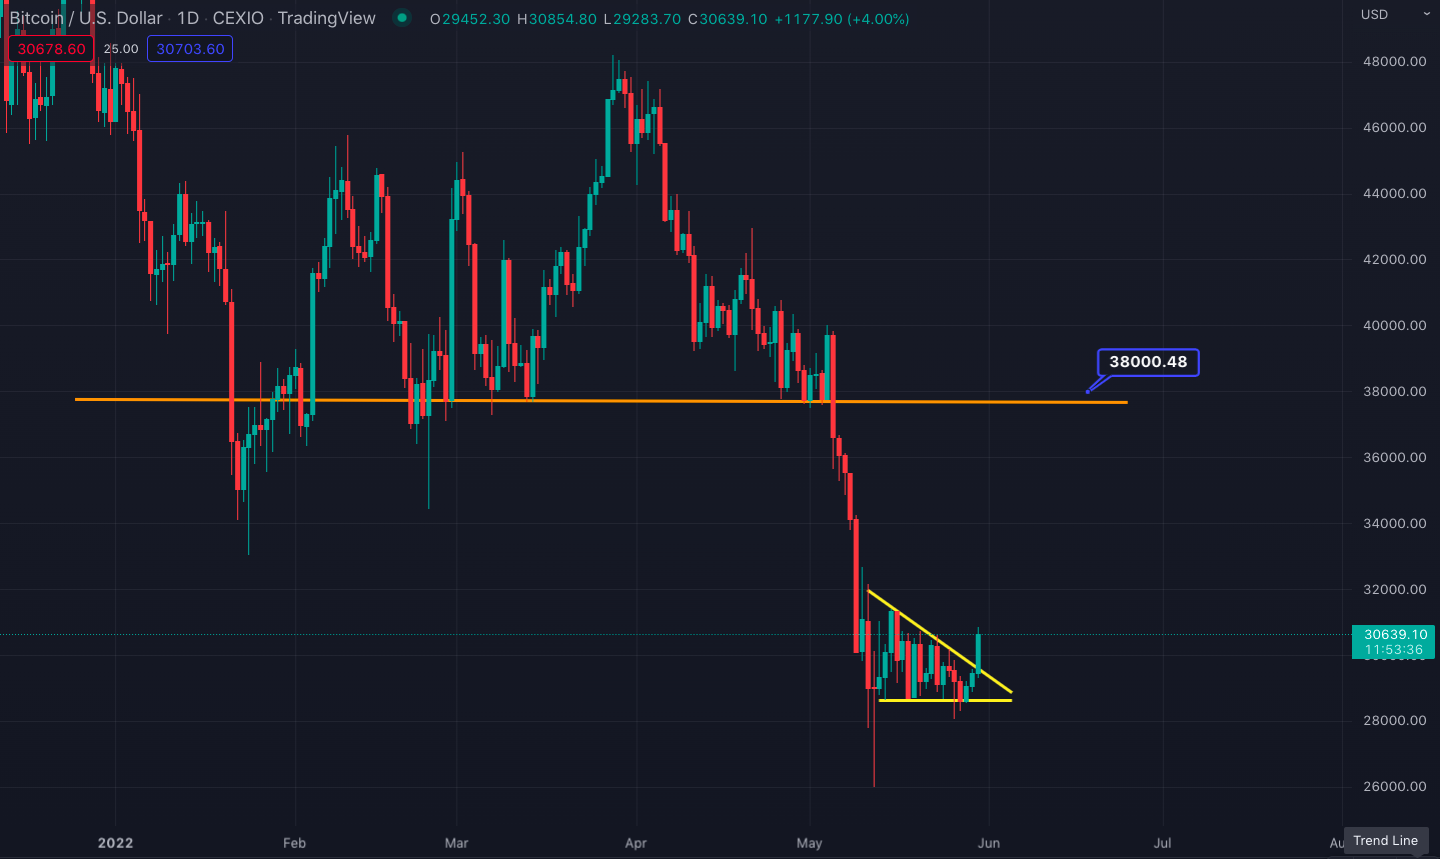
The horizontal $38,000 resistance on the daily Bitcoin/U.S. Dollar chart
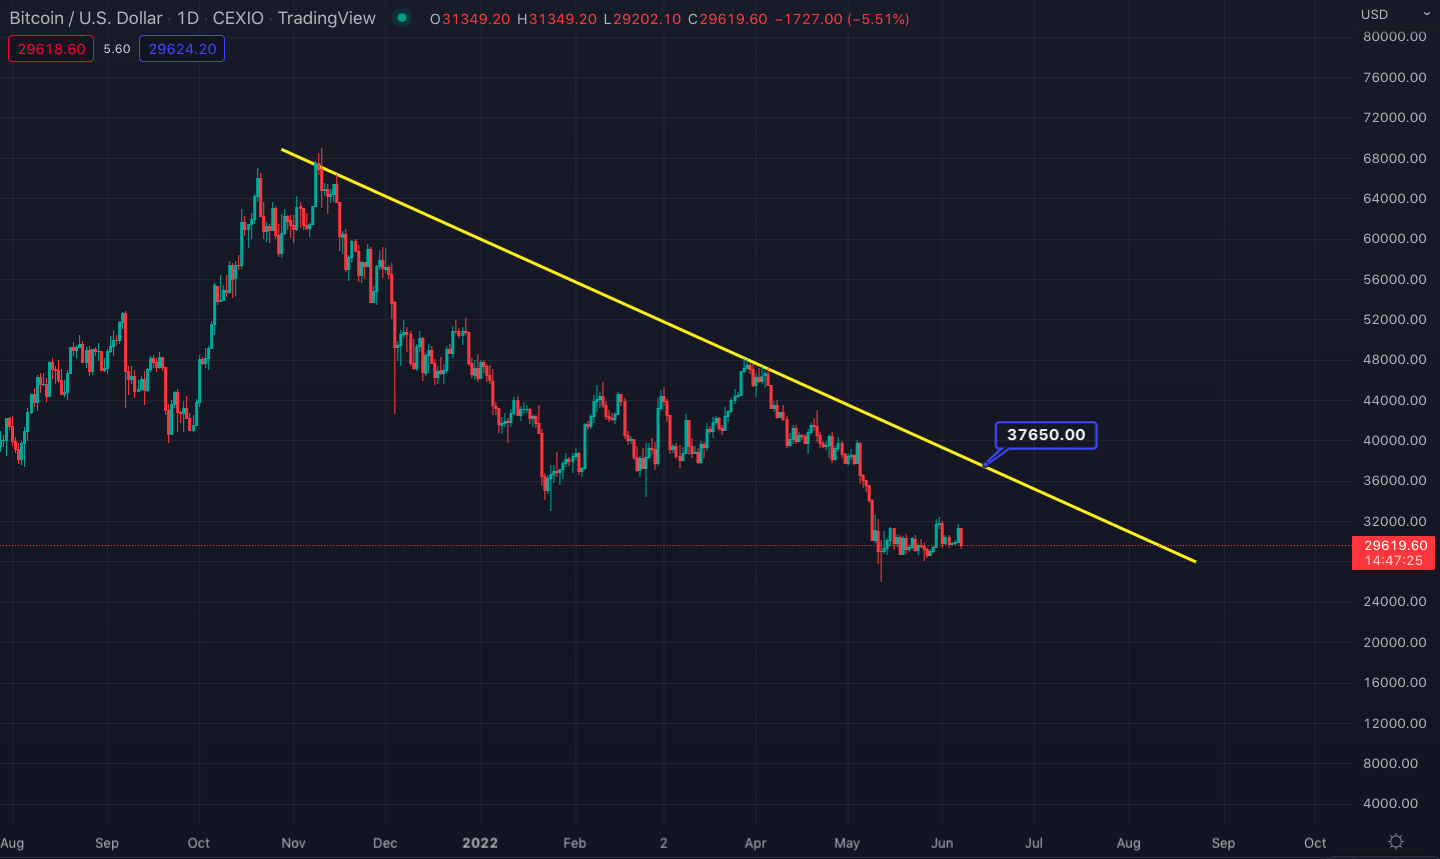
The diagonal $38,000 resistance on the daily Bitcoin/U.S. Dollar chart
Fibonacci retracement levels from the November top to May’s bottom also hint at a similar resistance around $38,000 (the 0.236 retracement) as you can observe in the below chart.
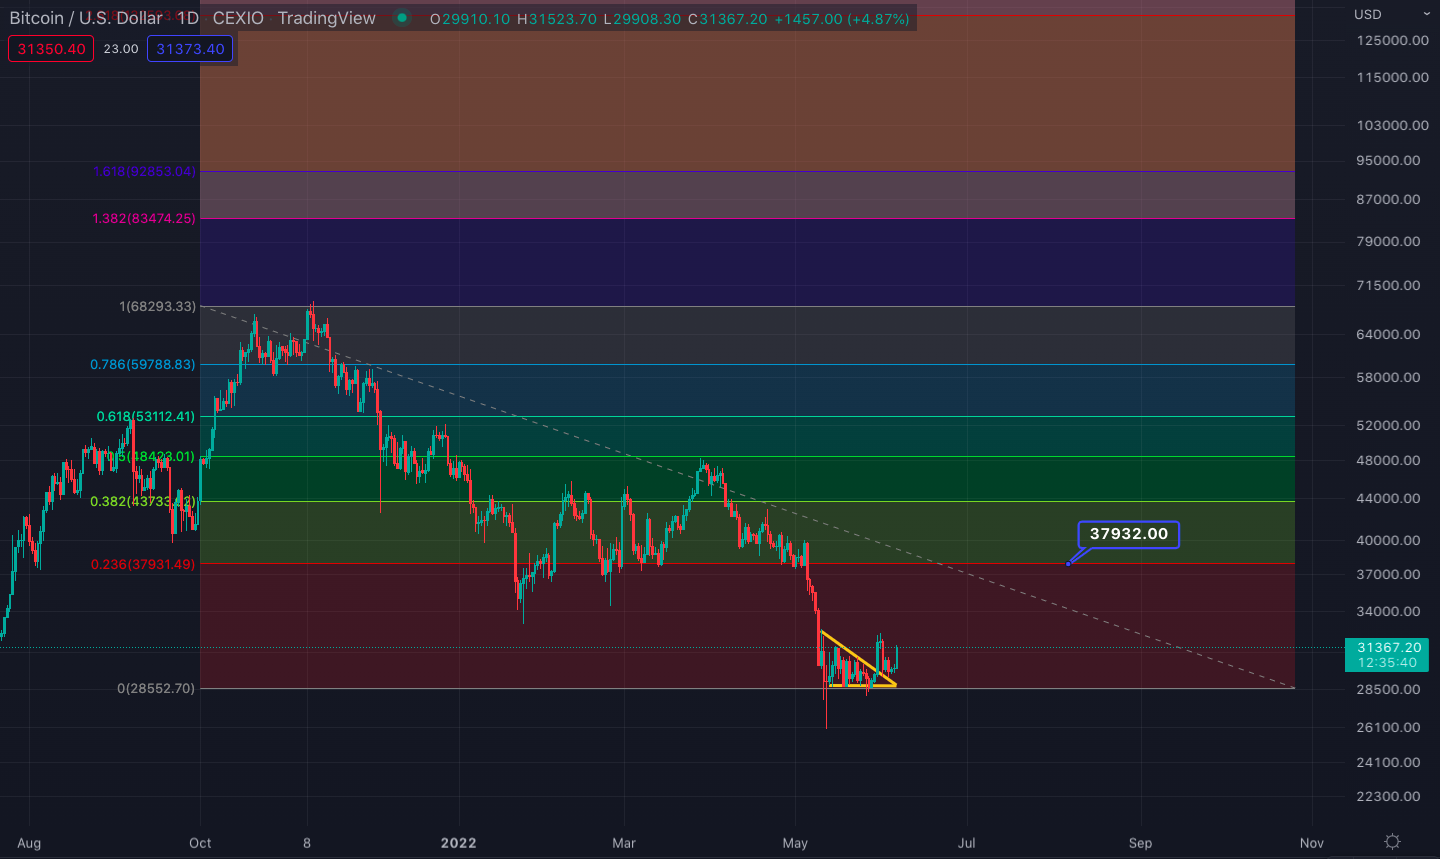
Bitcoin/U.S. Dollar daily price chart with the Fibonacci retracements
Regardless of what the technicals may show, this week’s CPI announcement will likely dictate Bitcoin’s next price move. An undesirable result could instead push the price in the opposite direction, down below the previous $26,000 support.
- A new bear flag formation
As a downside scenario, there is a new potential bear flag forming on the Bitcoin chart.
Bear flag formation on the Bitcoin/U.S. Dollar chart
When you invert the Bitcoin chart, the formation looks like a textbook bull flag:
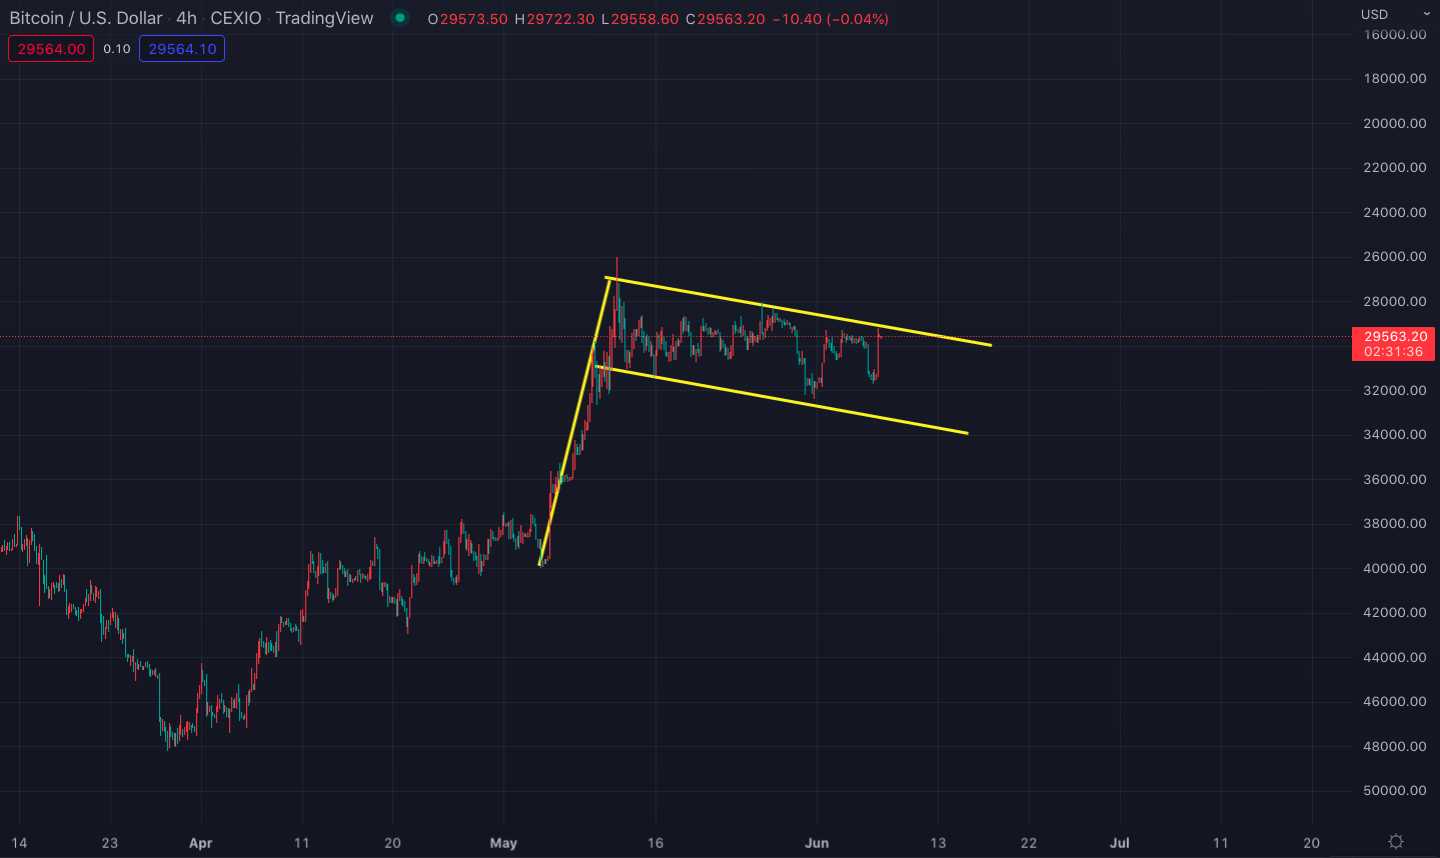
Inverted Bitcoin/U.S. Dollar chart with the bull flag formation
If the bear flag plays out, the target of the price movement can be estimated by taking the horizontal length of the flag pole and extrapolating it down from a possible breakout point. In that case, the target of the bear flag would be at around $16,000 per bitcoin:
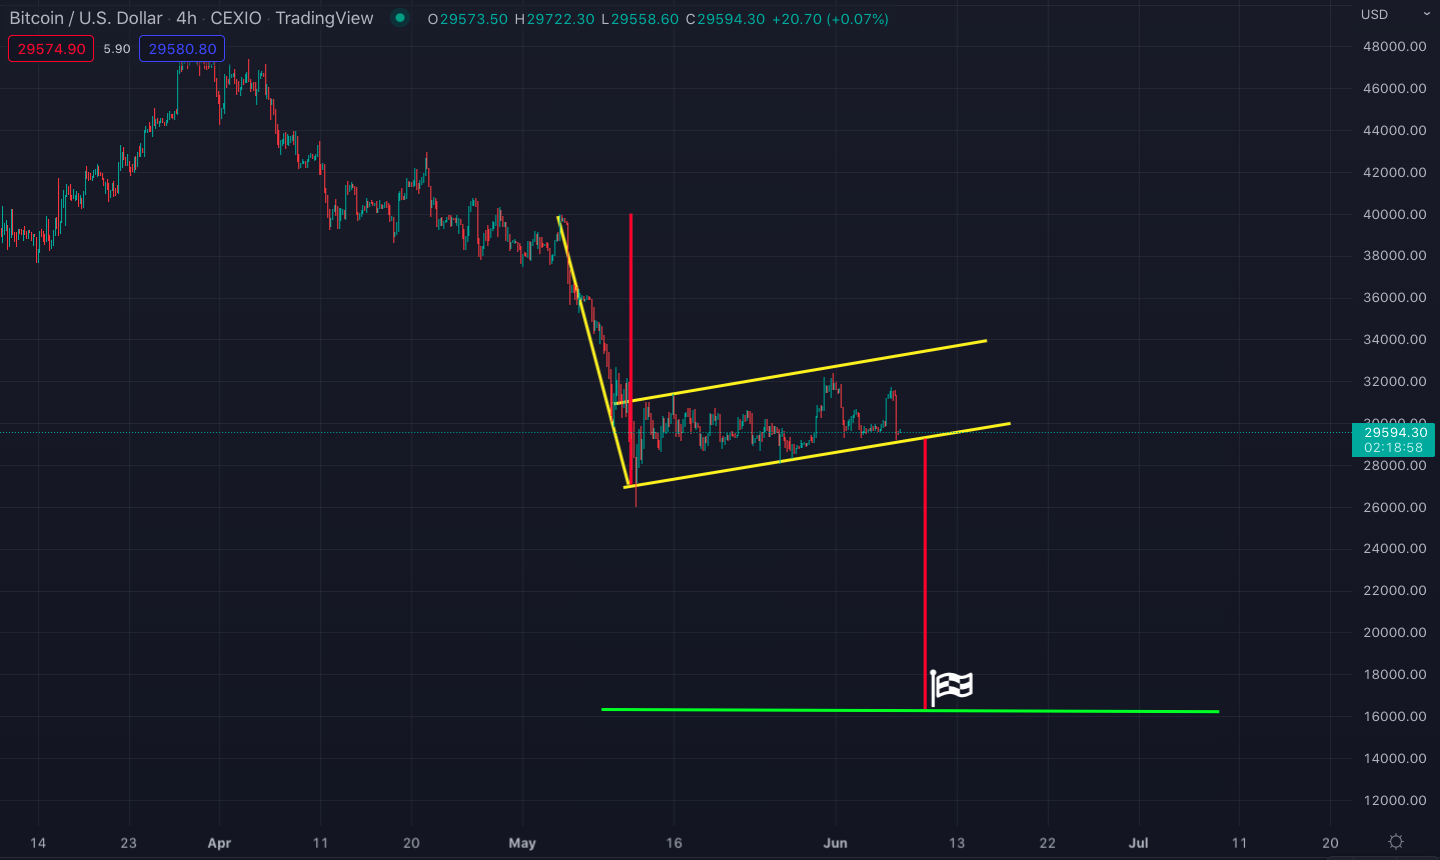
Possible bear flag target for Bitcoin
Some longer-term indicators, both technical and on-chain, also hint at further downside price action in the upcoming days.
- Monthly stochastic RSI bottomed out
Bitcoin’s monthly stochastic RSI ran out of momentum and zeroed out as of June 1. Historically, this suggests that the bottom is near for the market but it does not mean the Bitcoin price has bottomed yet. Bitcoin can keep dropping and make new lower lows as long as the monthly stochastic RSI cannot clear out of the 20 resistance area.
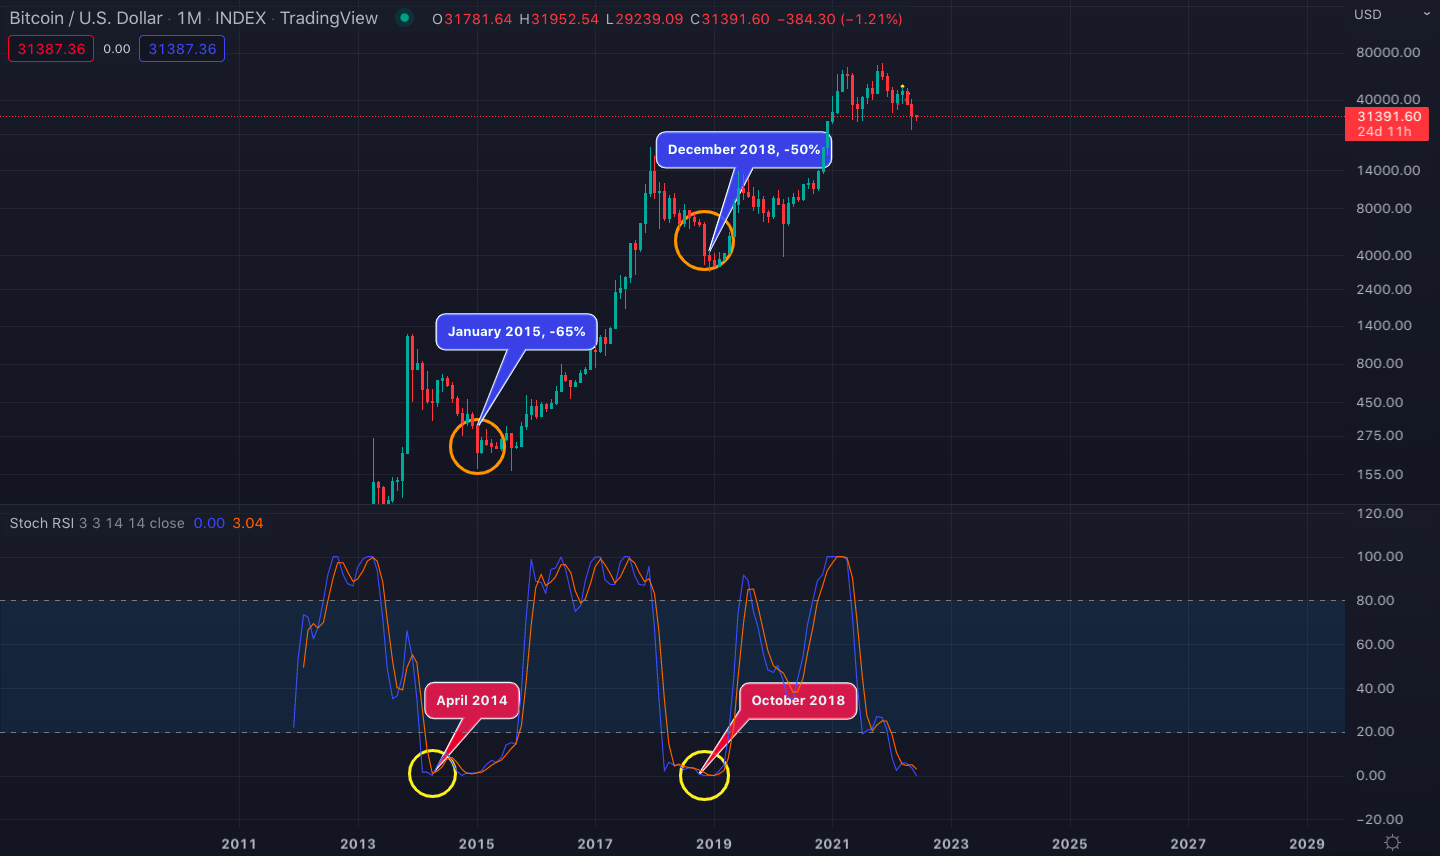
Monthly Bitcoin/U.S. Dollar price chart with the stochastic RSI momentum indicator
As you can see in the above chart, it took Bitcoin some time to bottom out after its monthly stochastic RSI hit zero in the past two cycles.
In 2014, Bitcoin’s monthly stochastic RSI hit zero in April but its price bottomed nine months later (January 2015) after dropping 65% from the April price. And a new bull market started after the monthly stochastic RSI closed above 20 in October 2015.
In 2018, the stochastic RSI hit zero in October and this time it took Bitcoin two months to bottom out after dropping 50% from the October price.
Whether the Bitcoin price will bottom in line with the stochastic RSI this time remains to be seen.
- Miner wallet balance is dropping
In terms of Bitcoin’s on-chain activity, the Bitcoin balance in miner wallets topped out in late March, recording a lower high figure compared to the 2017 and January 2021 highs at around 1.84 million bitcoins (see the chart below). This suggests that miners are currently selling from their Bitcoin rewards, which increases the Bitcoin supply in circulation and puts pressure on the price.
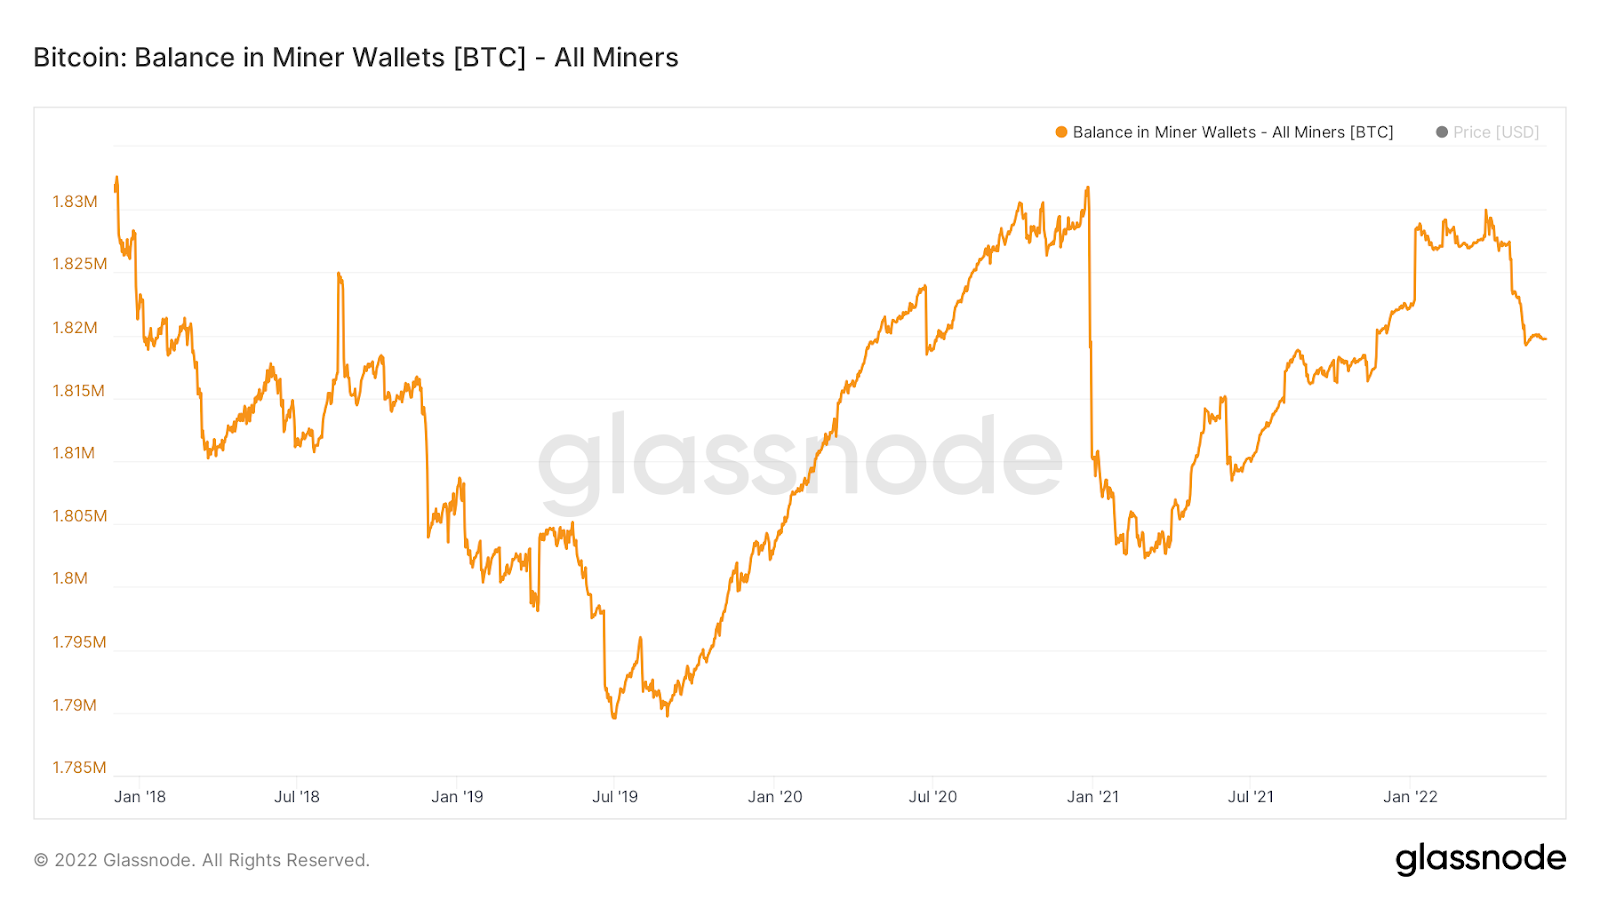
Source: Glassnode
If the added supply is not removed from circulation with the miner wallets’ balance making a new high, miner capitulation could soon follow which has preceded Bitcoin’s cycle bottoms in the past.
- Long-term holder profitability
The largest portion of Bitcoin’s supply is kept by its long-term investors, thus the historical profitability of Bitcoin holders is a critical factor in understanding market tops and bottoms.
As you can observe in the below chart, the profitability of long-term holders becomes one in every bull market, which means that none of their Bitcoin positions are in a loss. As you can also see in the chart, hitting one in long-term holder profitability is by no means an immediate sell signal because prices can go higher for over a year and keep the long-term profitability hovering at one.
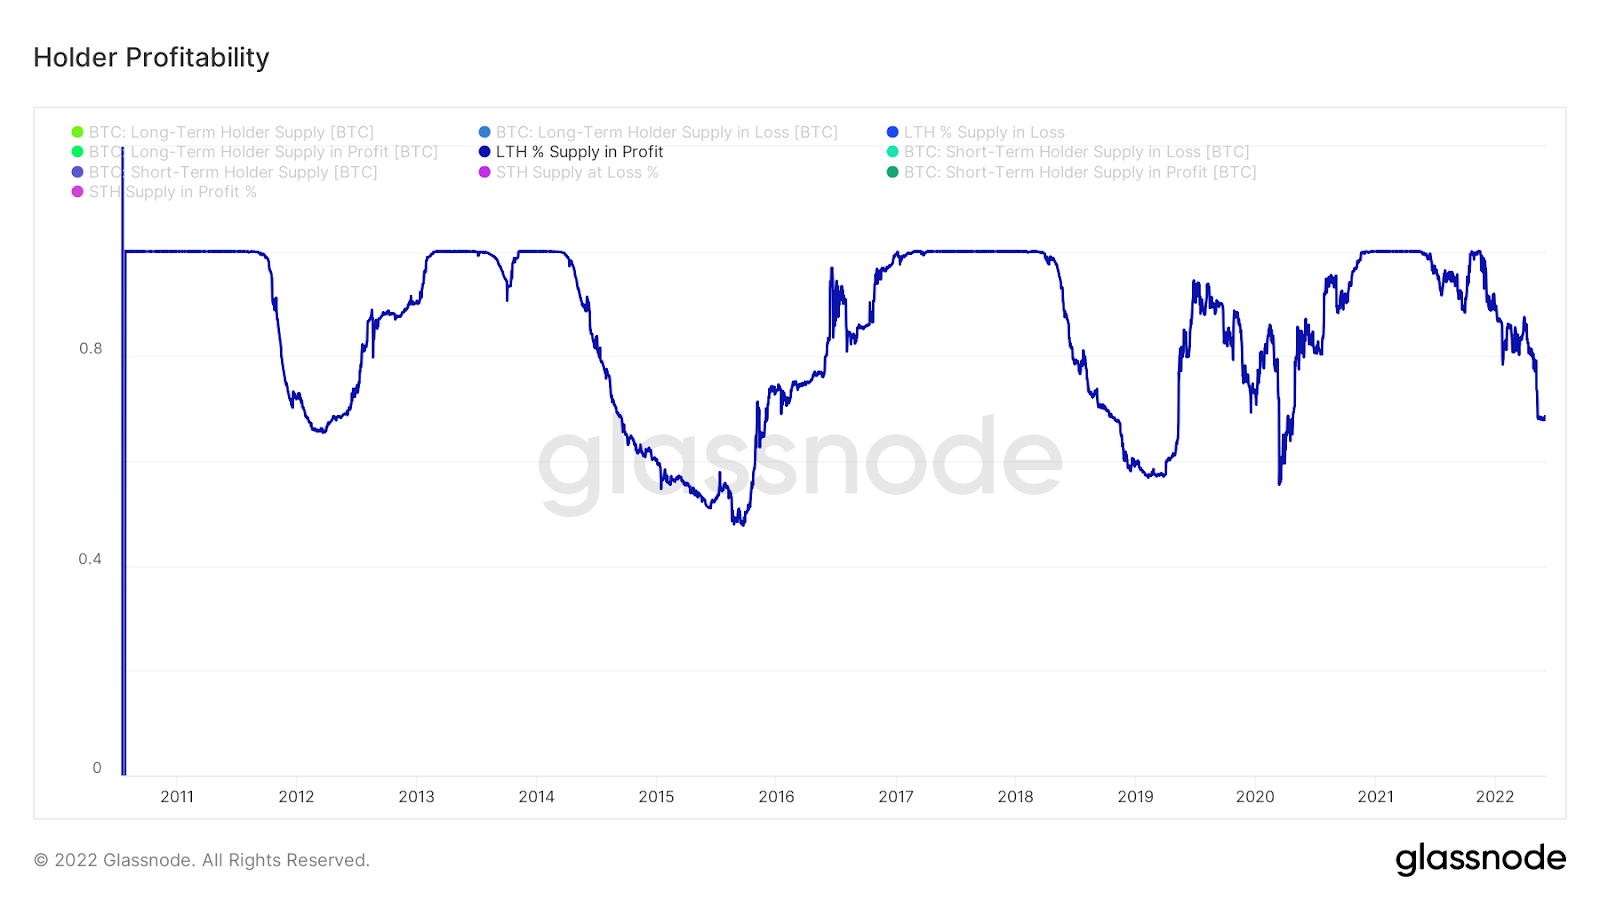
Chart for the Bitcoin long-term holder profitability. Source: Glassnode
On the downside, profitability dropped to as low as 50% during market downturns. Statistically speaking, dropping below 0.6 is a sign of a market bottom. The value is currently at 0.68.
Ethereum’s descending triangle
Ethereum is moving inside a descending triangle in terms of the U.S. Dollar trading pair:
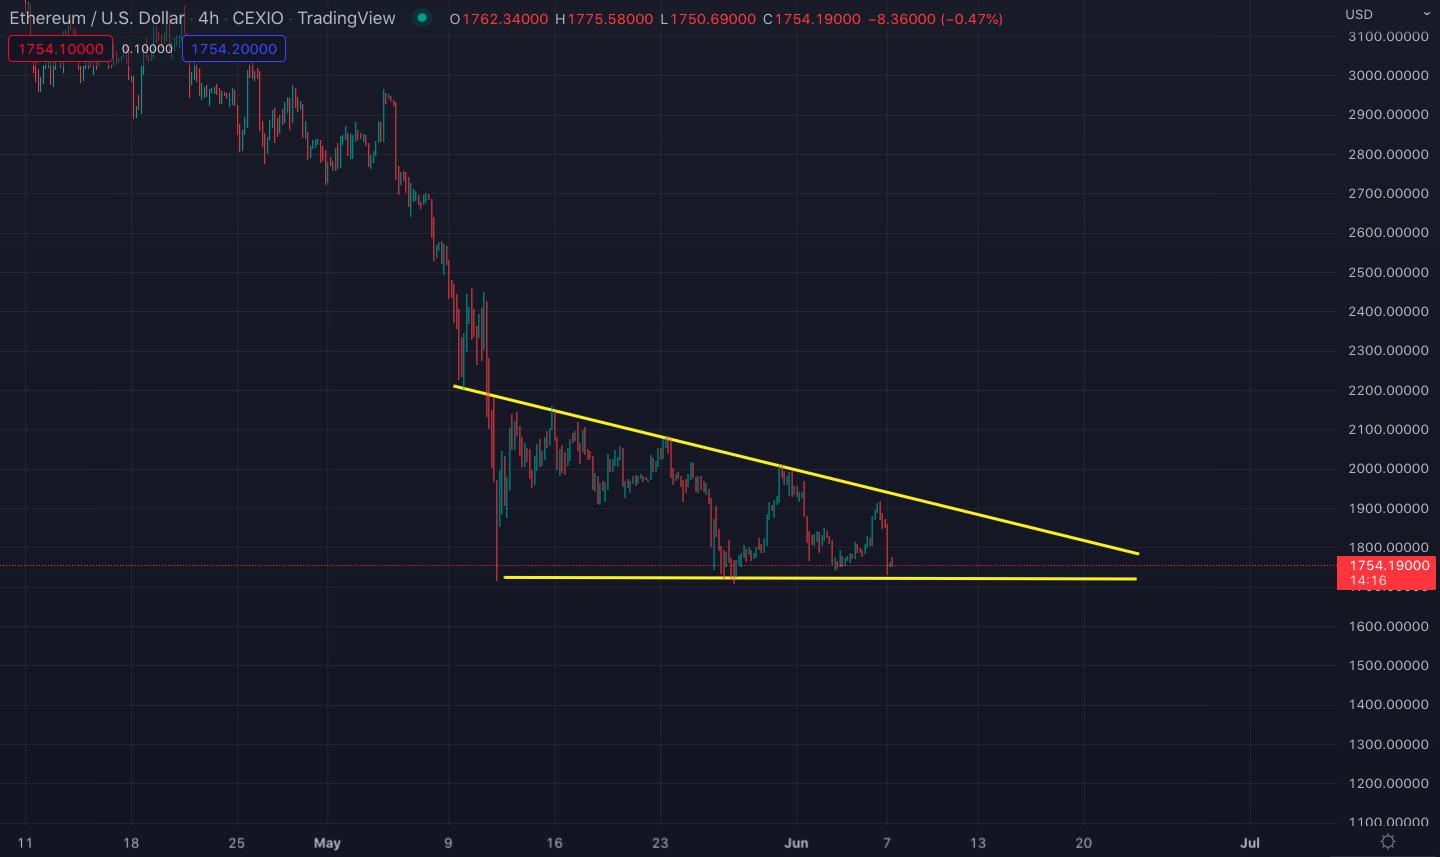
Ethereum/U.S. Dollar price chart with the descending triangle
When a descending triangle breaks down, the price usually drops by the triangle’s vertical length. So if Ethereum’s triangle breaks down due to a drop in the Bitcoin price, a target estimate would be at around $1,265 per ETH.
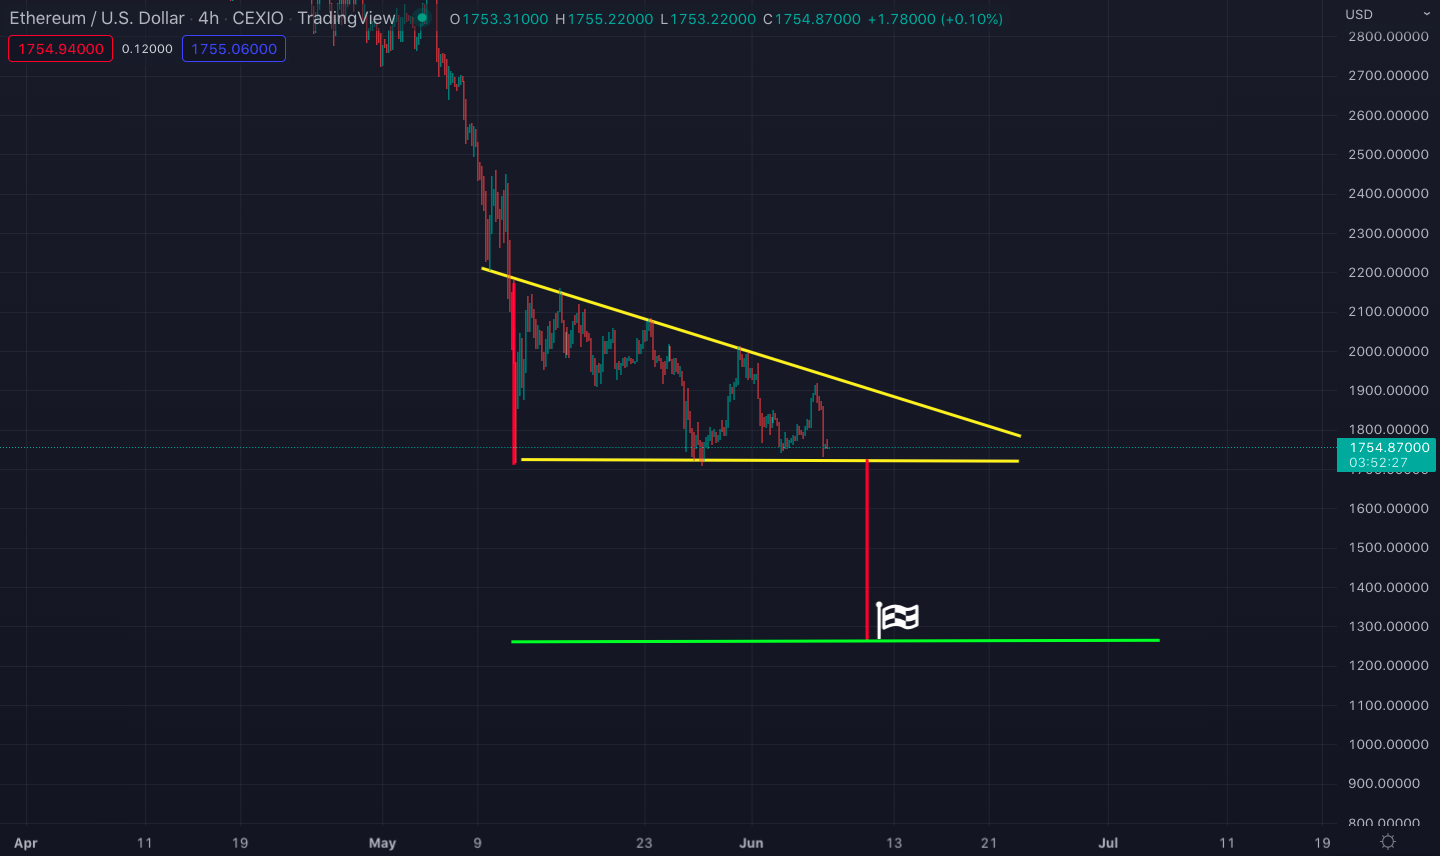
Ethereum/U.S. Dollar price target if the descending triangle breaks down
What is critical with Ethereum’s descending triangle is that if you open the price chart of many altcoins, including the majors, you will see a similarly bearish triangle formation (see the samples below). Considering that, Ethereum’s breaking down from its triangle could create a domino effect across the altcoin market.
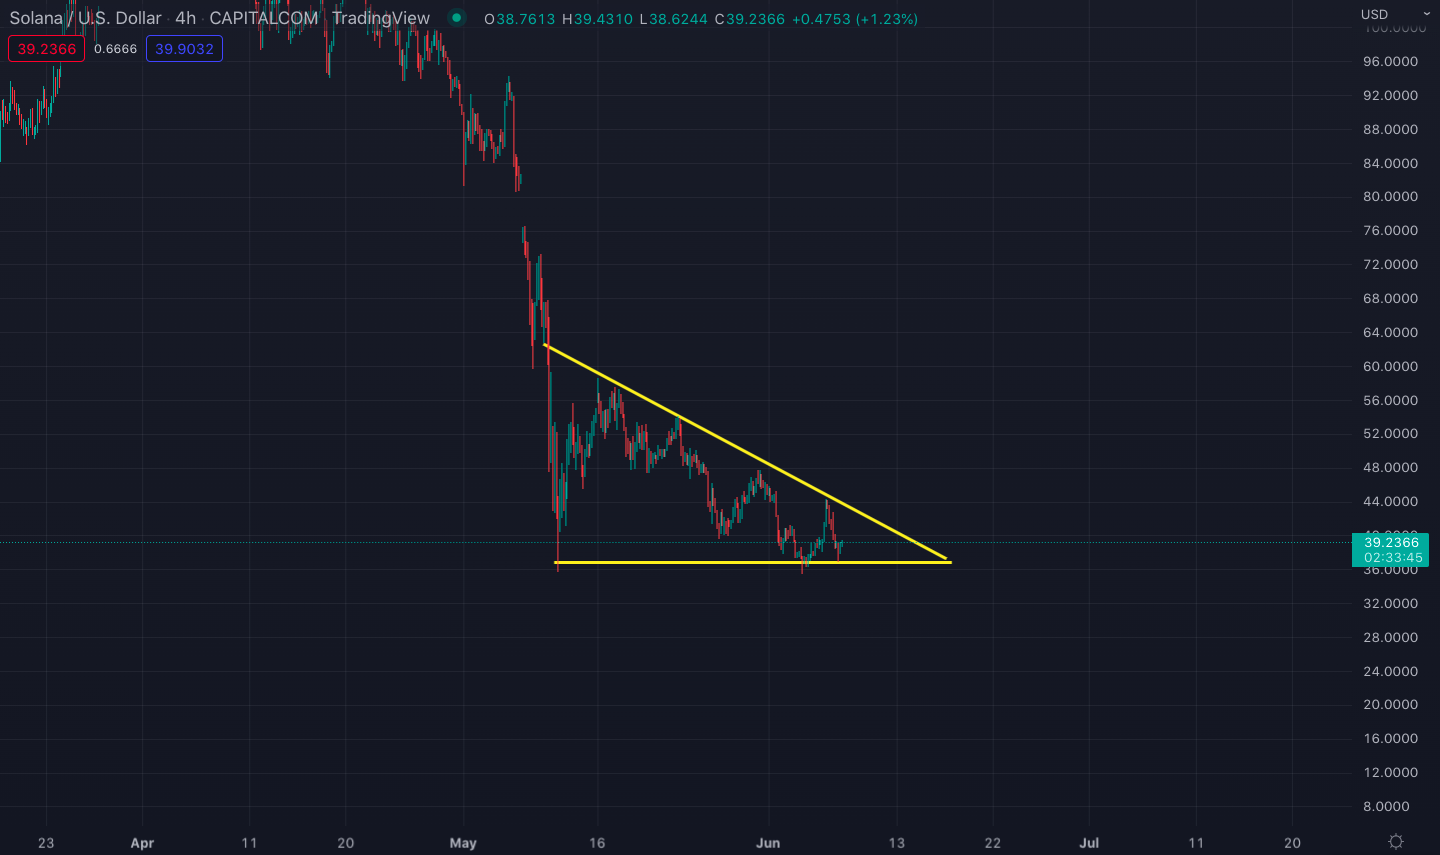
Solana (SOL) price chart
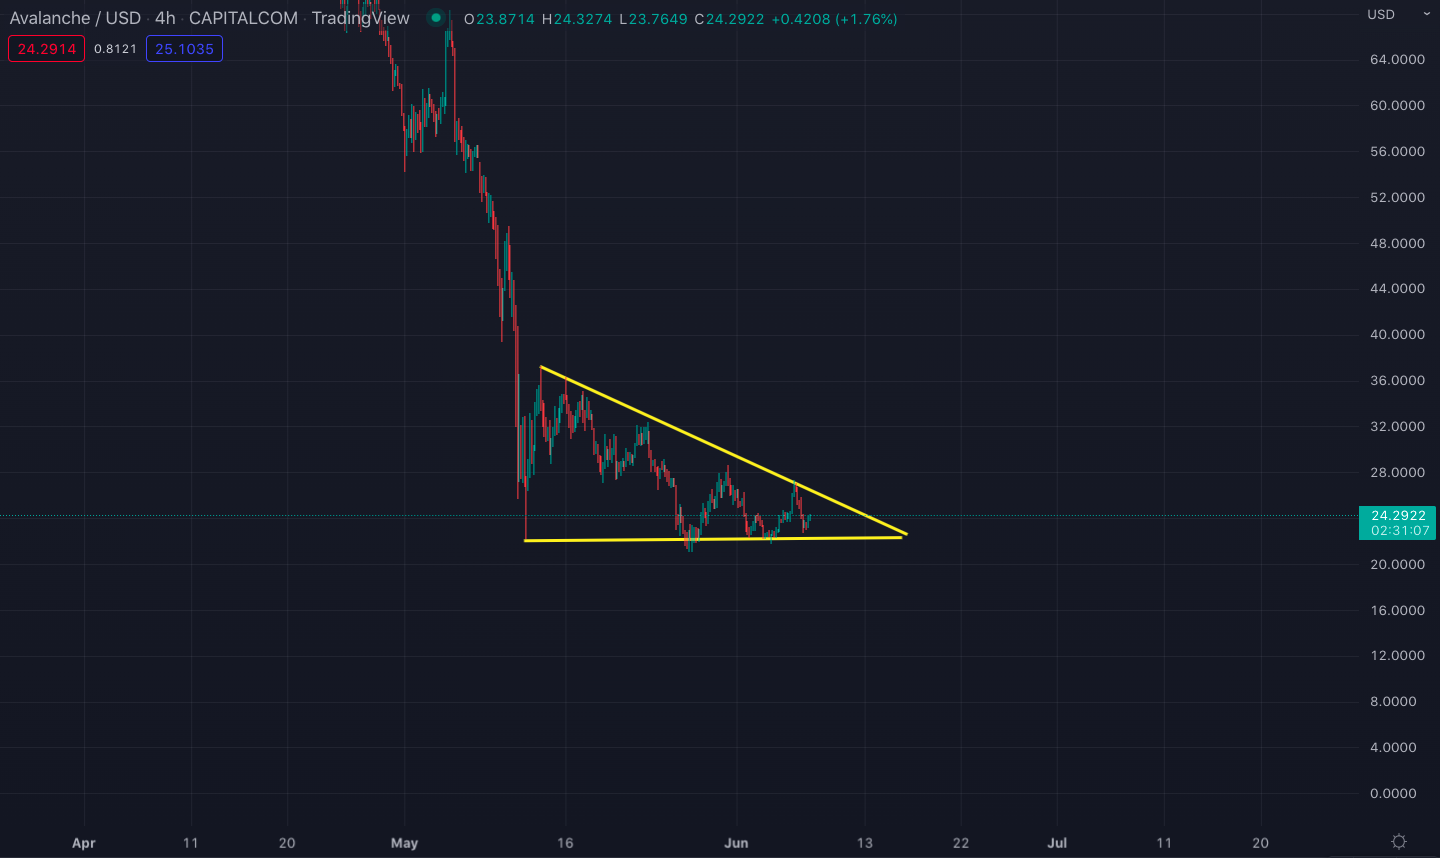
Avalanche (AVAX) price chart
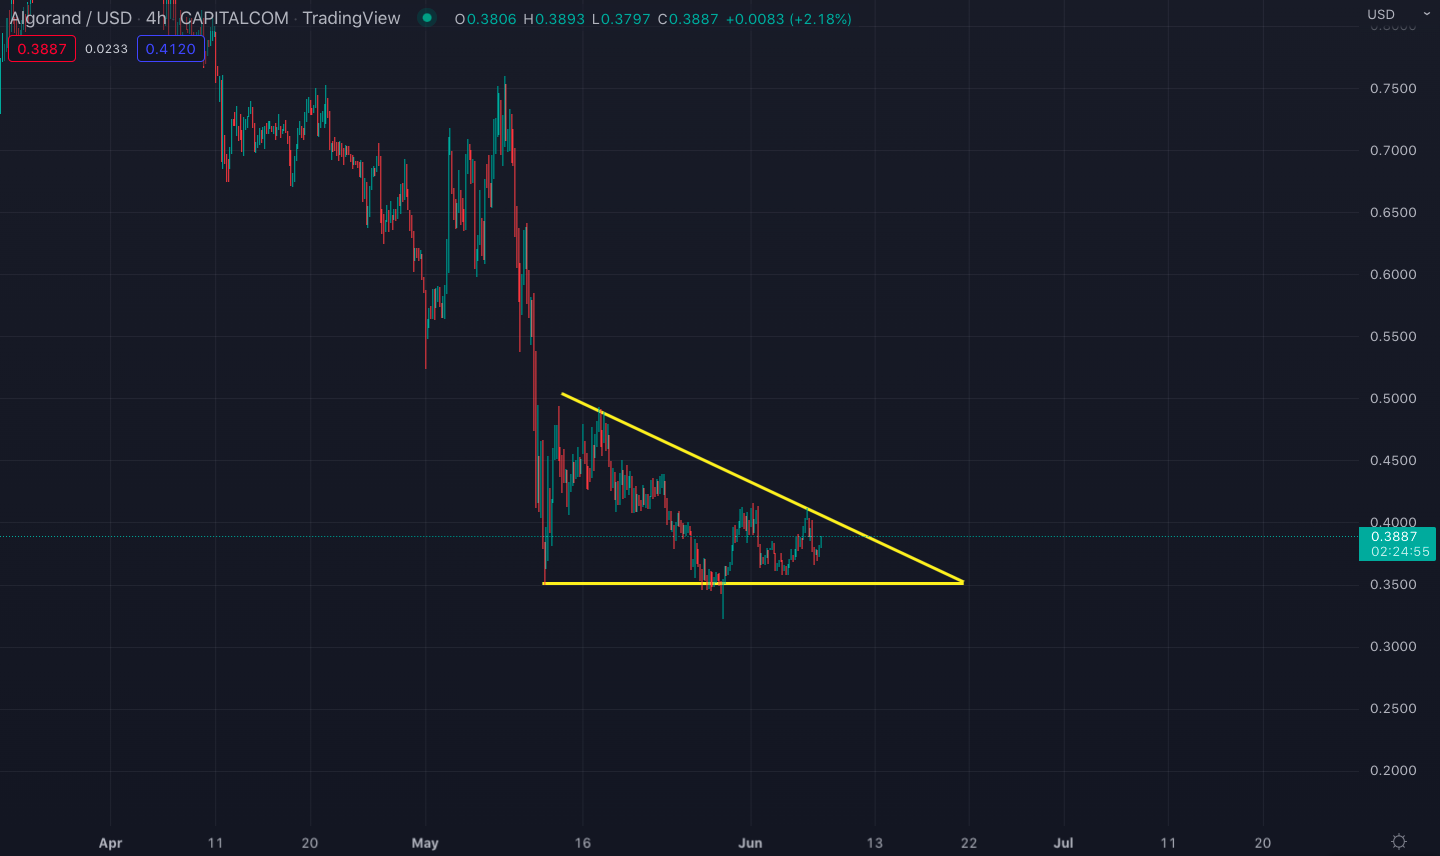
Algorand (ALGO) price chart
Will Ethereum be dumped following the Merge?
According to Glassnode, the amount of ETH staked on Ethereum’s new Beacon Chain has reached an all-time high level at 12.8 million. This corresponds to about 11% of Ethereum’s total circulating supply.

Some industry analysts are concerned about the possibility of many of the staked ETH being sold to markets once the highly anticipated Ethereum Merge takes place in August. This point of view relies on the belief that the Merge event has already been priced during last November’s market top and that the current excitement regarding Ethereum’s moving to a proof of stake blockchain would likely end with a typical whale-to-retail sell-off.
Although the total value of the staked ETH tokens is currently at around $23 billion, investors will not be able to release all their holdings immediately after the Merge. The staked tokens can be released in tranches so they will trickle back into markets rather than flood them.
Currently, Ethereum’s price action is almost entirely coupled with that of Bitcoin as a consequence of the declining risk appetite in the market so Bitcoin’s moves during the next few months will likely dictate the direction of Ethereum.
Japan passes stablecoin bill
In the aftermath of Terra’s collapse, Japan’s parliament passed a bill on June 1 to regulate the issuance of stablecoins. The new law mandates stablecoins to be linked to the Japanese Yen or another legal tender and guarantees holders the right to redeem them at face value.
This means that only licensed banks, registered money transfer agents, and trust companies will be allowed to issue stablecoins in Japan. On the other hand, the bill does not mention anything about the use of existing stablecoins like Tether and USD Coin.
Pundits believe that the legal action taken by the world’s third-largest economy can likely become a benchmark to adopt by other governments around the world.