
The cryptocurrency industry is now entering its eighth month of what most traders would call a bear market. With twelve straight weeks of downward pressure, many spectators and analysts are eagerly looking for any sign of relief and possibly even the beginning of a reversal trend. This downward move began in early April at $47,000, and we have seen little to no interest from bulls since.
In recent weeks, the $29,000 – $30,000 zone has been a major support level. For a moment it looked as though bulls had finally regained some semblance of control after regrouping here. However, the price broke through to the downside this past weekend with a swift downward move and what followed are lows unseen since December of 2020.
As the exuberant market action continues, it is easy to overlook the stream of news that has been materializing. A major cryptocurrency bill is in the works in the US, Ethereum (ETH) is rolling out its proof of stake (PoS) update, and miners are looking for a new headquarters in the US. More on that later, for now, let’s review the latest Bitcoin and Ethereum analysis.
BITCOIN ANALYSIS
Price Overview
- Last 7-day change: -28.28%
- 7-day low: $21,910.26
- 7-day high: $31,737.31
- Last 30-day change: -25.11%
- 30-day low: $21,910.26
- 30-day high: $32,375.81
Network Overview
- Blocks Mined (7-day): 1,047 blocks
- Average Block Interval (7-day): 584.48 seconds
- Coins Discovered (7-day): 6,543.75 BTC
- TX Count (7-day): 1.766 million
- TX Volume (7-day): 20.955 million BTC
- Net Change in Exchange Balance (7-day): + 5,269 BTC
On-Chain Activity:
- Cost Basis
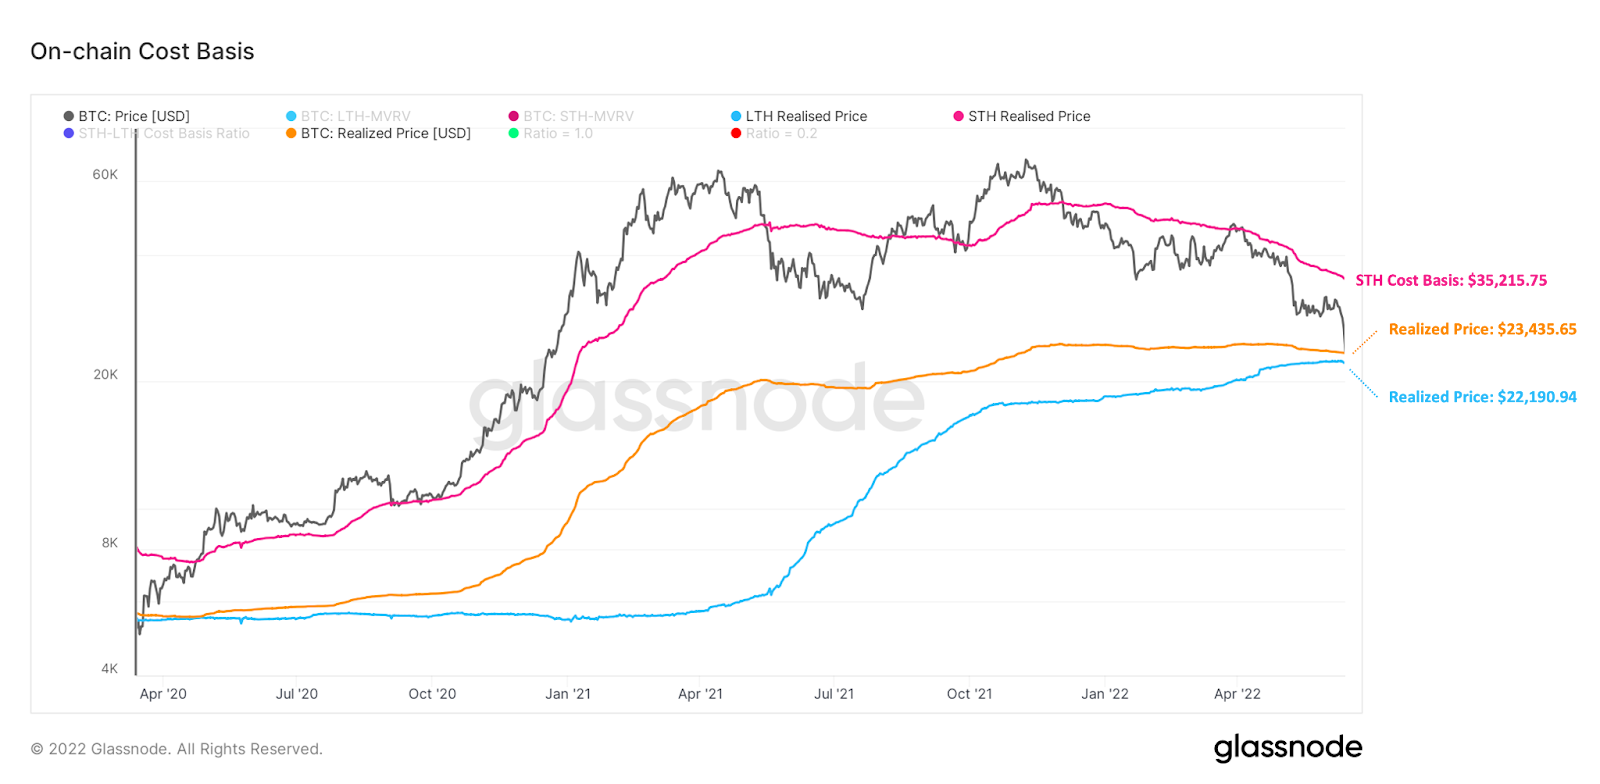
Bitcoin has been trending between the short-term holder (STH) cost basis and realized price (BTC value determined by UTXO creation, or when coins were last moved on-chain) since the start of 2022. The most recent downturn puts the market price of BTC within close reach of the long-term holder (LTH) cost basis and realized price.
They stand at about $22,200 and about $23,400 respectively as of June 12. This would be the first time price has moved below these levels since the COVID-induced black swan in March 2020.
Source: Glassnode
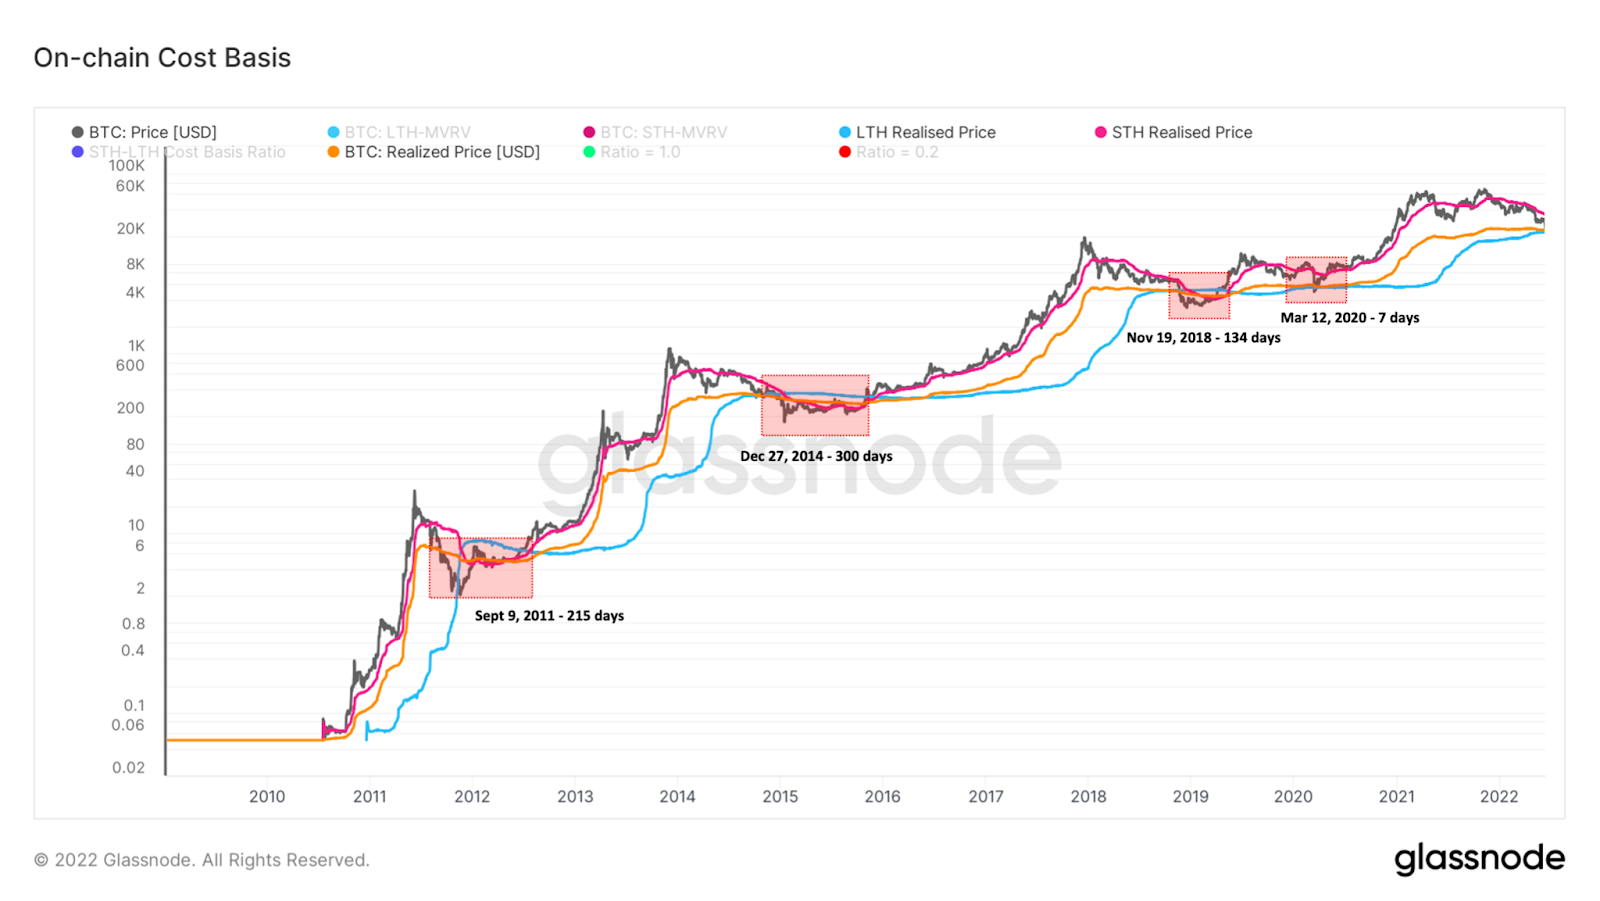
Bitcoin has traded below realized price and the long-term holder cost basis four times throughout its history. The chart below highlights each time this occurred. BTC stayed below these key levels for 164 days on average after breaking below the realized price. Cumulatively, BTC has spent less than 14% of its life below these levels.
Source: Glassnode
- Futures
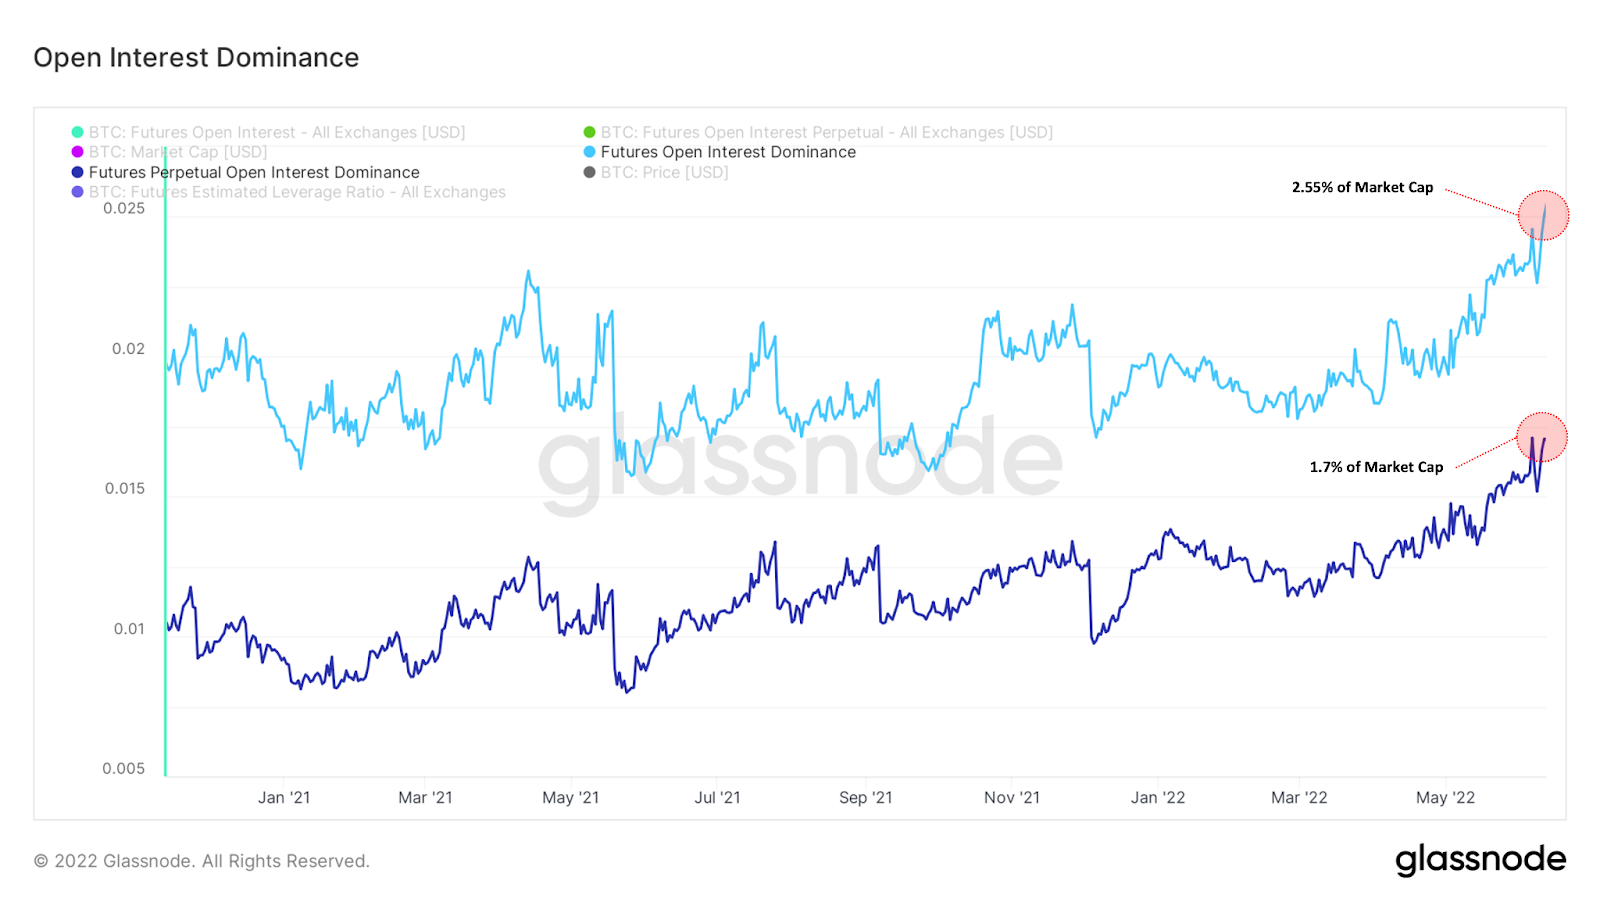
Futures open interest dominance has climbed to 16-month highs as Bitcoin’s market cap has contracted. This means there is an elevated allocation of capital to futures relative to the total value of bitcoin (the asset). Open interest dominance is important to monitor, especially as BTC trades around key levels because futures are vulnerable to liquidations.
In some cases, liquidations result in the forced selling of BTC. Heightened amounts of open interest relative to the cumulative value of BTC means these liquidations can have an outsized impact on price.
Source: Glassnode
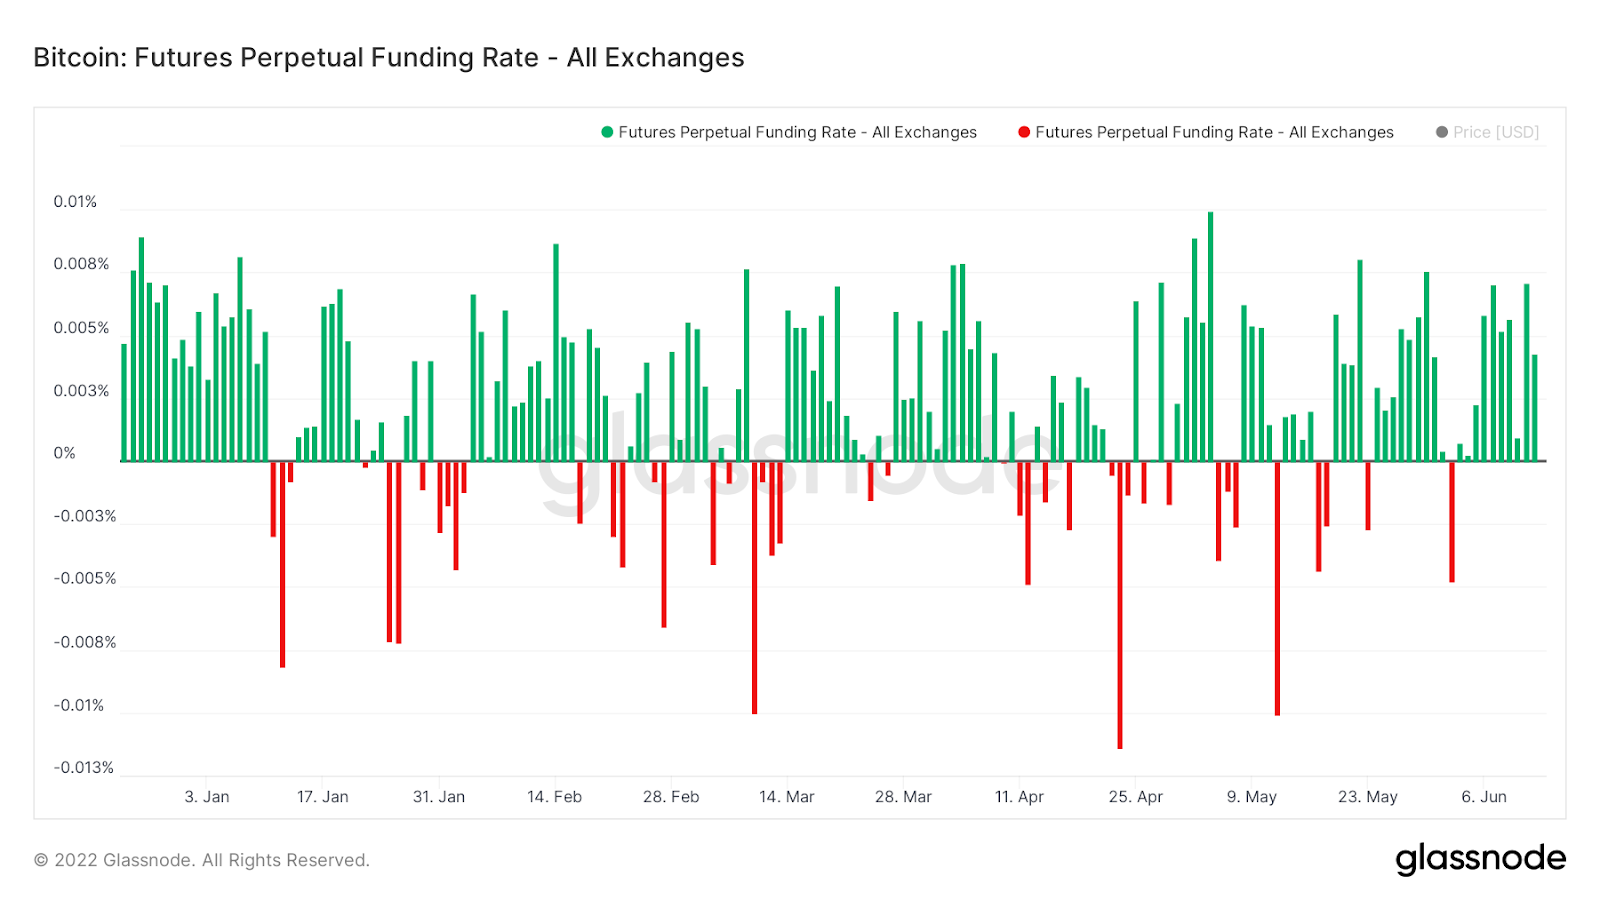
The futures perpetual funding rate offers more insight into which direction liquidations are more likely to move the market. A long-leaning market (indicated by a positive funding rate) is more susceptible to liquidations that suppress price, and a short-leaning market (indicated by a negative funding rate) is more susceptible to liquidations that pushes the price upward. As it currently stands, the market is leaning long with a positive .004% funding rate.
Source: Glassnode
The futures leverage ratio helps in understanding futures sensitivity to liquidations. There is a direct relationship between the amount of leverage and sensitivity to liquidation. Bitcoin’s futures leverage ratio is sitting at 14-month highs as speculators have been increasingly levering up over the past two months.
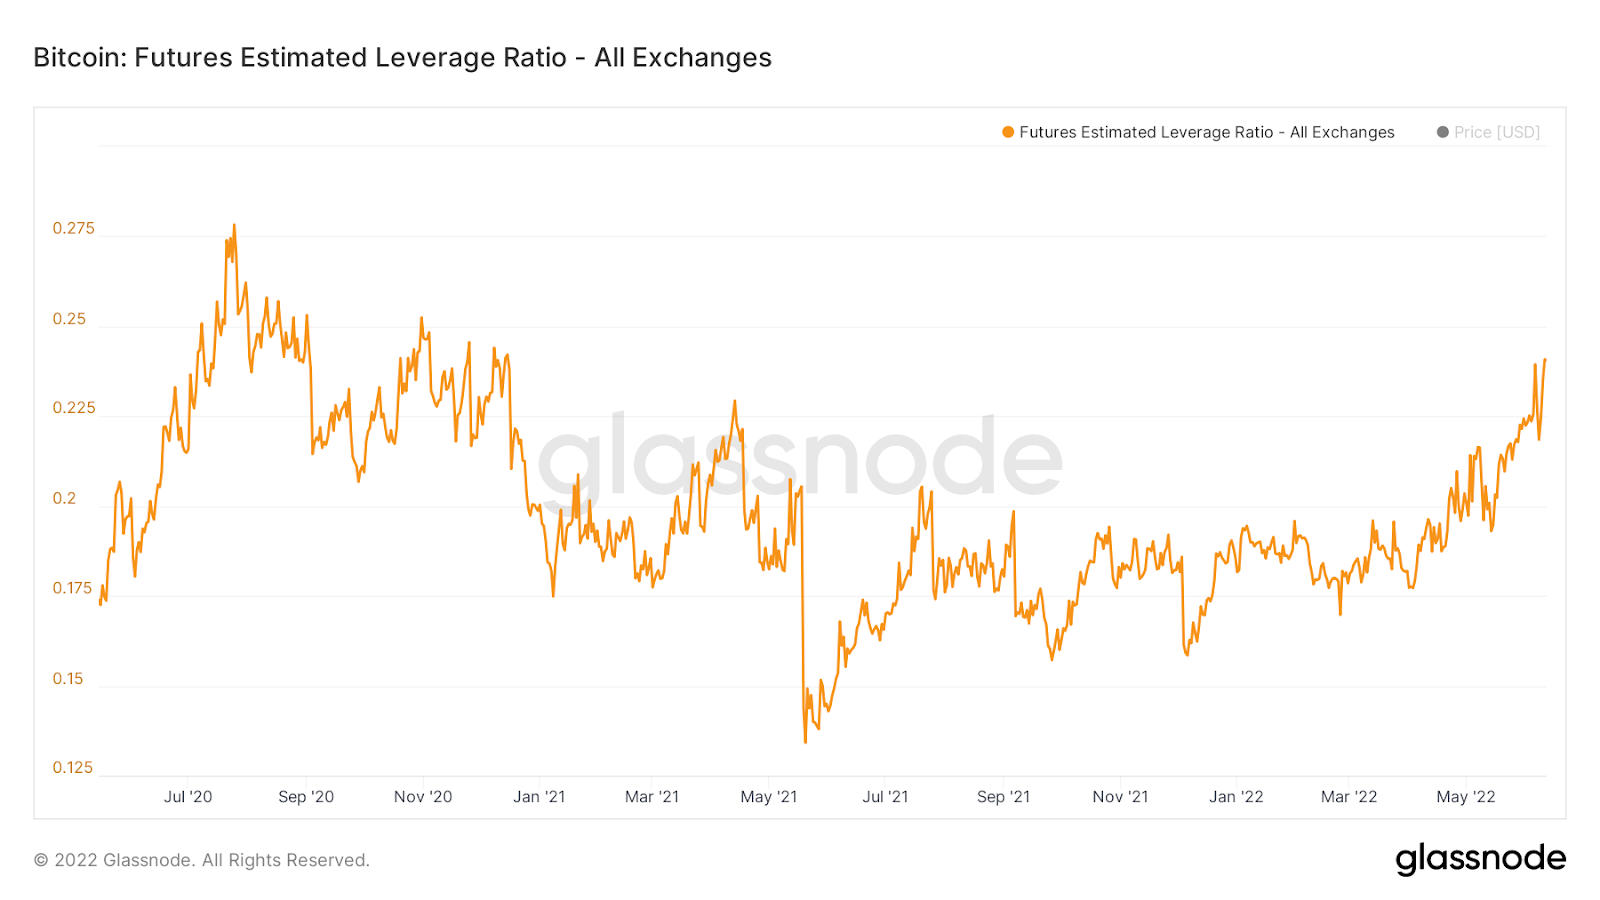
Source: Glassnode
- Hash
Despite the negative price action, hash continues to make all-time highs. Peaking at 270 exahashes on June 8, the seven-day simple moving average currently stands at 228 exahashes. The recent negative trends in BTC price puts stress on miners’ margins, which can result in capitulation if persistent enough. While there aren’t any immediate signs of this in the hash rate itself just yet, there are signs alluding to the possibility of such an event in other mining metrics.
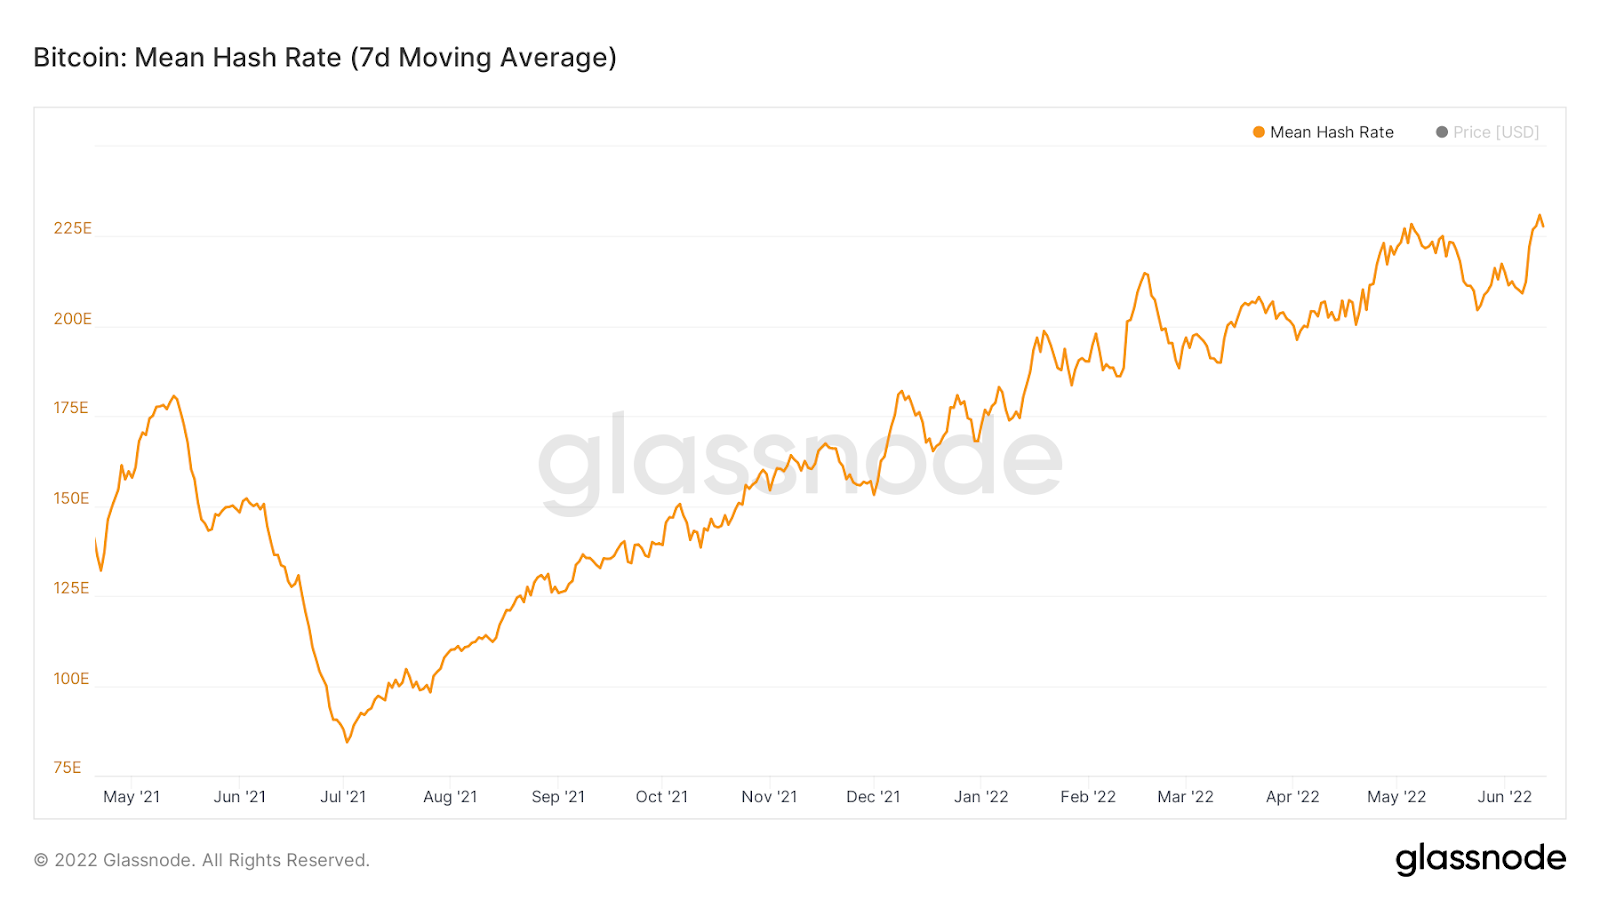
Source: Glassnode
Hash price is one area suggesting miners are under pressure. The hash price index tracks the value miners can expect to capture for each terahash of power they control daily. For example, a miner owning 100 terahashes at a hash price of $1 can expect $100 in a day. Hash price is down more than 50% since April and is down some 75% from the highs of October 2021. This indicates miners are earning less for their effort which can force weaker ones to vacate the network.
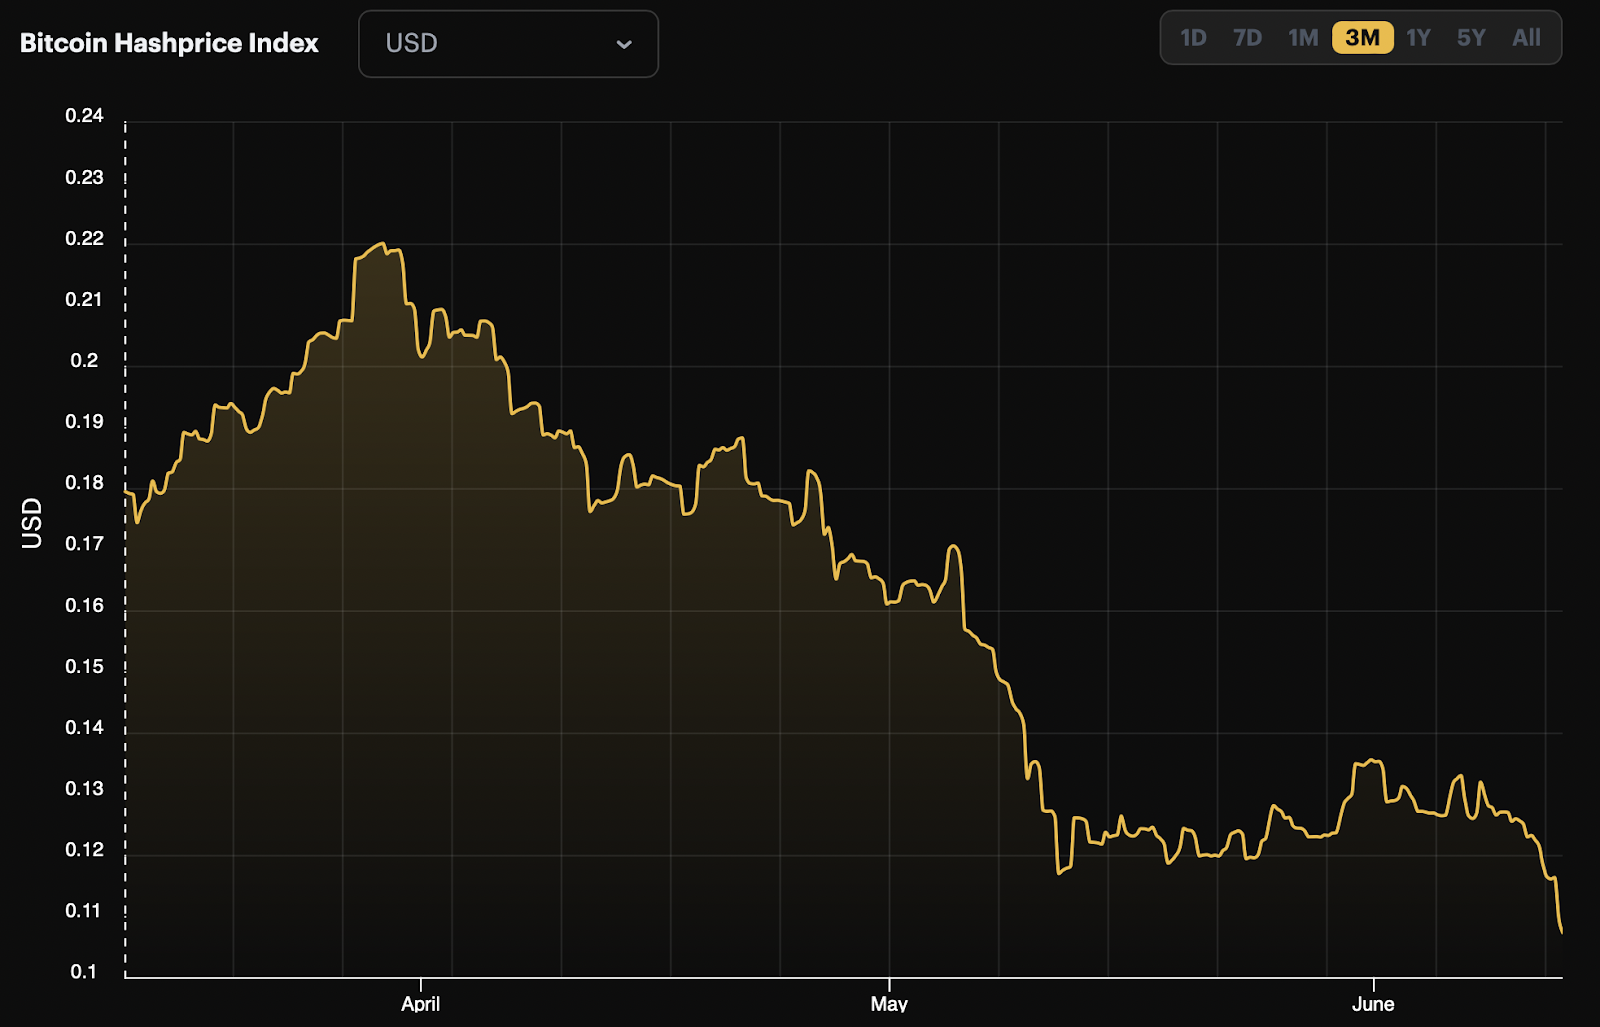
Source: Hash Rate Index
Bitcoin Technical Analysis:
Bitcoin (BTC) currently sits in a very uncertain range. Market spectators have grown agitated by the consistent downward pressure over the last several months and while a relief bounce has been heavily anticipated, it appears as though prospective bulls may have to wait longer.
The $29,000-$30,000 area was very strong for one month, rejecting numerous attempts to breach to the downside. This gradually brought in more traders that were looking for an upside move. With the BTC price approaching $32,000, it felt as though further upside was imminent but a sharp downward move on June 7 negated any optimistic feelings. Let’s review some of the most illuminating indicators for Bitcoin and get a picture of where the asset could be headed.
- Major Trendlines
The $32,000 range acted as a major support level the two previous times it was tested in early and mid-2021. This was expected to hold again and initiate a sideways trend as BTC gathered support and momentum. Instead, there was a clear breakthrough with the past two weeks demonstrating with long candle wicks that this former support level is now a resistance ceiling.
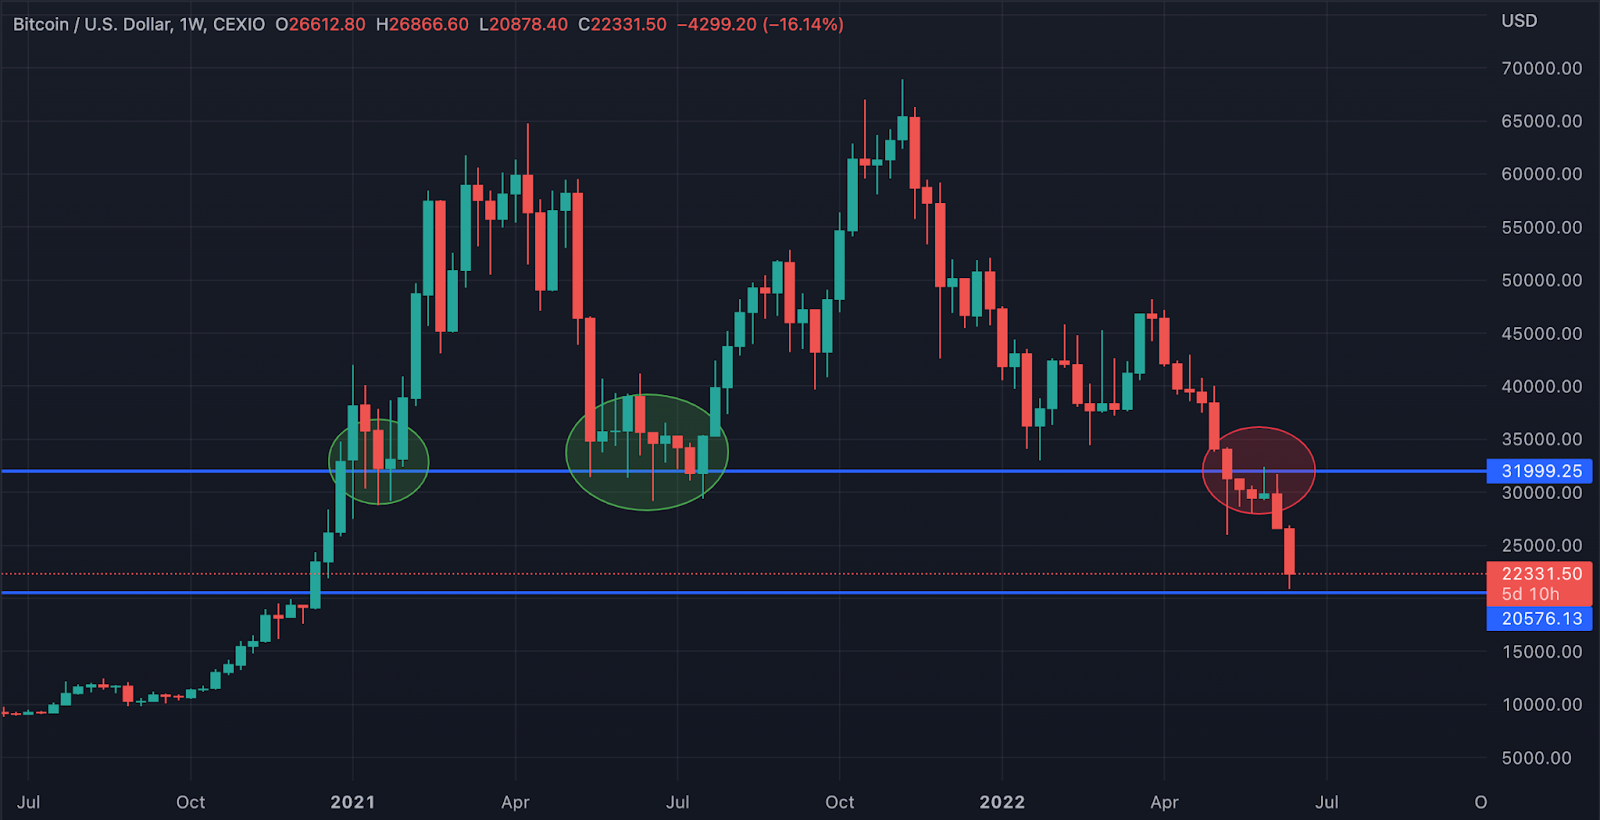
The former $32,000 support trendline, now acting as a resistance level.
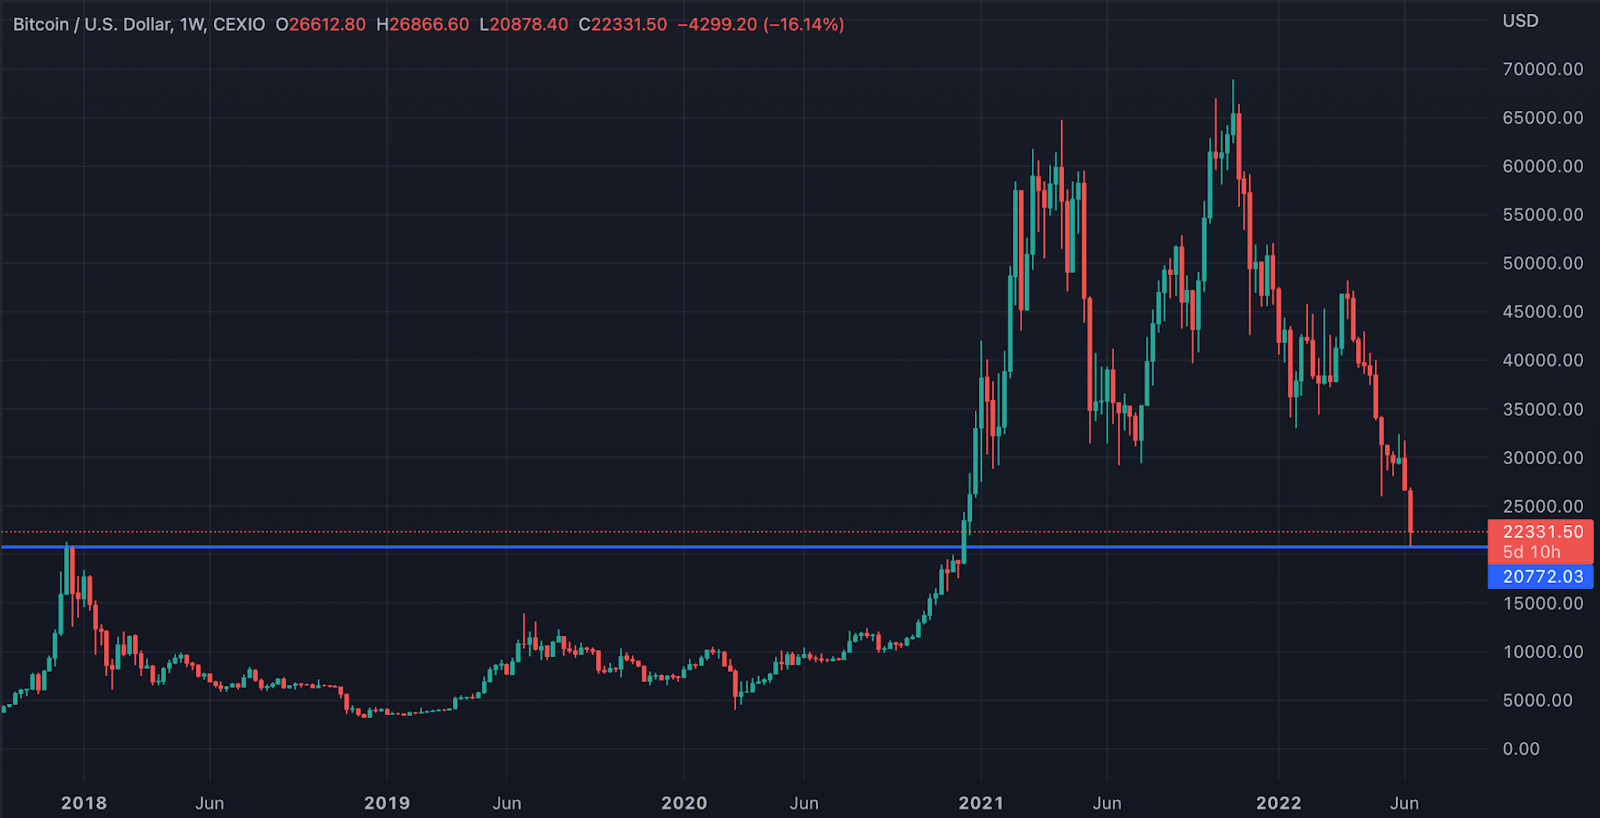
The historic $20,000 trendline could be the next logical support level.
With this recent price action in mind, the next major support level should be around $20,000, the monumental area that marked the end of the 2017 bull run. If we refer back to December 2020, we can see that there was a massive volume spike bringing BTC from around $20,000 to $42,000 in one clean motion. While this was an exciting time in the space, it unfortunately left no clear support areas for BTC to regroup meaning that there is the potential for BTC to return to $20,000 support in the current picture.
- 200-Week Moving Average (MA)
With Bitcoin now entering its eighth month of the so-called “bear market” and being around 62% down from its all time high, many market spectators are now looking to where the possible “bottom” could be. One metric that could potentially provide insight is the 200-week MA. When we refer back to historical data, this MA played a clear role in determining the past market bottoms after periods of decline.
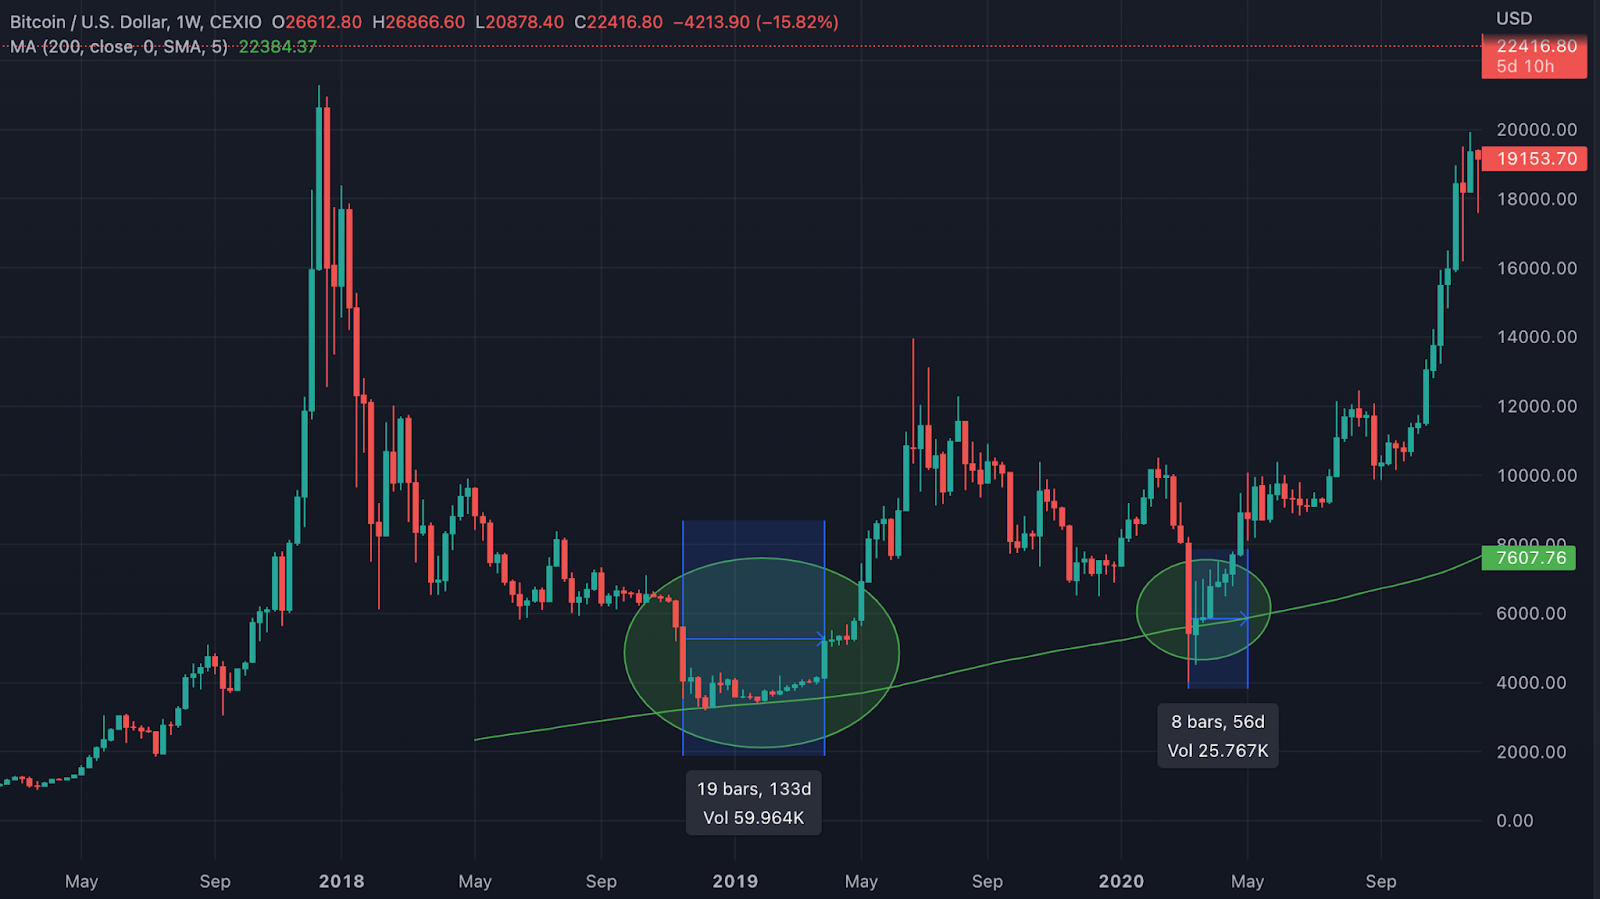
Bitcoin has been supported by the 200-week moving average twice in its history.
Following the excitement of 2017 was the relentless grind to the bottom that we experienced throughout 2018. After finally plummeting through the $6,300 support level in November of 2018, Bitcoin finally found its footing again on the 200-week MA. Here, it underwent an accumulation period for around 130 days before finally gaining enough momentum to begin a breakout move. Later in March of 2020, BTC again found the support of bidders around the 200-week MA.
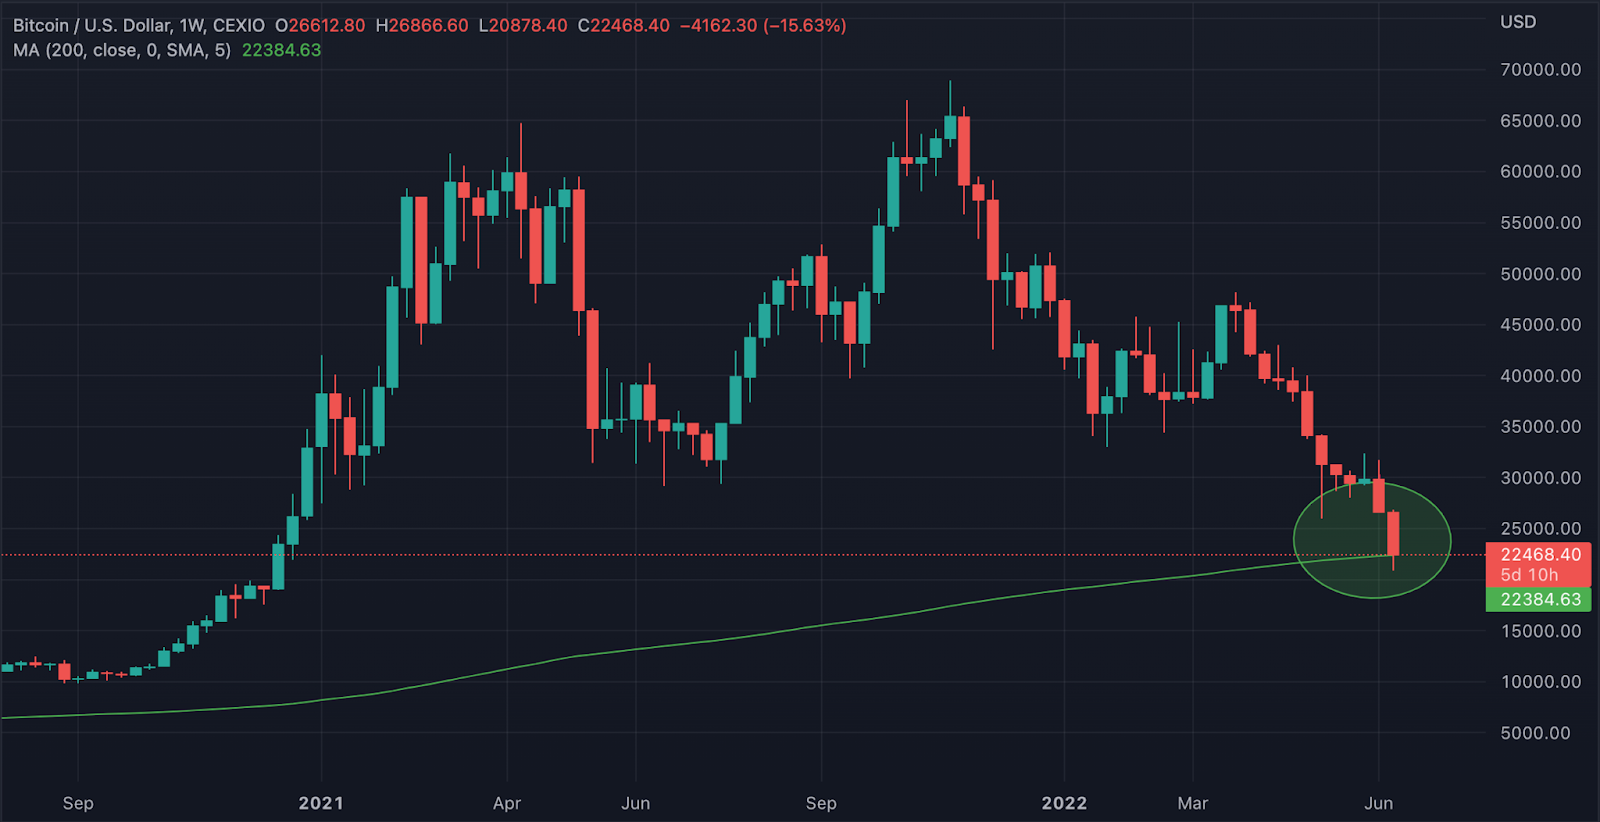
Bitcoin has approached the 200-week MA again.
Now, traders will be looking at this MA yet again. Could this potentially be the decisive market bottom? Or could a breakdown under this MA signify another long chapter of this bear market ahead? If history is to be repeated, we could potentially experience another long accumulation period if this MA holds for BTC.
- MACD
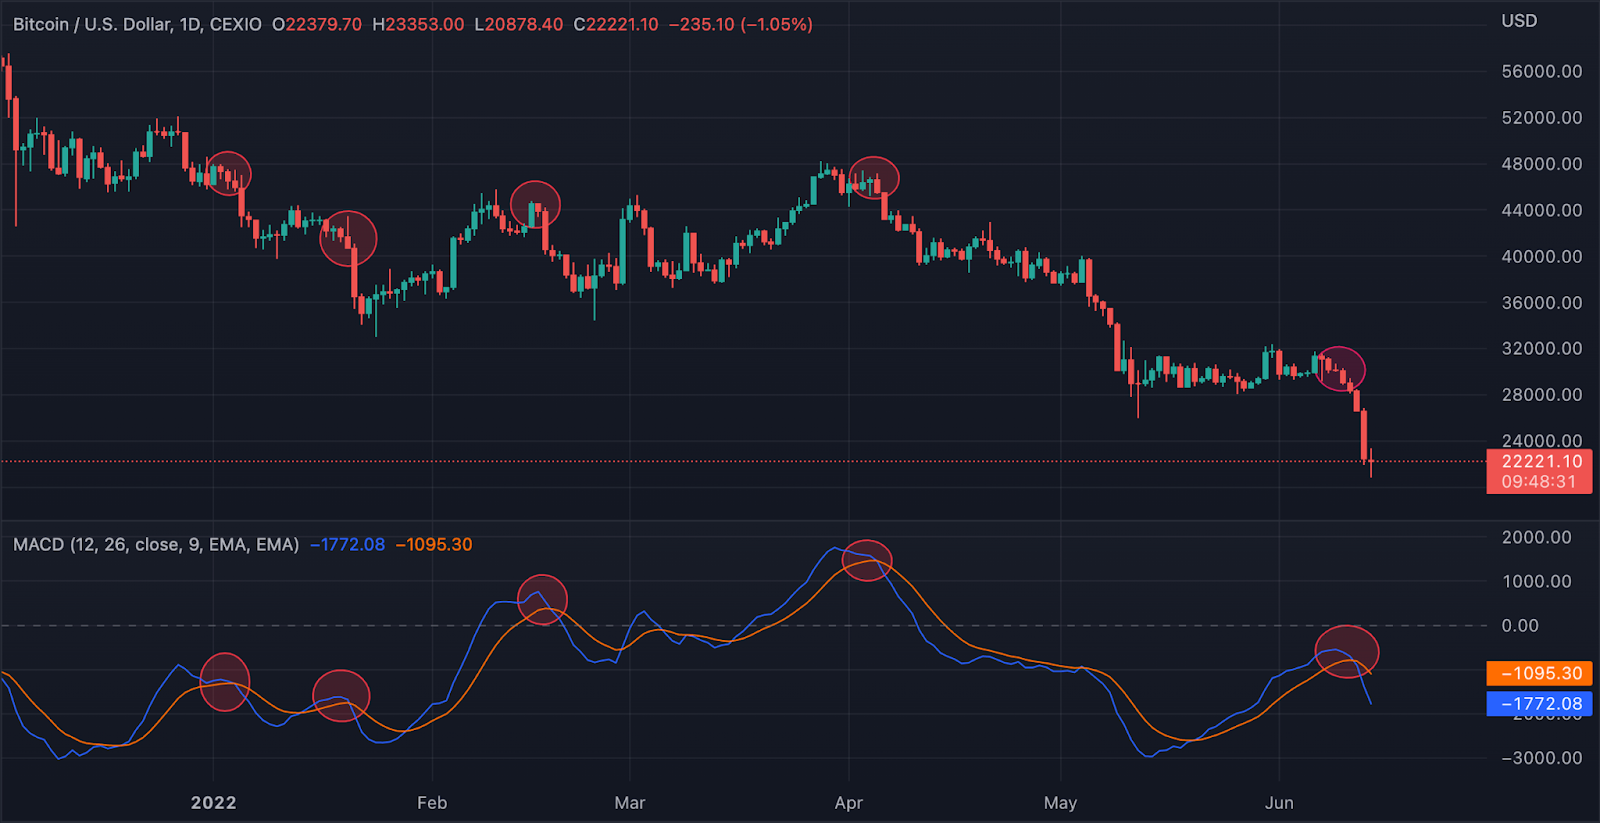
Five recent instances of substantial bearish moves after an MACD crossover.
On the daily chart, the MACD has proven to be a consistent technical analysis tool. Over the past six months, we have seen multiple instances of MACD crossovers inspiring large bearish moves to the downside. This could be a useful tool to utilize in the future.
ETHEREUM ANALYSIS
Price Overview
- Last 7-day change: -33.77%
- 7-day low: $1,163.61
- 7-day high: $1,872.82
- Last 30-day change: -41.46%
- 30-day low: $1,163.61
- 30-day high: $2,164.47
Network Overview
- ETH Burned (7-day): 39,542 ETH
- TX Count (7-day): 7.033 million
- TX Volume (7-day): 21.037 million ETH
- ETH Moved in/out of Smart Contracts (7-day): ETH
- Net Change in Exchange Balance (7-day):+ 501,974 ETH
Ethereum Technical Analysis:
Being the largest and most prominent of the “altcoins,” the status of the Ethereum (ETH) market holds substantial weight for the rest of the cryptocurrency market. While BTC is still above its 2018 height, ETH sits well below its similar marker of around $1500. At the time of this writing, ETH is currently $1,200.
At the current moment, ETH is moving in tandem with BTC and the entire market is following suit. Whether we have seen the worst of this aggressive selling is yet to be seen, but many indicators are potentially signaling that this could be the case. Both the RSI and Stochastic are in oversold territory, and ETH is resting on historically significant MAs.
In other news, Ethereum has completed the successful trial of the planned proof of stake (PoS) merge. This could bode well for the ETH price in the near future and may be a bullish catalyst in the coming weeks.
- Important Moving Averages
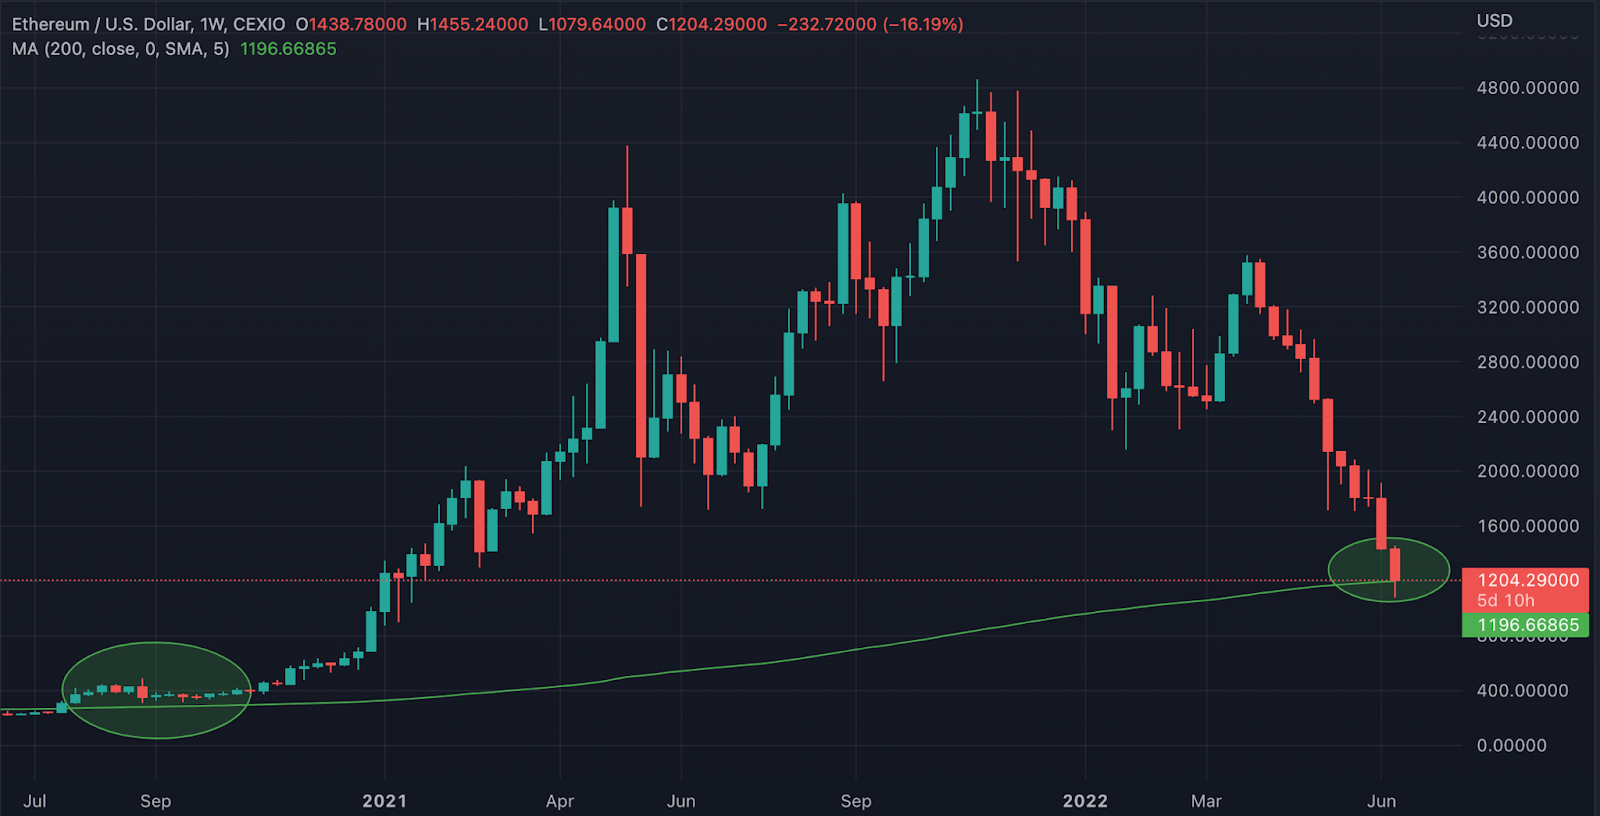
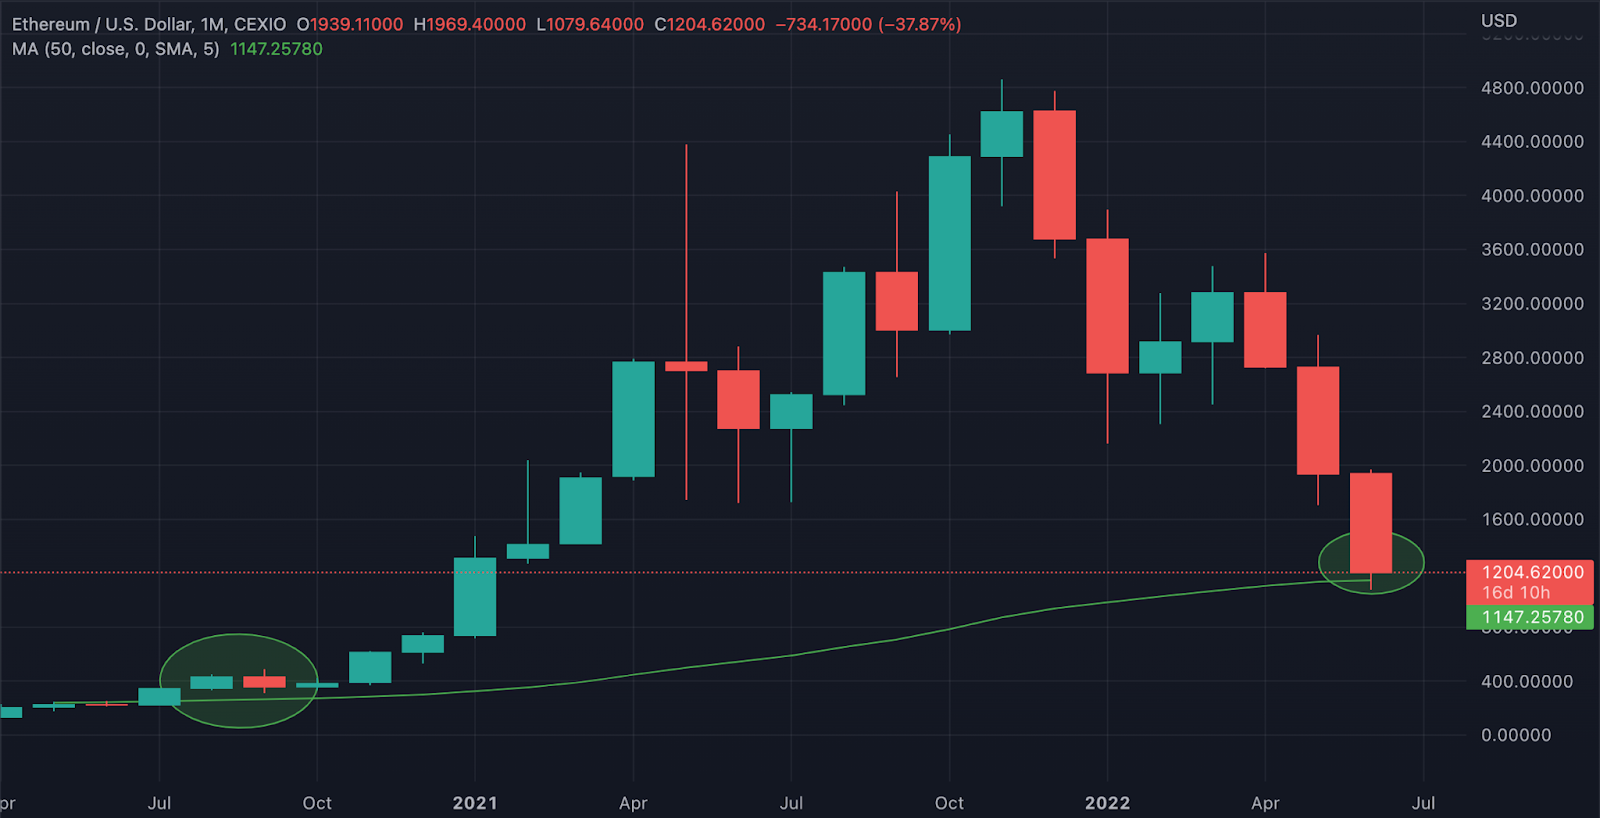
Above: ETH resting on the 200-week MA, Below: ETH resting on the 50-month MA
Much like BTC, ETH is also nearing critical MAs. The recent price action has brought ETH directly to the 200-week and 50-month MAs where, referring back to September of 2020, we witnessed the asset find support. It will be natural for traders to imagine some sort of either accumulation or immediate bounce off these MAs, though any breakthrough to the downside could potentially bring catastrophic price action.
- Oversold RSI on the Weekly
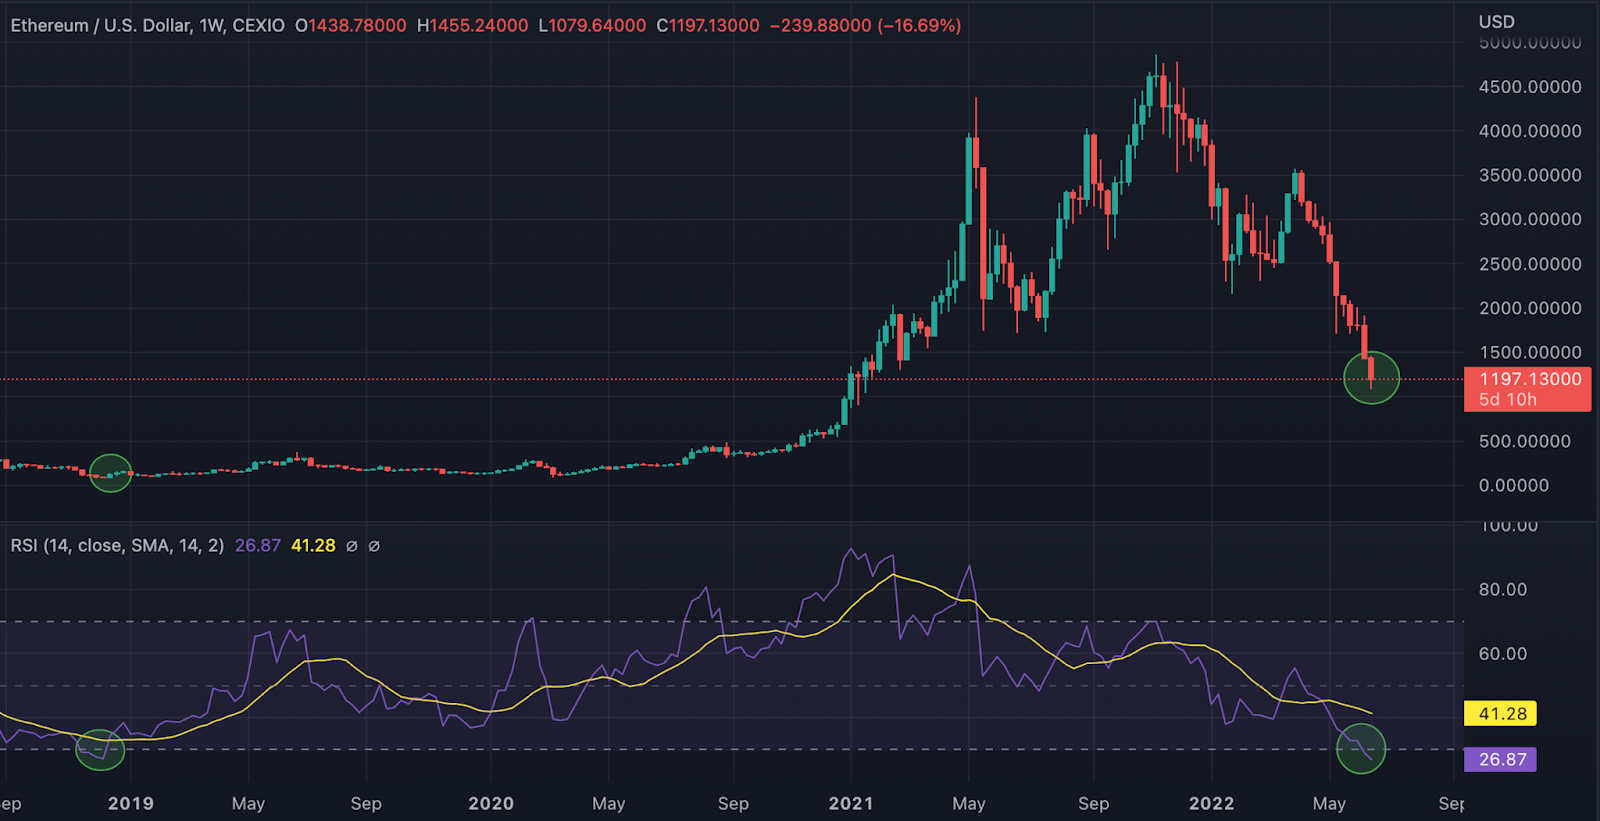
ETH oversold on weekly RSI: December 2018 and currently.
Another metric that is certainly worth noting is the weekly RSI. As the RSI currently sits below 30, it is now considered “oversold”. Referring to historical data, we can see in the above image that the last time ETH entered this area was in December of 2018. This ultimately ended up being the bottom for ETH following the substantial decline in price throughout 2018.
Most market spectators will be watching the RSI and ETH’s prices closely from here. Though sizable bullish price momentum could be imminent, it is important to understand that historical data is useful for reference, but both the RSI and ETH’s prices could still go much lower from here.
- Stochastic Showing Potential Reversal Signal
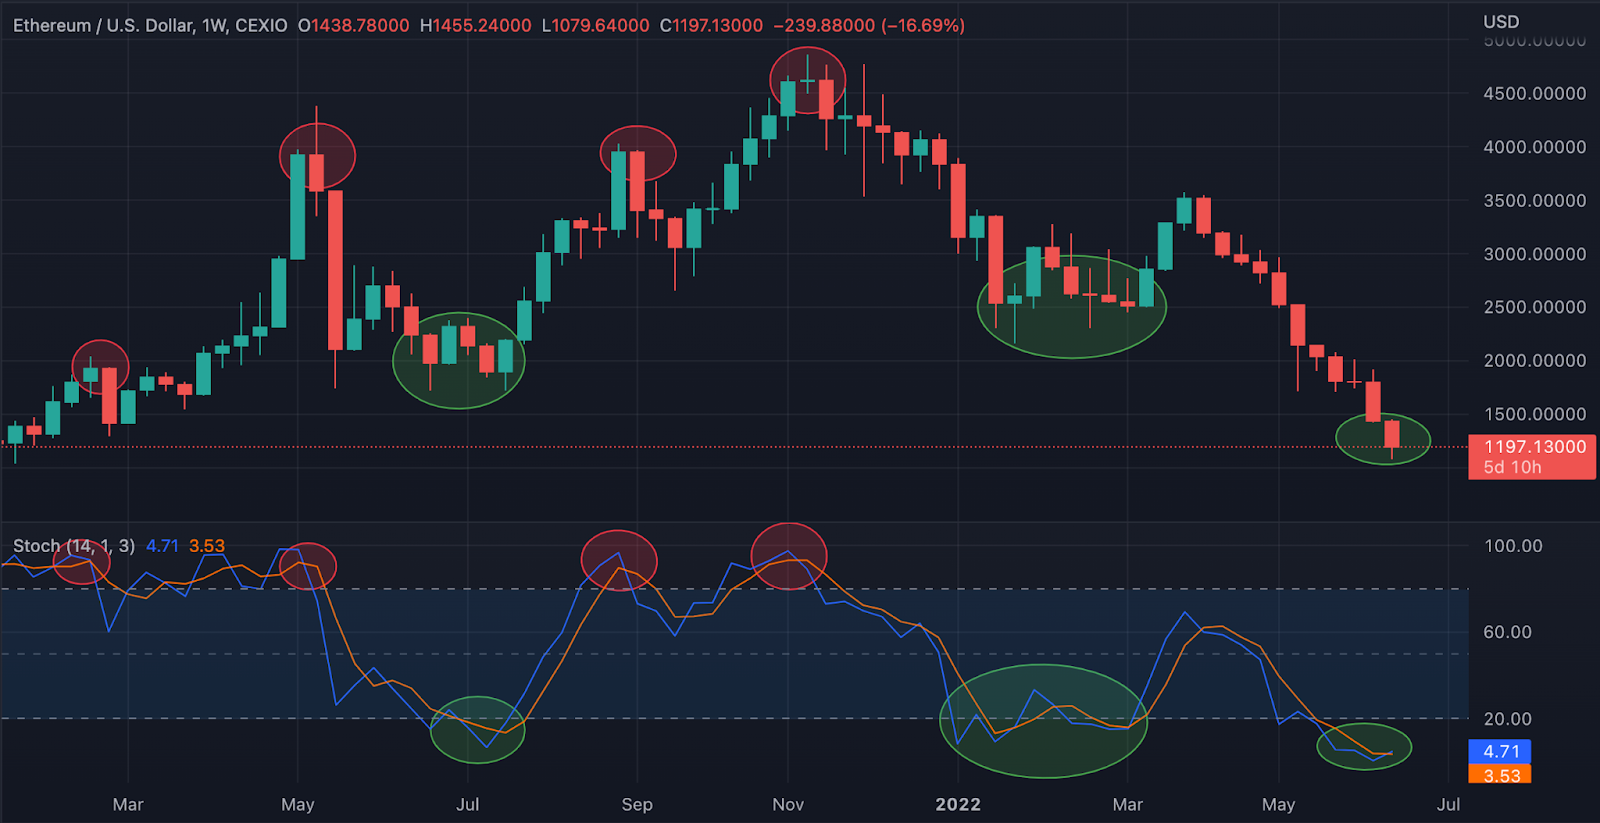
Stochastic on weekly: showing overbought and oversold moments leading to price action
When we refer to the Stochastic (Stoch) we can see that ETH has been following very clear cyclical movements with Stoch acting as a guide in recent weeks. Traders may want to reflect on this metric for future reference as it has been very successful in predicting local tops and bottoms over the past two years.
At the current moment, ETH has brought the Stoch to the bottom of the zone at 4.71/100. This could indicate that we have already witnessed the local lows for ETH. It will be up to traders to determine if the risk/reward ratio is in their favor from here if they want to initiate a long, and bears could potentially be looking to take some profit off the table here as well.
CRYPTO INDUSTRY UPDATES
Lummis Gillibrand Bill
Over the years, numerous bills have been proposed in the US to regulate the cryptocurrency industry. Many of these failed to be passed into law, but this recent effort from senators Cynthia Lummis of Wyoming and Kirsten Gillibrand of New York is worth taking note of.
The bill was presented this past week and aims to bring a plethora of new changes into the space. We may soon find out how cryptocurrency will be regulated and monitored in the US, and this has global implications as other countries are expected to adopt similar policies.
Within the 69-page bill, it has been stated that BTC and ETH will be classified as commodities, with all other altcoins likely being considered securities. This means that BTC and ETH would fall under the jurisdiction of the Commodity Futures Trading Commission (CFTC), and altcoins would be monitored by the U.S. Securities and Exchange Commission (SEC). This is just the tip of the iceberg, and we will keep you informed as more details and a potential timeline for this bill are shared.
Bitcoin Mining Developments:
Whenever Bitcoin experiences a lengthy period of downward price pressure, the question of mining costs comes up. According to blockchain analytics company CryptoQuant, the current cost to mine one BTC is around $22,000. With BTC sitting below this figure, many are wondering how miners will respond.
In the US, we are seeing a very mixed attitude towards mining overall. As states like New York and California express a harsh stance against the practice, other states like Kentucky, Georgia, and Texas have provided refuge. A combination of factors including favorable policies, cheaper electricity, economic incentives, and more will ensure that these states become the centers for cryptocurrency mining in the US.
ETH2.0 Launches on Ropsten: Welcoming PoS Soon
The Ethereum switch from a proof of work (PoW) protocol to proof of stake (PoS) has been in the works for some time. Over this past week, the Ethereum Foundation demonstrated a clear step towards that goal by launching the protocol on the Ropsten testnet. By all accounts, this trial was successful, meaning we can expect the organization to go forward with this so-called “merge” in the coming weeks.
A successful switch to PoS could have huge implications for ETH’s future. As the world gradually becomes more conscious of PoW systems and their frivolous use of energy, there will potentially be an increased demand to find alternative methods. PoS uses up to 99% less energy than traditional PoW mining, meaning that Ethereum will be in a better position for mass adoption.
On that note, the Ethereum Foundation also let it be known that they are delaying their plans to initiate the “difficulty bomb” for two months. To put it plainly, this difficulty bomb is a measure that ensures that all mining on the network stops after the merge by making it exceptionally difficult to continue. Despite this, the full merge is still planned for late June and all signs point towards it happening appropriately.
Celsius Facing Difficulties Amongst BTC Decline
The cryptocurrency lending platform Celsius has frozen all withdrawals, swaps, and transfers over the last week. In a public statement, the company cited “extreme market conditions” as the factor that led to this decision. Throughout this statement, Celsius repeatedly stated that this was a decision made to ensure that they can stabilize their liquidity before they reopen withdrawals and other features.
The root of the challenge Celsius faces rests on ETH locked in staking contracts being unredeemable until the merge successfully launches on the Ethereum mainnet. Even after a successful launch, there is still no timeline for when assets can be redeemed from staking contracts on the network.
While we cannot determine what kind of immediate effect this news had amidst the already cascading cryptocurrency price action, it likely caused further uncertainty in the overall marketplace with the Terra crash still fresh in the minds of investors.