Recent weeks have not been kind to crypto bulls but some analysts believe that the worst could be behind us. The consistent selling pressure across Bitcoin and the rest of the cryptocurrency markets have certainly been impressive in a sense. Normally during long periods of Bitcoin moving in one direction, you can expect several brief bounces as BTC attempts to break out in the opposite direction. However, the plunge continued with twelve weeks of incessant selling on the BTC/USD chart.
While the historic $20,000 marker was not off the table for BTC spectators, it’s safe to say that most were surprised that we reached this area in such a quick and direct manner. After this, the question quickly became would we hold this area, or were more lows in store for us? The answer was delivered over the weekend with a short-lived plunge to $17,500 before BTC regained composure.
While BTC currently sits around $20,500, there are a variety of scenarios that could play out and an astute trader will be watching them all. Could we see a lengthy period of accumulation here or a runup to $35,000? Both have the potential to occur, providing the market keeps showing buying interest. Otherwise, we may ultimately be fated to go even lower.
We’ll explore all of these possibilities for BTC, as well as the outlook for Ethereum (ETH). In recent market news, we’ll also be taking a look at the developing situations surrounding Babel Financial, Three Arrows Capital, the Ethereum merge, and more.
BITCOIN ANALYSIS
Price Overview (June 21)
- Last 7-day change: +0.60%
- 7-day low: $17,800
- 7-day high: $22,700
- Last 30-day change: -30.84%
- 30-day low: $17,800
- 30-day high: $32,000
Network Overview
- Blocks Mined (7-day): 961
- Average Block Interval (7-day): 654 seconds
- Coins Discovered (7-day): 6011 BTC
- TX Count (7-day): 1.736 million
- Net Change in Exchange Balance (7-day): -100,000 BTC
On-chain activity
- Mining difficulty continues to rise while BTC prices fall
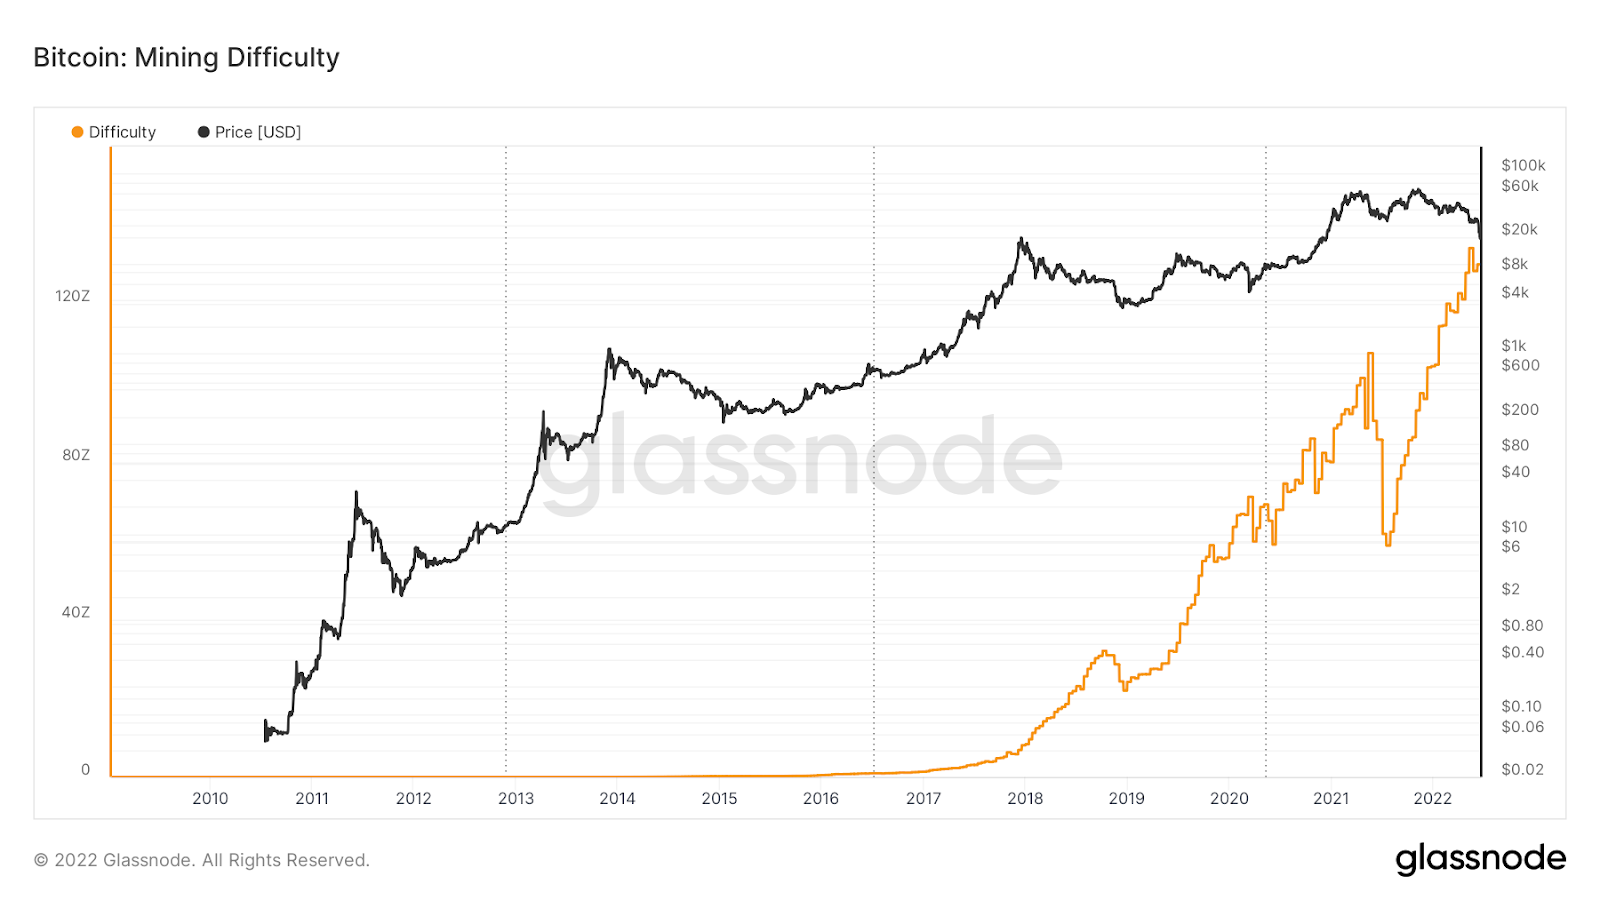
As BTC’s price continues to decline, the mining difficulty and overall cost of mining continues to rise. The point of unprofitability for miners is coming quickly and the ultimate effect of this metric has not yet been determined. We may see many miners close their operations, while others will attempt to keep mining throughout the bear market as they hold true to their vision for the future.
- Long-term holder supply
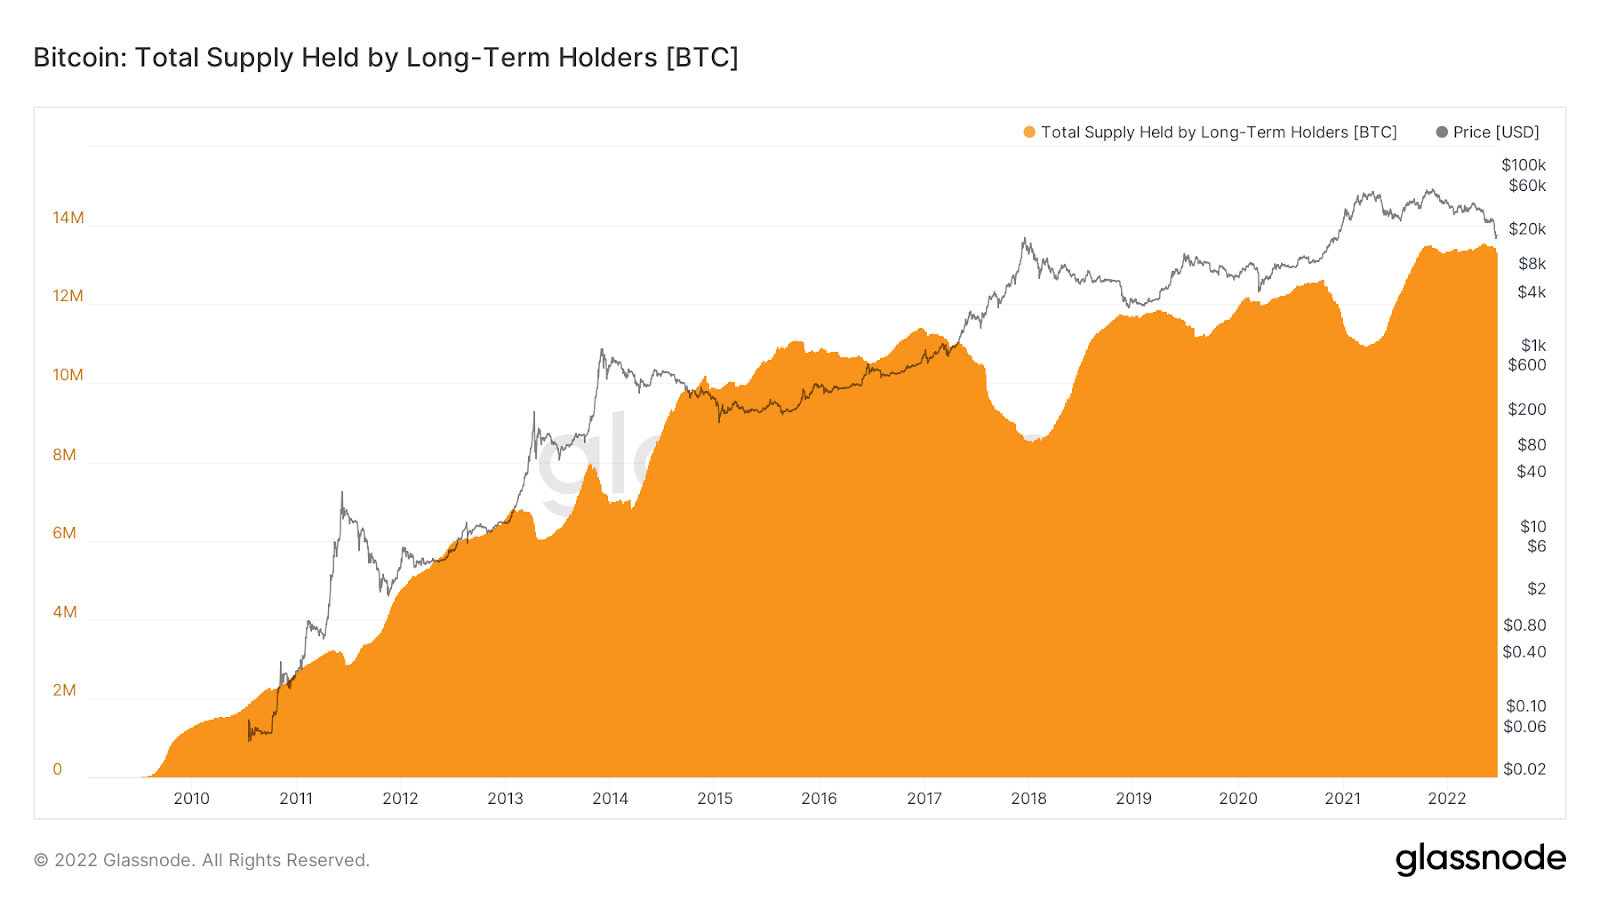
During periods of galvanizing bullish price action, we see that less BTC is held by long-term accounts. Another consistent metric that has historically coincided with the end of any bear market is a return of BTC to long-term wallets. A similar exchange is currently happening, and theoretically, more long-term holders will mean a more stable price bottom is currently forming.
Bitcoin technical analysis
Bitcoin may have been through absolute doom and gloom over the last few months, but there could be some relief on the way. Traders would do well to pay attention here as extreme volatility may be in play in the coming weeks. Here are some of the possible scenarios to consider as we move forward.
First is a lengthy accumulation period that would possibly indicate that we have already seen the lows for the year. If Bitcoin were to get above the 200-week moving average (MA) of around $22,500, that could demonstrate that it is ready to seek higher highs, likely bringing in renewed interest from market spectators and the media. The final scenario would be a return to the consistent selling pressure after a short-lived bounce which may push BTC towards the $10,000 marker or lower.
Many spectators have already voiced their opinion that for a true BTC bottom to materialize, a lengthy accumulation period is needed. This would serve to give the overall market a break, a chance to cool off before another macro cycle kicks off. It would also flush out the retail money that would be instrumental in pushing the price higher as they return later in the cycle.
A note of caution to anyone looking to enter a new position here, there is a somewhat significant chance of ranging here in a tight channel that would bring the sort of choppy market conditions that only scalpers can make use of. This would likely persist for some time, as spot buyers and long-term investors look for confirmation of a breakout in one direction or another.
- BTC accumulation or bullish breakout
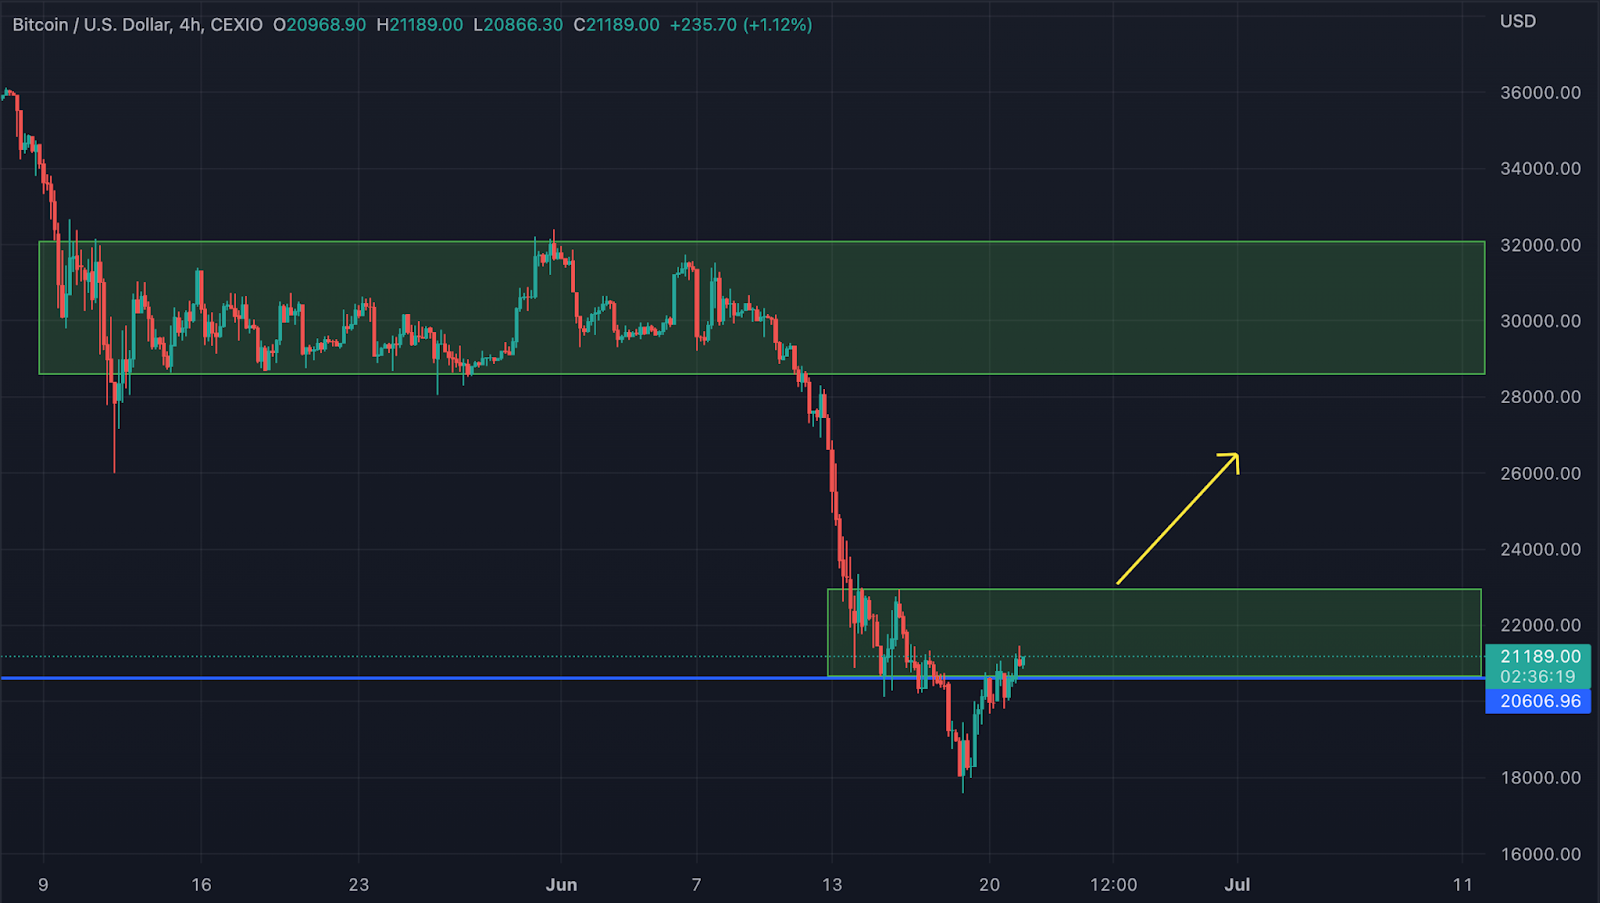
BTC entered a possible channel after rising above the $20,000 level.
After a fall to new lows this past weekend, BTC quickly regained composure to keep its head above $20,000. Now, it has clearly found itself in a range between $20,000 and $23,000. This will be the most likely place for a long period of accumulation if that is what BTC chooses to do. However, any breakout to the upside means we can likely expect BTC to aim for the next zone from $28,500-$32,000. A move such as this may cause bulls to go into a frenzy and write the bear market’s obituary while they call for a return to all-time highs.
- What would a break under $20,000 look like?
The next obvious leg down for BTC if $20,000 fails to hold.
If BTC fails to hold above $20,000, the entire zone from around $12,000-$20,000 comes into play. With no obvious support in this range, it could be a huge trending channel that takes months to play out.
- Fibonacci levels
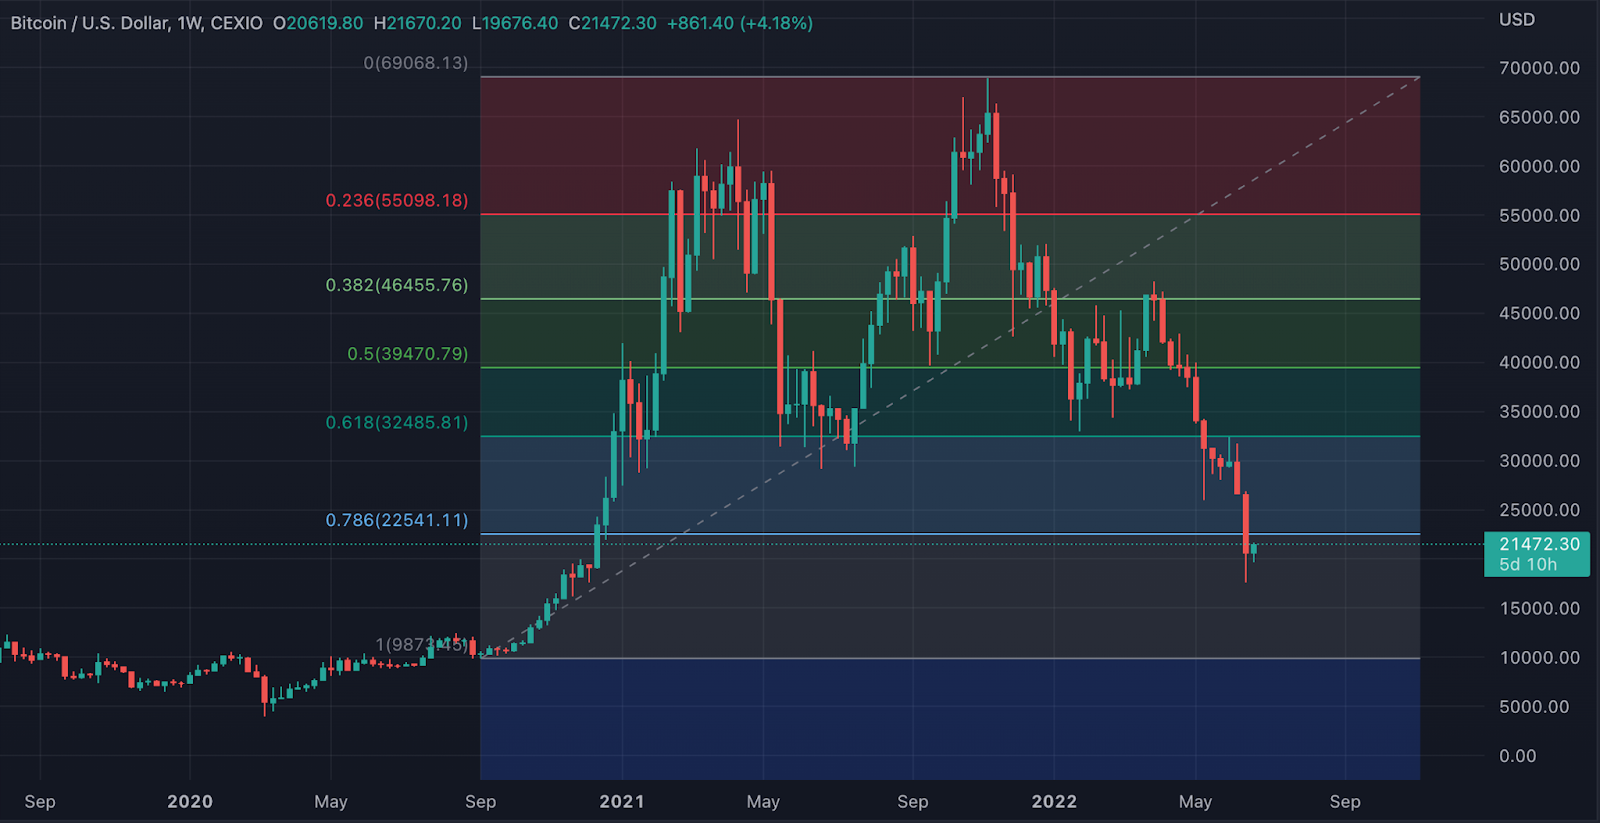
The 0.786 Fibonacci level and corresponding BTC price.
The BTC high for 2021 was $69,000, and it currently sits around $20,500. This represents a 70% retrace. Previous market corrections, such as the 2018 bear market following the euphoria of 2017, retraced as much as 85%. This could suggest that we have not seen the final lows for BTC, but what are the arguments to the contrary?
Fibonacci levels are popular amongst traders as they serve to identify potential reversal levels. After reviewing the massive runup from $9,800-$69,000, we can see that the lower 0.0786 Fibonacci level is around $22,500. BTC went lower than this level and is currently eyeing a move above it. This could potentially illustrate that the local bottom is in for this asset, though further time is needed to know if the true price bottom has already been reached for the year.
ETHEREUM ANALYSIS
Price Overview (June 21)
- Last 7-day change: +3.26%
- 7-day low: $902
- 7-day high: $1,238
- Last 30-day change: -44.29%
- 30-day low: $902
- 30-day high: $2,078
Network Overview
- ETH Burned (7-day): 17,787 ETH
- TX Count (7-day): 7.2 million ETH
On-chain activity
Now is both an exciting and challenging time for ETH holders. On one hand, the future continues to promise incredible opportunities and technological potential for this asset. With the long-awaited merge finally on the way, one of the biggest roadblocks to scalability (the proof of work protocol) will be overcome.
In the short term, ETH holders still have to deal with the continuous challenge of staked ETH value discrepancy and floundering ETH price. The charts below can paint a picture of the current mindset of ETH enthusiasts.
- ETH balance in exchanges and smart contracts
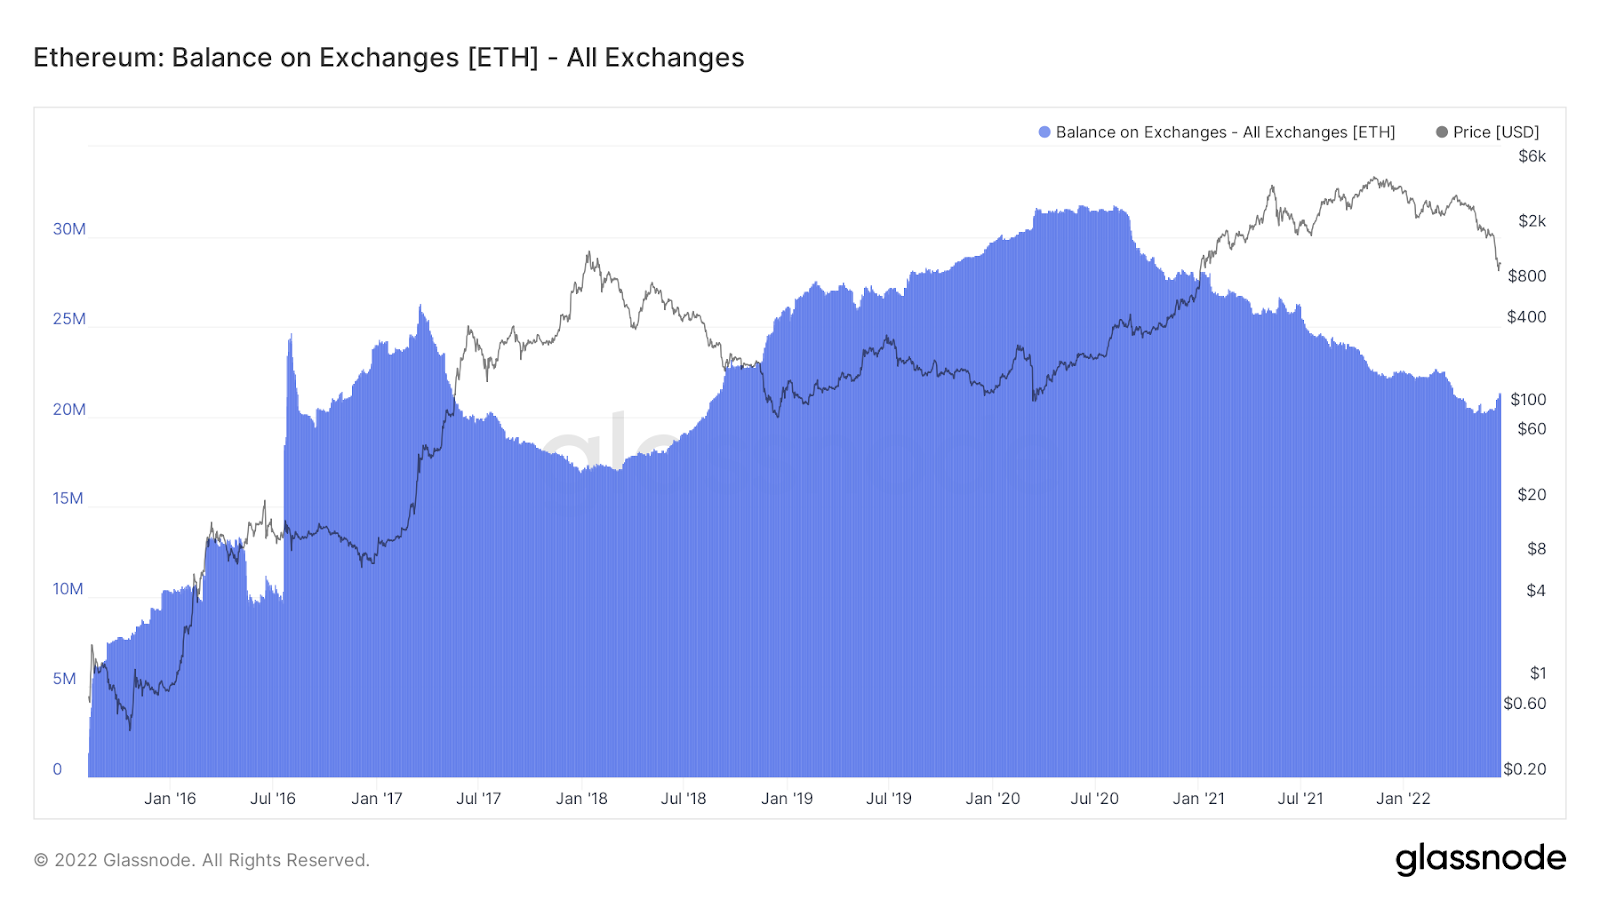
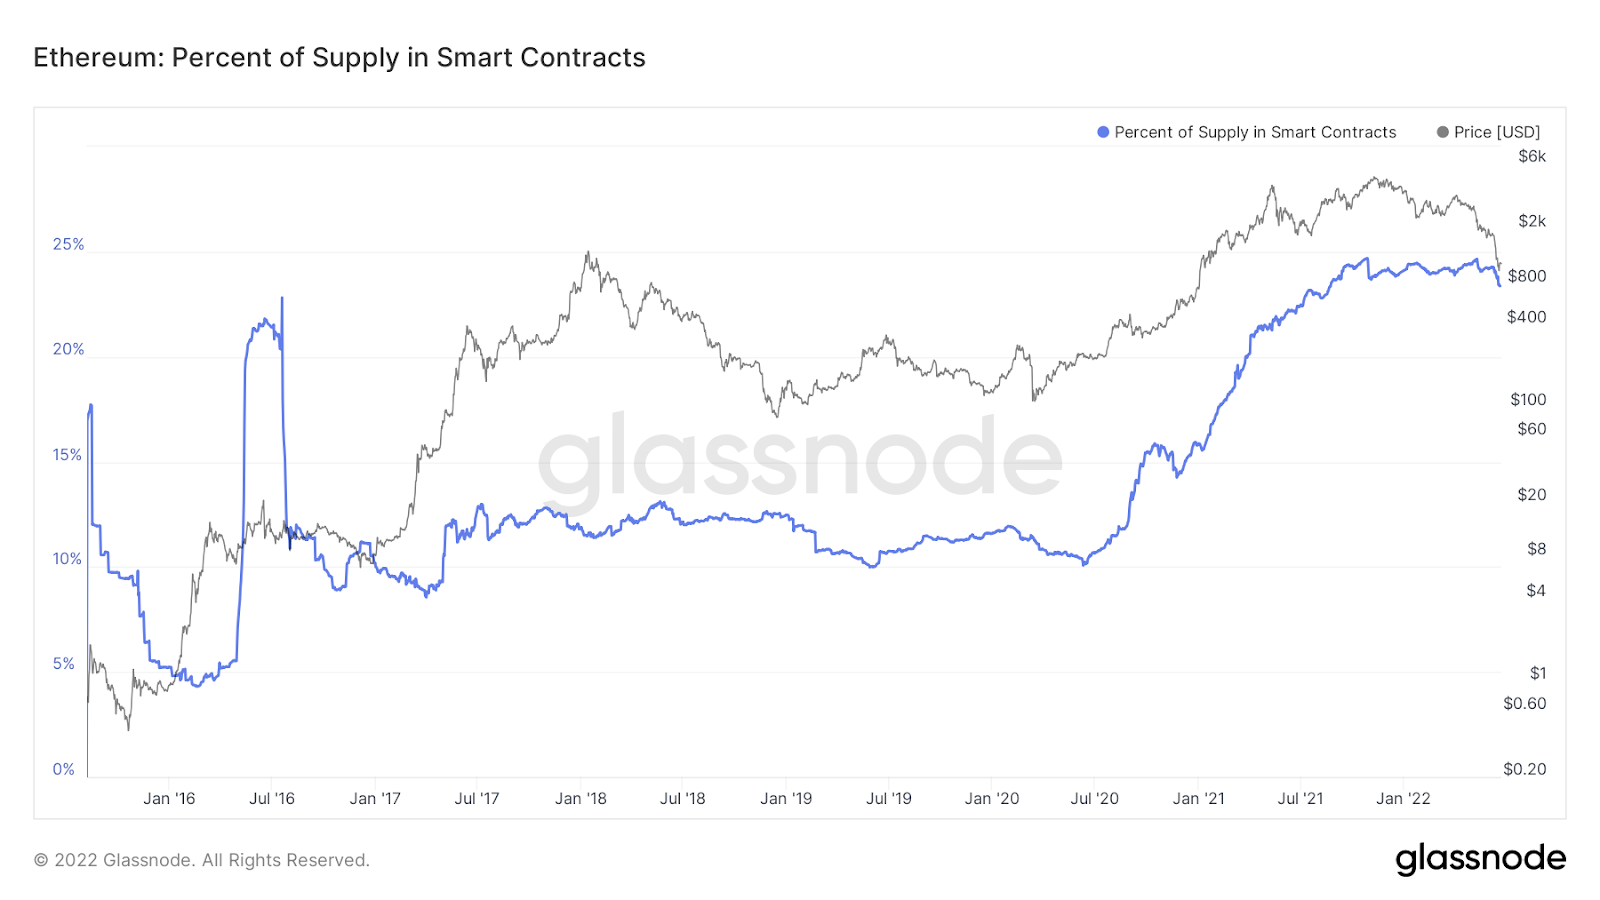
As we can see in the above graphs, the amount of ETH held on exchanges continues to fall, and we are beginning to see a decline in the overall supply that has been dedicated to smart contracts. Numerous factors are in play here, but this is likely due in some part to the upcoming merge. When we begin to see more ETH return to exchanges, it could be an indication that altcoins in general are due to experience another bullish market.
- The amount of new ETH wallets
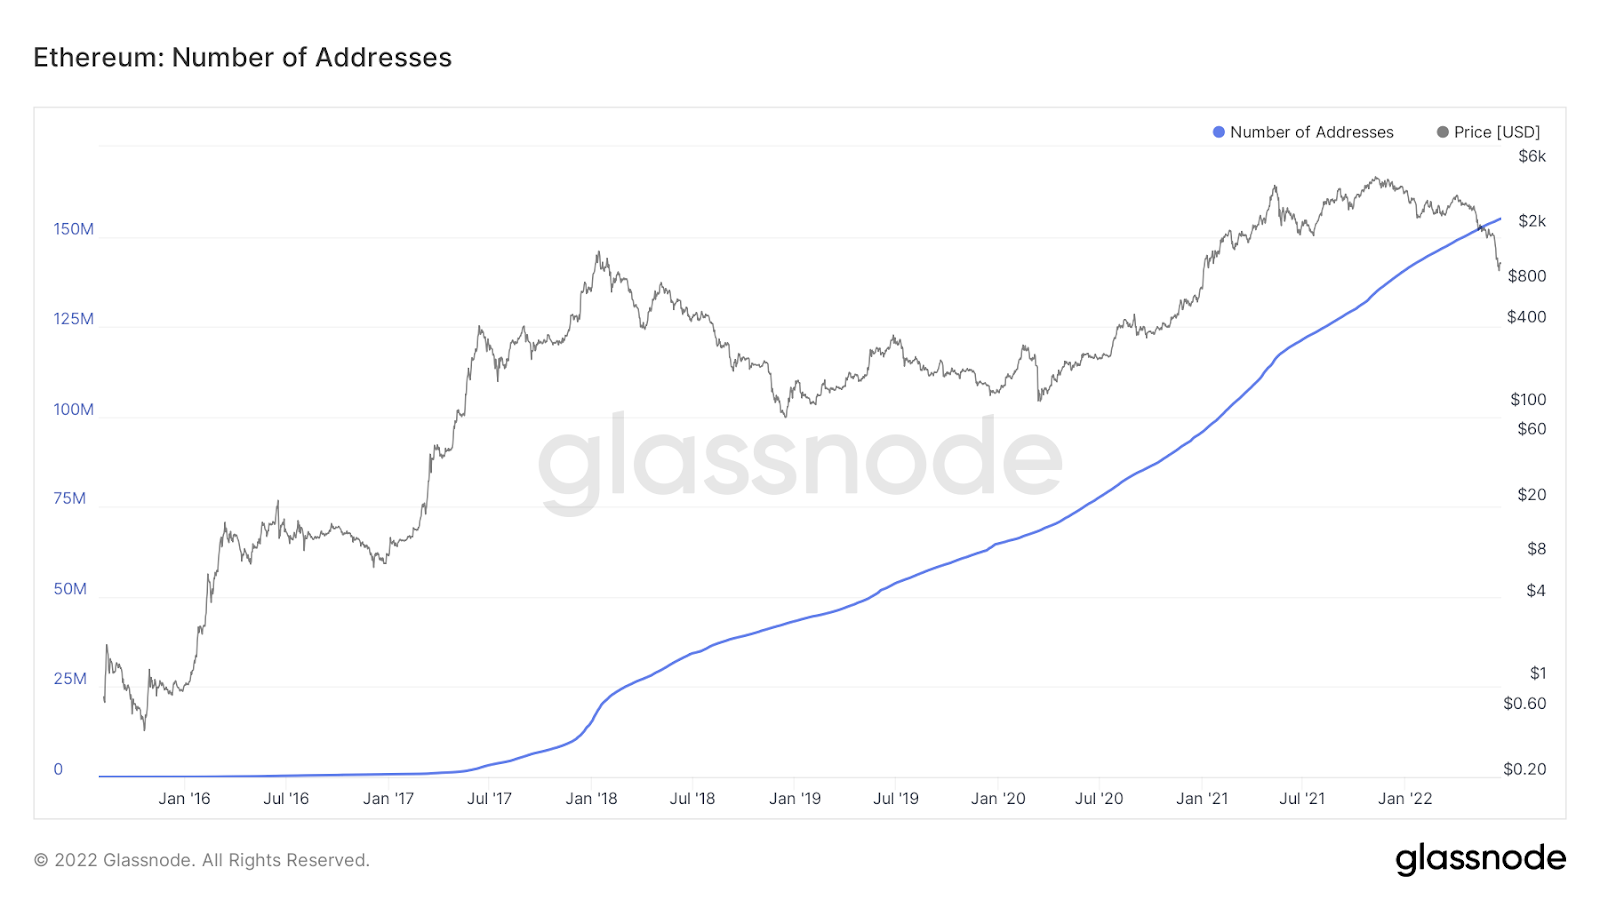
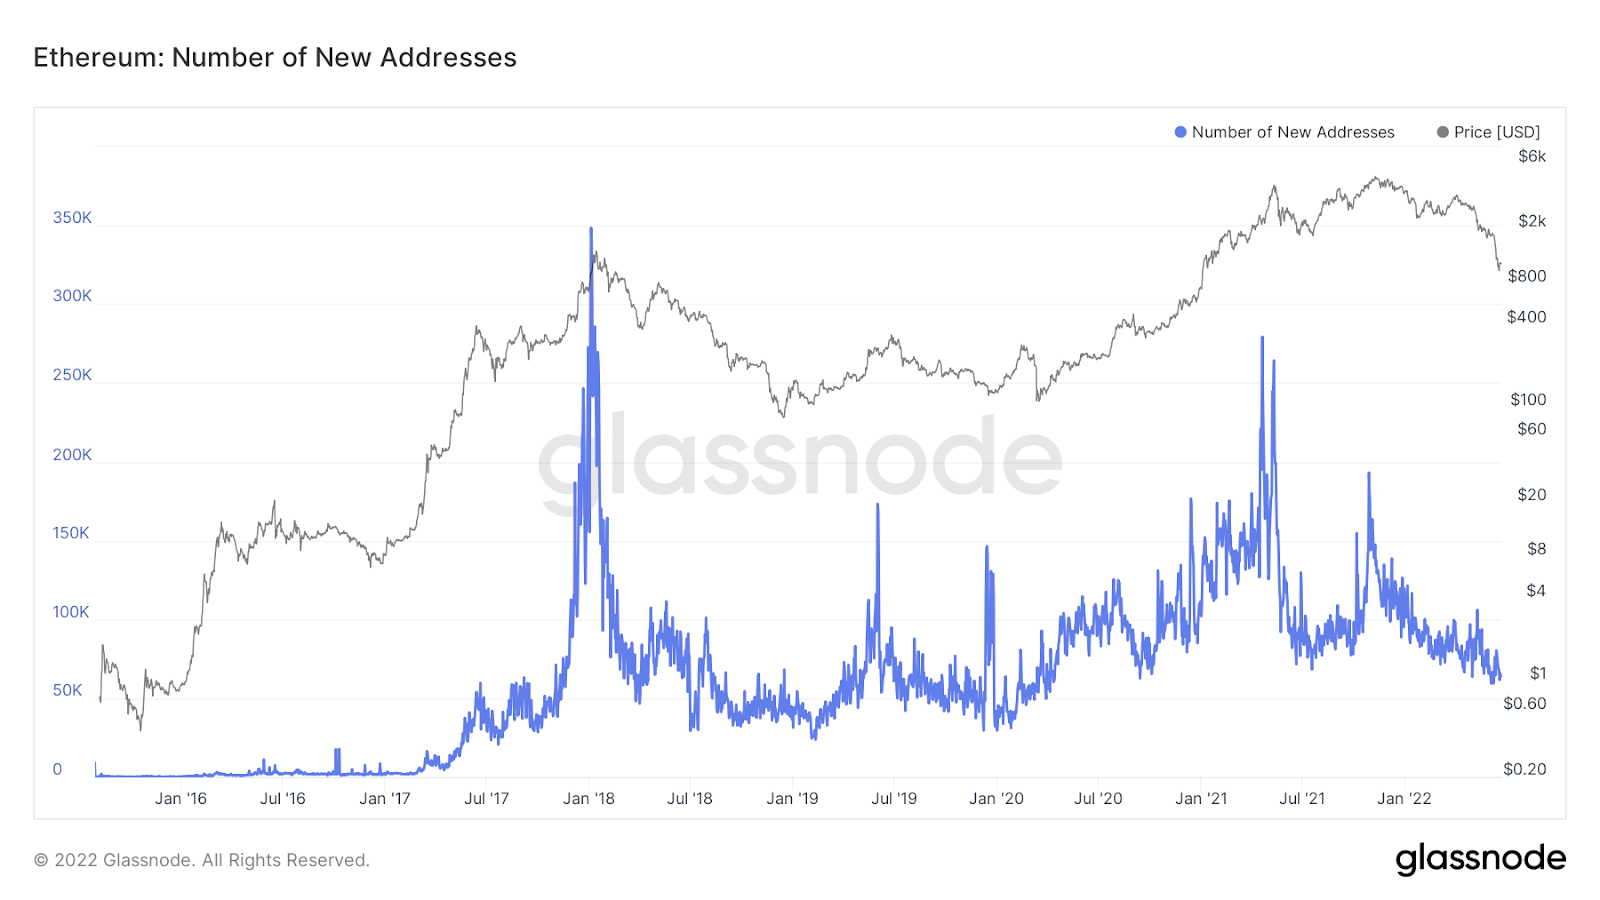
The growth of wallet addresses generally indicates new ETH enthusiasts and crypto market participants entering the arena. We can refer to historical data and determine that the most addresses are created in times of bullish euphoria in the market. However, we can also attempt to pay attention and use this metric as a signal of bullish divergence in certain scenarios.
Currently, we are witnessing a slump in the number of new addresses being created. This will likely be an interesting metric to return to once the ETH merge is complete.
Ethereum technical analysis
From its recent low, Ethereum (ETH) jumped more than 30%, a strong demonstration of momentum. This may indicate that traders are interested in bringing the price higher in what would be the first bullish moment for the asset since mid-March. With the upcoming “merge” on the horizon, and certain NFTs still generating attention from mainstream investors, ETH is very much still in the public consciousness.
Overall, the stage could be set for ETH to start a move upwards, and the risk/reward ratio may no longer favor short-sellers. Of course, any bullish momentum for ETH could spark numerous other altcoins to follow suit. Let’s take a look at what the charts may have to say about this asset.
- Short-term moving averages
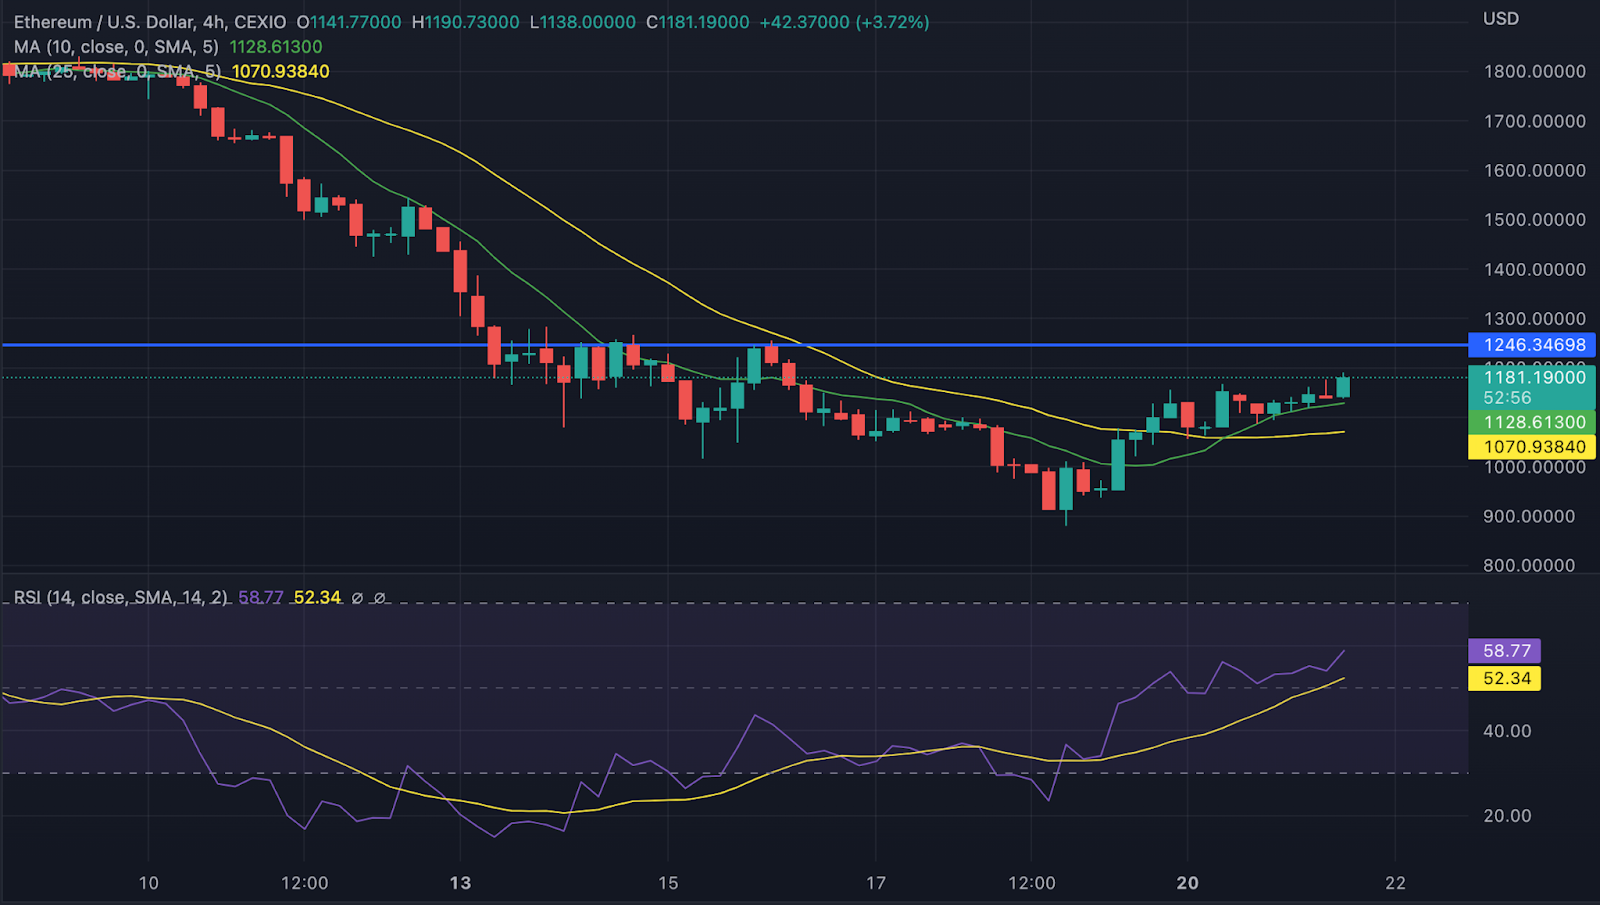
Several indicators moving in tandem suggest that ETH may be gearing up for a big move.
On lower time frames such as the 4-hour, it would appear as though bulls are in control of ETH, at least for the time being. The drop below $1,000 was met with immediate, frenzied buying action. When implementing fast MAs, we can see that the 10-period MA has crossed above the 25-period MA, with the RSI also pointing up. This may be enough of a bullish bias to attract more buyers, and the next resistance line is set at $1,250. Any breakout above this would certainly bring confidence back to bulls, while bears would likely attempt to short any rally.
- Long-term moving averages
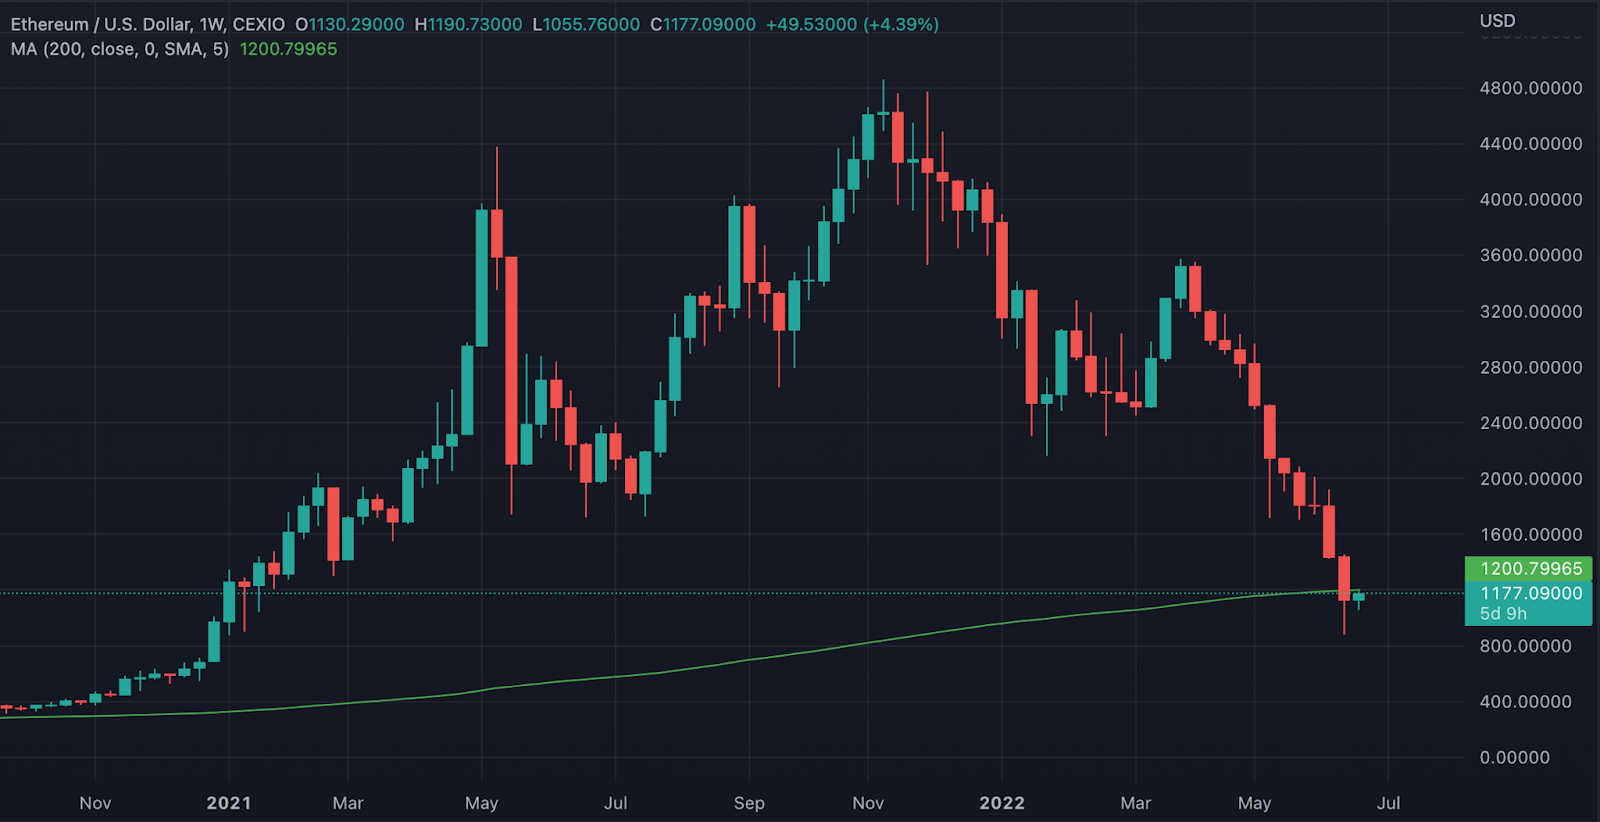
ETH 200-MA (weekly)
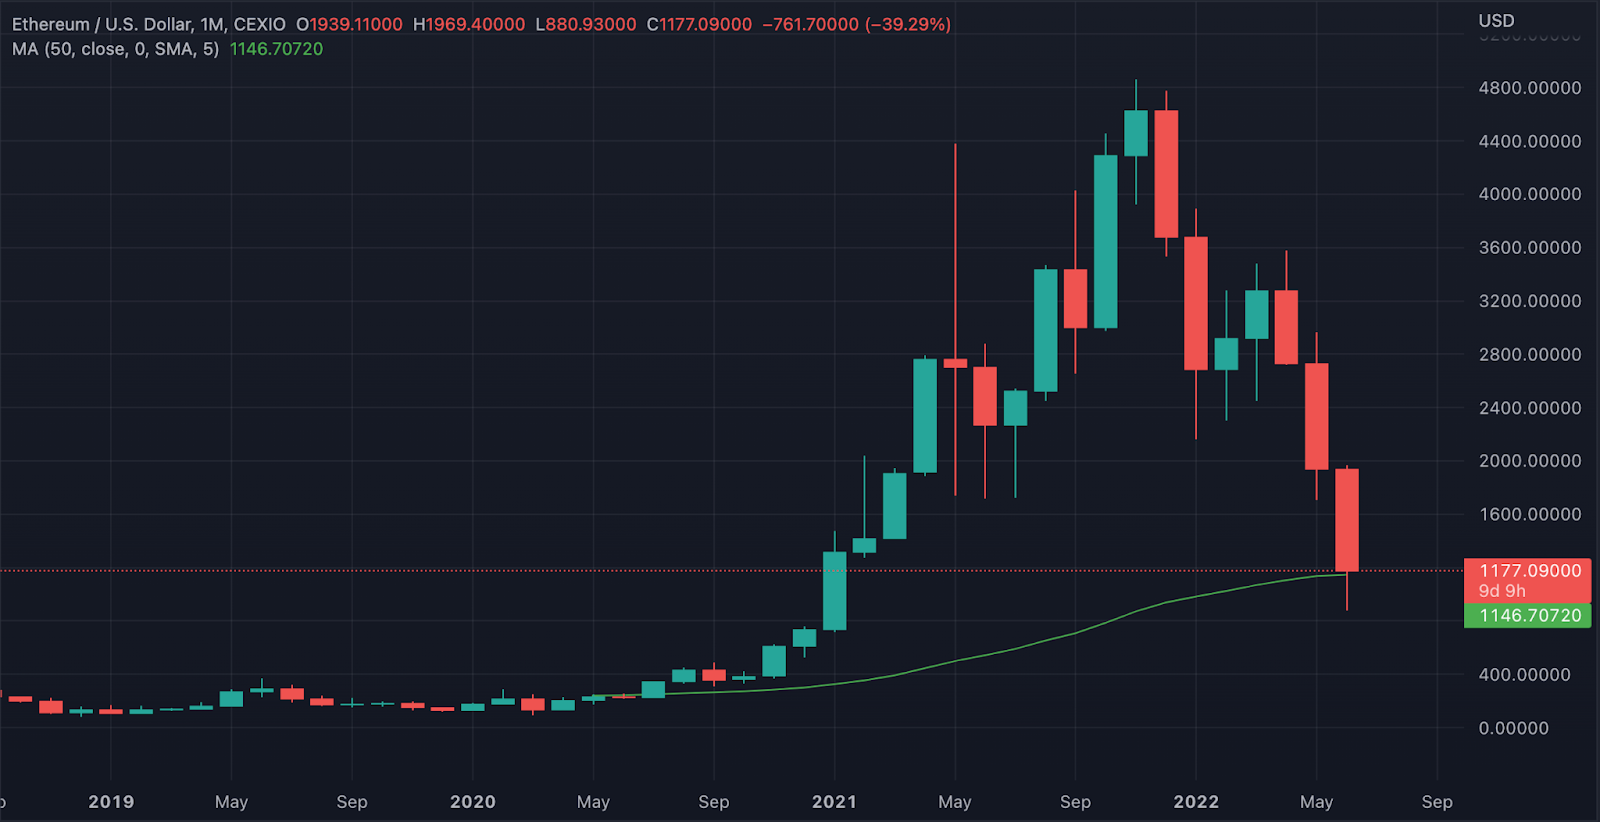
ETH 50-MA (monthly)
In times of uncertainty and chaos in the market, it can be beneficial to keep it simple in your approach to technical analysis (TA). Reflecting on our analysis from last week, we can return to the ETH MAs and see how they have held up under persistent selling pressure.
At the current moment, ETH may have lost the 200-week MA, but it is not far underneath it. However, the 50-month MA has held up brilliantly and we could see more traders open a new long in this area.
- Bollinger bands showing increased volume
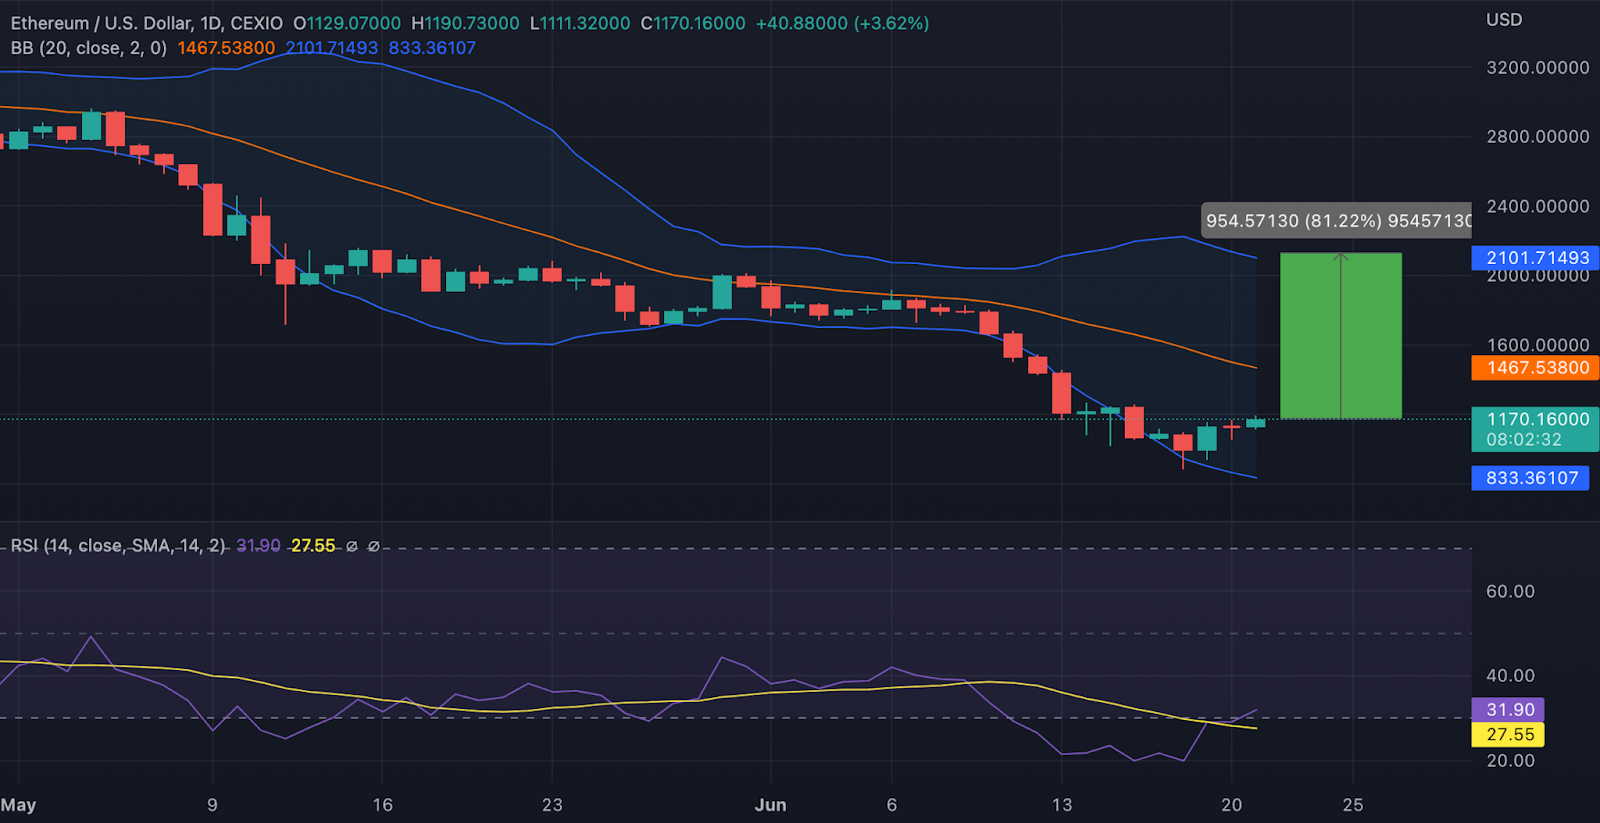
ETH would not need much to reclaim the $2,000 zone.
If bulls were to regain control from here, there does not appear to be much in the way of a large move. With the Bollinger Bands (BB) indicator, we could see that there is a lot of space for price action, meaning a volatile market for traders to enjoy. After a BB squeeze in early June, we saw the price breakdown but that momentum could now transfer to the bulls, supported by increased volume and the uptrending RSI.
- A clear macro picture
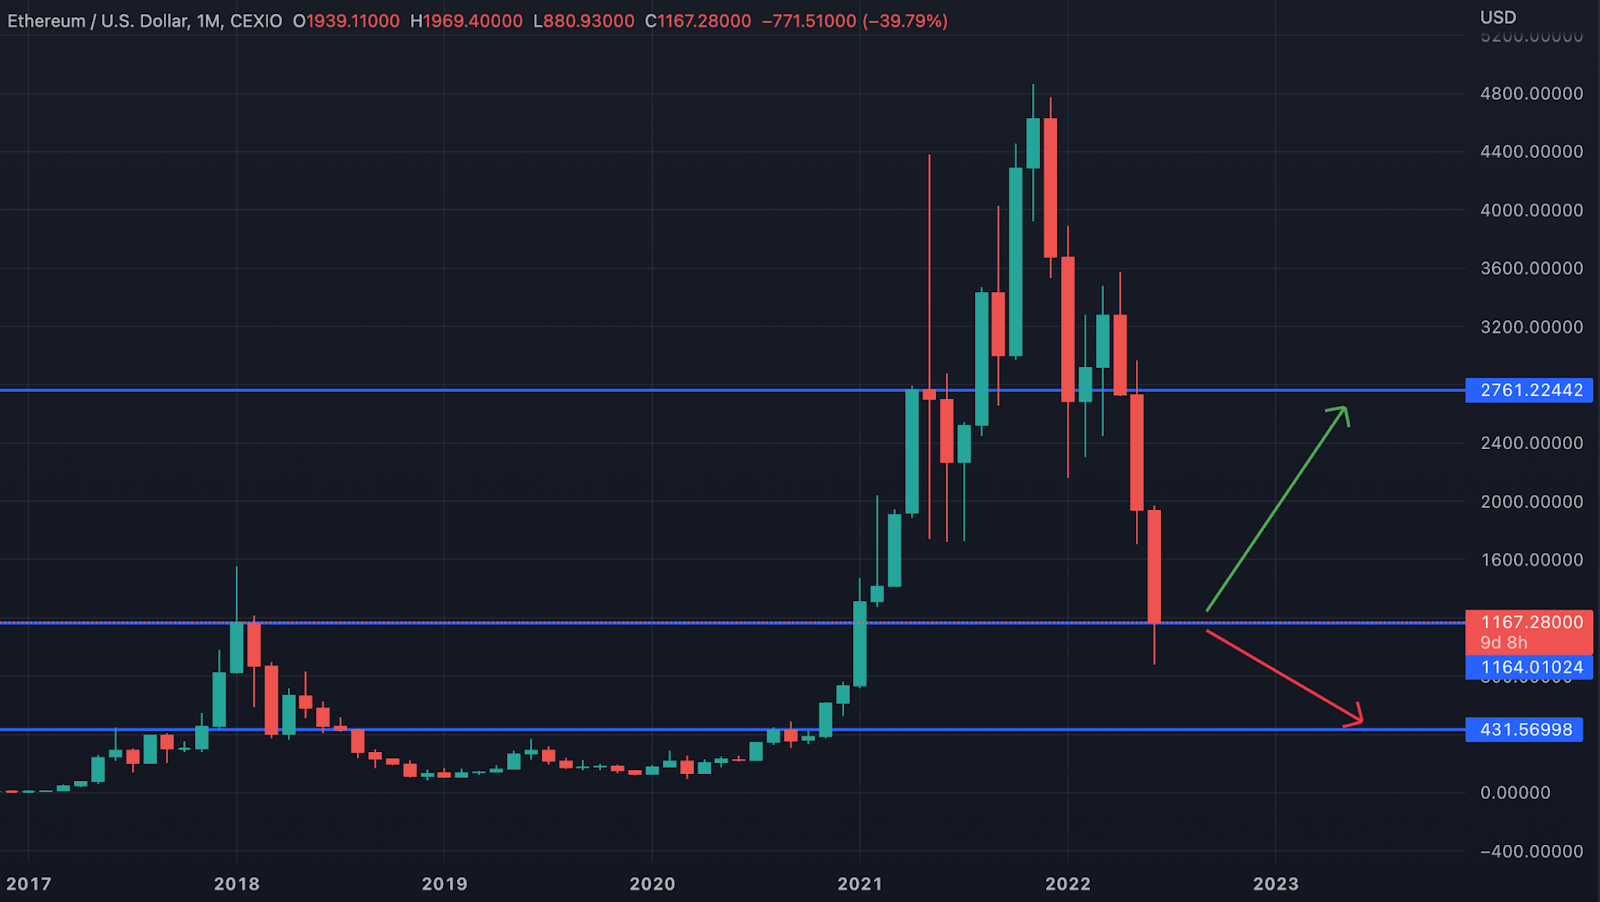
The clear paths forward for ETH.
To look at the macro picture, it is clear that ETH has a decision to make. A bounce at its current levels would likely keep it constrained between the $1,150 and $2,750 channel, while a breakdown could send it careening towards the $430 level for what would quickly become a desperate situation for bulls. Regardless of which direction it chooses, unbiased traders are sure to take advantage of the possibilities that the market provides.
CRYPTO INDUSTRY UPDATES
Bancor pauses impermanent loss protection
The decentralized automated market maker (AMM) Bancor has paused its impermanent loss (IL) protection, a feature considered fundamental to its product and brand. In a blog post this weekend, the company cited a combination of factors such as “manipulative behavior” from “bad actors” and overall “hostile market conditions”.
Naturally, Bancor users are upset by this update. For the general market, this is just another measure of uncertainty to add to the stream of negative news we have received over the past few months. While Bancor assures that they will resume this IL protection, they have not provided an expected date yet.
Three Arrows Capital facing troubles
Late last week, the market received news that cryptocurrency hedge fund Three Arrows Capital (TAC) is facing severe cash troubles amidst the relentless crypto selling pressure. After a series of failed plays on different cryptocurrencies, TAC has reportedly been unable to fulfill its margin calls from several platforms. A major factor in their current situation was an ill-fated $559.6 million bet on Terra, the cryptocurrency that plummeted in recent weeks.
As of now, it appears that the organization is considering its options to combat these financial troubles, including a sale of assets or an outright bailout from another firm. There is also another important detail in this saga. It has recently come to light that TAC also provided treasury management services for a number of other cryptocurrency projects. What effect this TAC news could have on the market at large is open to speculation.
Babel Finance freezes withdrawals
The Hong Kong-based cryptocurrency lender Babel Finance is yet another name in a disastrous string of platforms freezing withdrawals. By now, this is a cliché tale. With the rampant selling across all cryptocurrency assets, we have seen several high-profile lenders freeze withdrawals for an unspecified amount of time. Babel Finance is the latest, but hopefully also one of the last we will see.
Babel said that they spent last Monday assessing all business operations to determine their liquidity status. Reportedly, Babel manages the funds of over 500 customers, and they held $3 billion in total loans at the end of the last year.
CRYPTOCURRENCY PRODUCT UPDATES
Ethereum merge update
Earlier this month, Ethereum successfully performed a test of the upcoming “merge” on the Ropsten testnet. Following this success, they will repeat the experiment on the Sepolia testnet as well. Sepolia has recently launched their Beacon Chain, meaning they will begin to reach consensus with a proof of stake (PoS) protocol instead of their prior proof of work (PoW) protocol.
This is exactly what Ethereum plans to do, and naturally, developers want to see what kind of data they can gather from this testnet. Currently, the full Ethereum merge is still planned for the end of August, but this may be a fluid date.
CEL token short squeeze
Last week, we discussed the crypto lending platform Celsius and its decision to freeze users’ withdrawals until the market corrects itself. This led to a firestorm of controversy as media outlets covered the situation and users took to social media to vent their frustrations. As a result, the native token of Celsius, CEL, dropped to a low of around $0.20.
In typical crypto fashion, savvy traders realized an opportunity amongst the mounting shorts against CEL, and in turn, pushed the price up in hopes of initiating a short squeeze maneuver. From the $0.20 low on June 13th, the CEL token was pushed to a high of $1.53 on June 21st. It has since settled around $1, but there is no telling if the potential 800% gain was enough to satisfy these bulls.