
The cryptocurrency market has rallied after bottoming out at a market cap of $1.5 trillion market cap on February 24. The market cap topped out at a resistance of $2.16 trillion on April 3, however since then, most of the gains from March have been lost.
Although overall financial markets have already priced in the war-related developments during February and early March, recent comments from Federal Reserve officials, regarding aggressive interest rate hikes, have scared markets because they were interpreted as an admission from the Fed that a recession is coming.
There was some relief on April 12 when the yearly consumer price index (CPI) for March was announced, as expected, at 8.5%. The cryptocurrency market cap has been consolidating around $1.8 trillion since the announcement.
In the meantime, Bitcoin, as the crypto market’s flagship cryptocurrency, retraced to as low as $39,000 on April 12 and is currently consolidating around its bear market demand zone at $40,000 per coin. Considering the higher high and higher low prices Bitcoin has been following since the February 24 bottom, it may be preparing itself for a new swing high, just above $50,000, as the shorter-term market top.
We take an updated look at the on-chain activity and technical analysis of Bitcoin this week, as well as an updated technical analysis for Ethereum. We will also share some altcoins to keep an eye on in the short run.
BITCOIN ANALYSIS
Price Overview
- Last 7-day change: -5.7%
- 7-day low: $39,220
- 7-day high: $43,982
- Last 30-day change: +4.3%
- 30-day low: $39,220
- 30-day high: $48,200
- On-Chain Activity:
On-chain activity is the use of Bitcoin block space by network participants who send transactions and settle value on the network. On-chain metrics that have a significant correlation with the future price of Bitcoin include, the number of active entities, the number of transactions, and the transaction fees paid.
All of these metrics are currently suggesting that the on-chain activity is quite lackluster at the moment and there is little evidence of any strong recovery in the coming days.
- Number of active entities
The number of active entities, in other words, daily active users, is currently ranging inside the rising bear market channel that was established in 2017. It has recently touched the upper end of this rising channel at 296,000 daily active users. This level will act as a significant resistance point moving forward. The number of daily active users needs to pass this level decisively for the Bitcoin network to build strength and Bitcoin’s price to reach a new all-time high.
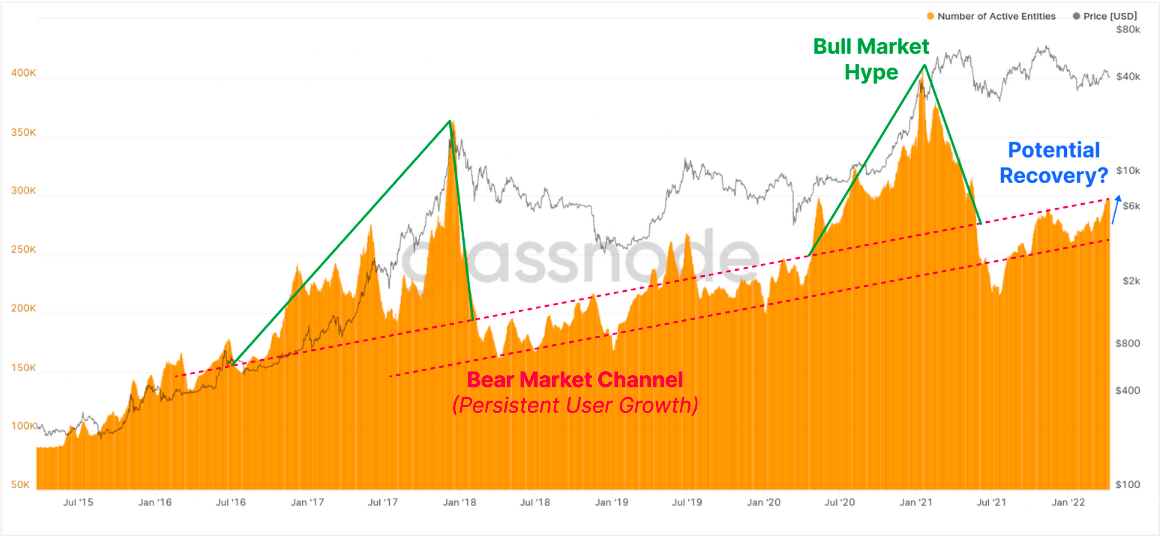
Source: Glassnode
- Number of transactions
Transaction counts are also stagnant, currently at around 225,000 transactions per day. This corresponds to the 2019 bear market average. Although this metric has recovered from the lows of the market crash back in May/July 2021, it’s still a far cry from the hype cycle observed during bull markets (shown in green arrows).
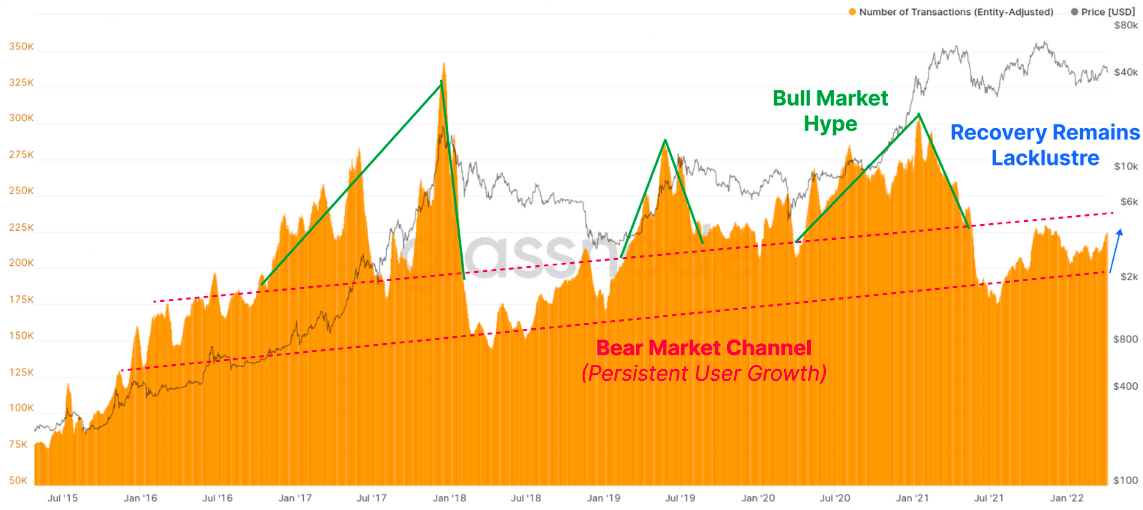
Source: Glassnode
What is interesting to see is that after hitting an absolute bottom, both the number of active entities and the number of daily transactions start climbing, with a certain incline throughout the remainder of bear markets. This signals consistent growth in the HODLer user base. HODLers are investors who are not sensitive to short-term price fluctuations and are active Bitcoin users and accumulators, irrespective of market conditions.
- Total transaction fees
As a consequence of the relatively low demand for Bitcoin block space, there is little network congestion, which results in low transaction fees. Total transaction fees paid to Bitcoin miners have been languishing near the all-time lows since May 2021, supporting the observations made previously that there is not much recovery in regards to the on-chain activity.
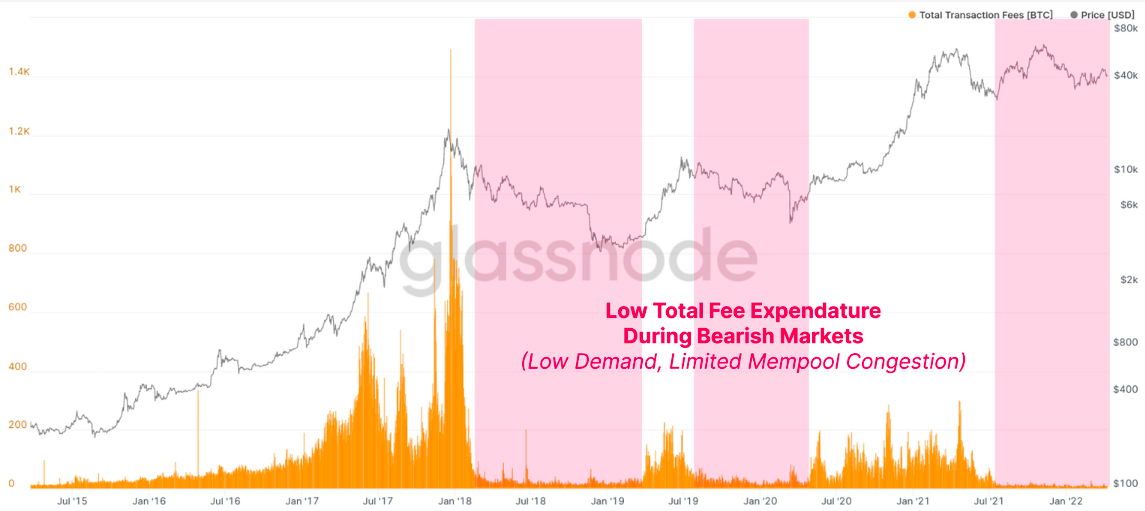
Source: Glassnode
Although Bitcoin’s on-chain activity can foreshadow its future price action, it does not give you any indication about when that activity will be reflected in the price. It could take years for what you see on-chain now to impact the price. Until then, the price of Bitcoin could just head in the other direction, leaving you with significant opportunity costs if you take positions based on on-chain activity only.
If you want to keep an eye on what could happen in between the short and long-term, you can benefit from technical analysis, which we will discuss for Bitcoin in the following section.
- Bitcoin Technical Analysis:
After hitting the 200-day simple moving average (SMA) resistance on March 28 at $48,200, Bitcoin pulled back to $43,000 for a retest attempt.
However, it failed to turn this previous $43,000 resistance into new support because Bitcoin closed the week of April 4 below this figure. As a result, Bitcoin has been falling since April 11, when it dipped as low as $39,000.
$39,000 is where the 600-day SMA support passes currently, which is a very critical moving average support that differentiates longer-term bull markets from bear markets. If Bitcoin cannot hold the $39,000 level on a weekly close, it may undergo a much larger correction in May.
- 600-Day Moving Average Support
Bitcoin has been grinding against its 600-day simple moving average (the red line in the chart below) since crashing to this support level on January 21. Every time the price dipped below the 600 SMA, it has managed to close the day above that support.
After failing to climb above the $48,000 resistance (200 SMA resistance) and staying above the $43,000 support, Bitcoin retraced to its 600 SMA one more time. Contrary to popular opinion, testing a support line so many times is usually a poor development because it weakens the support as the price keeps falling onto the support line.
Under normal circumstances, the 600 SMA support looks ready to break down. However, there may be a fakeout before that due to the factors that will be discussed in the following sections.
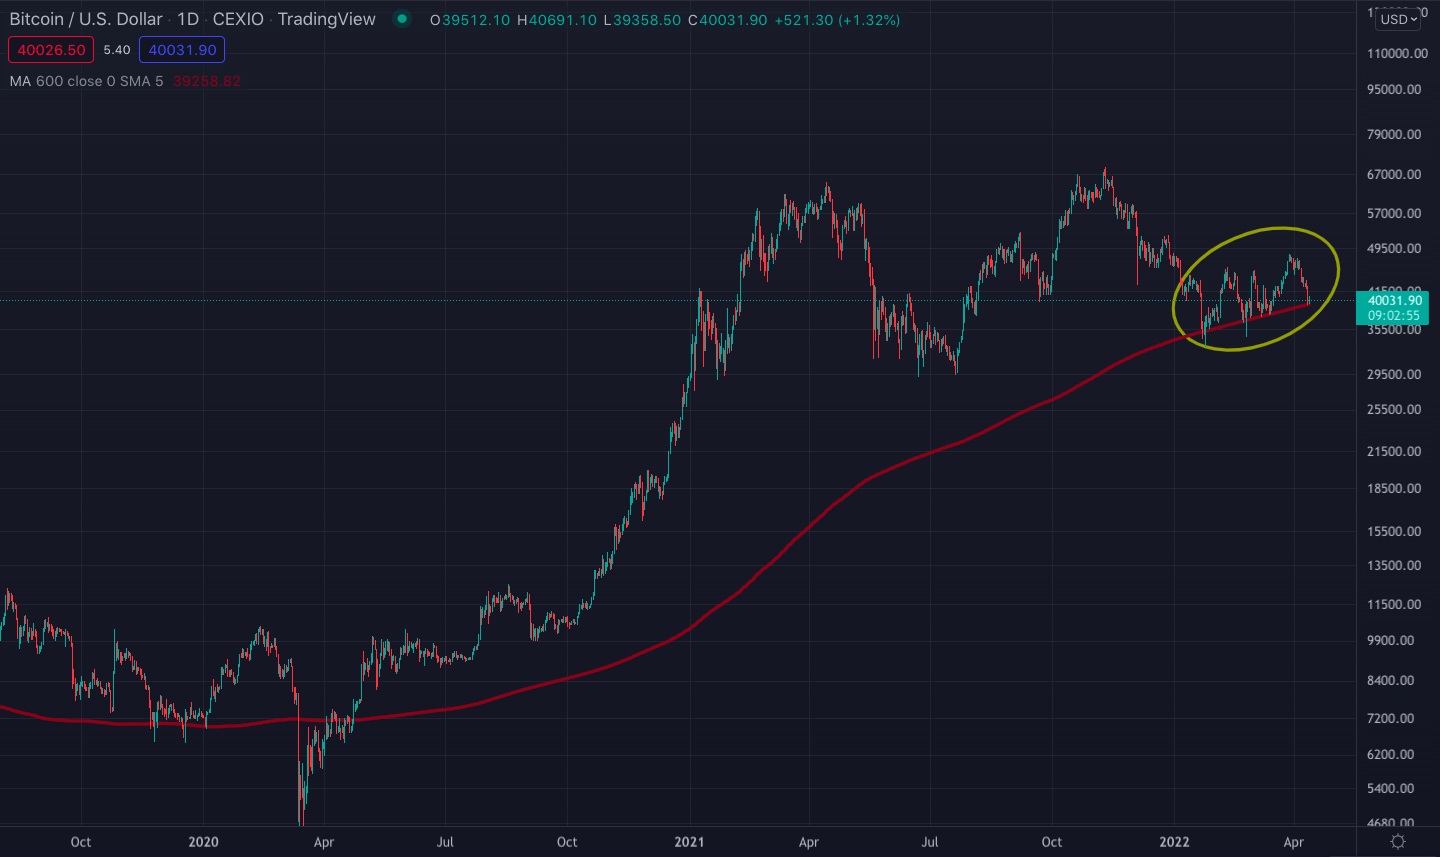
Bitcoin/U.S. Dollar price chart on a daily time frame. The red line represents the 600-day SMA. Source: Tradingview
- Higher highs & higher lows
Bitcoin’s swing highs since its January 24 bottom have reached higher highs with each new top, while pullbacks managed to make higher lows as you can observe in Bitcoin’s current parallel-rising channel (see the chart below).
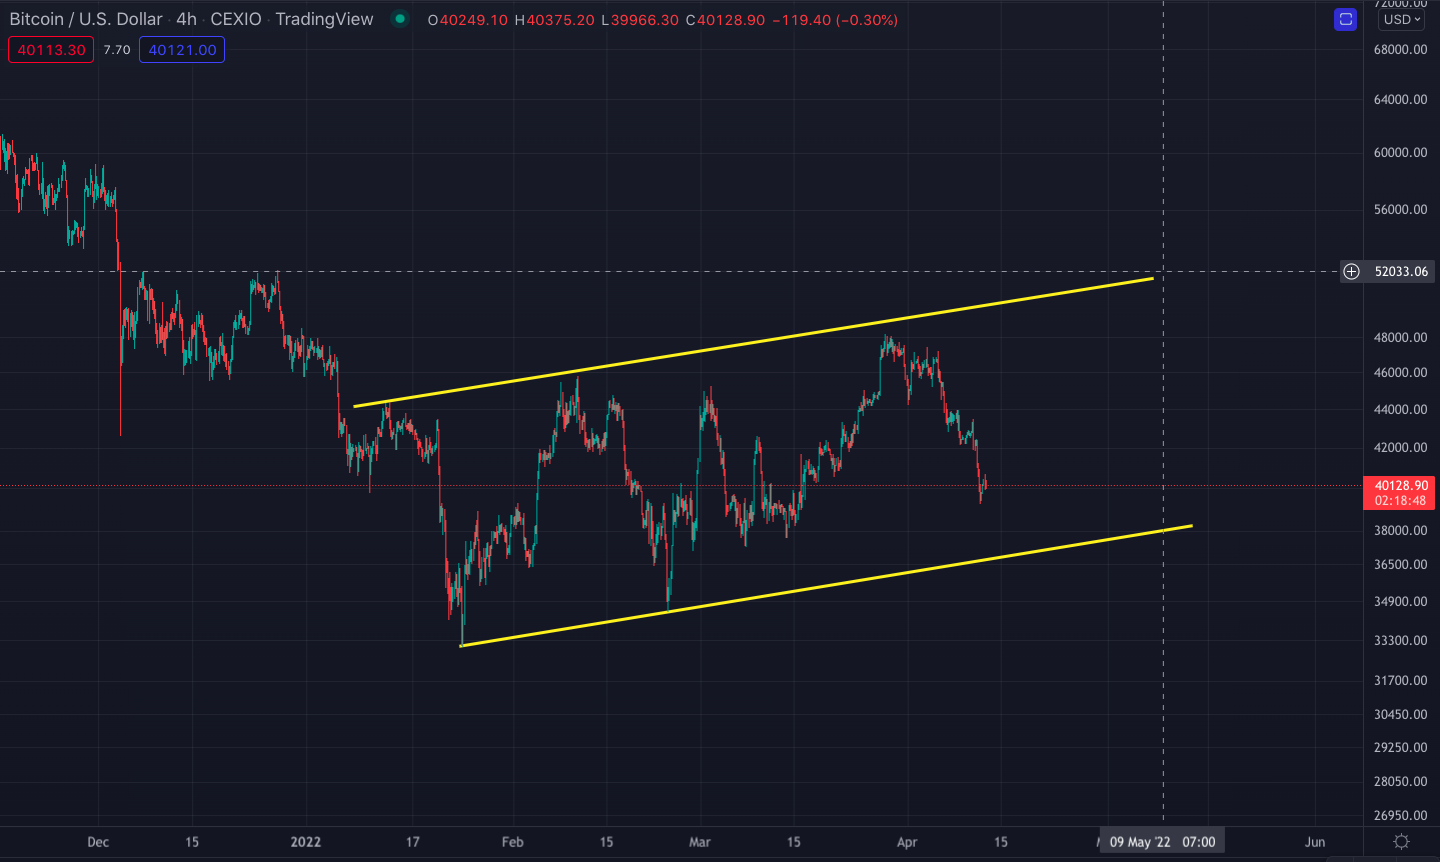
Bitcoin/U.S. Dollar price chart on a 4-hour timeframe with the parallel rising channel
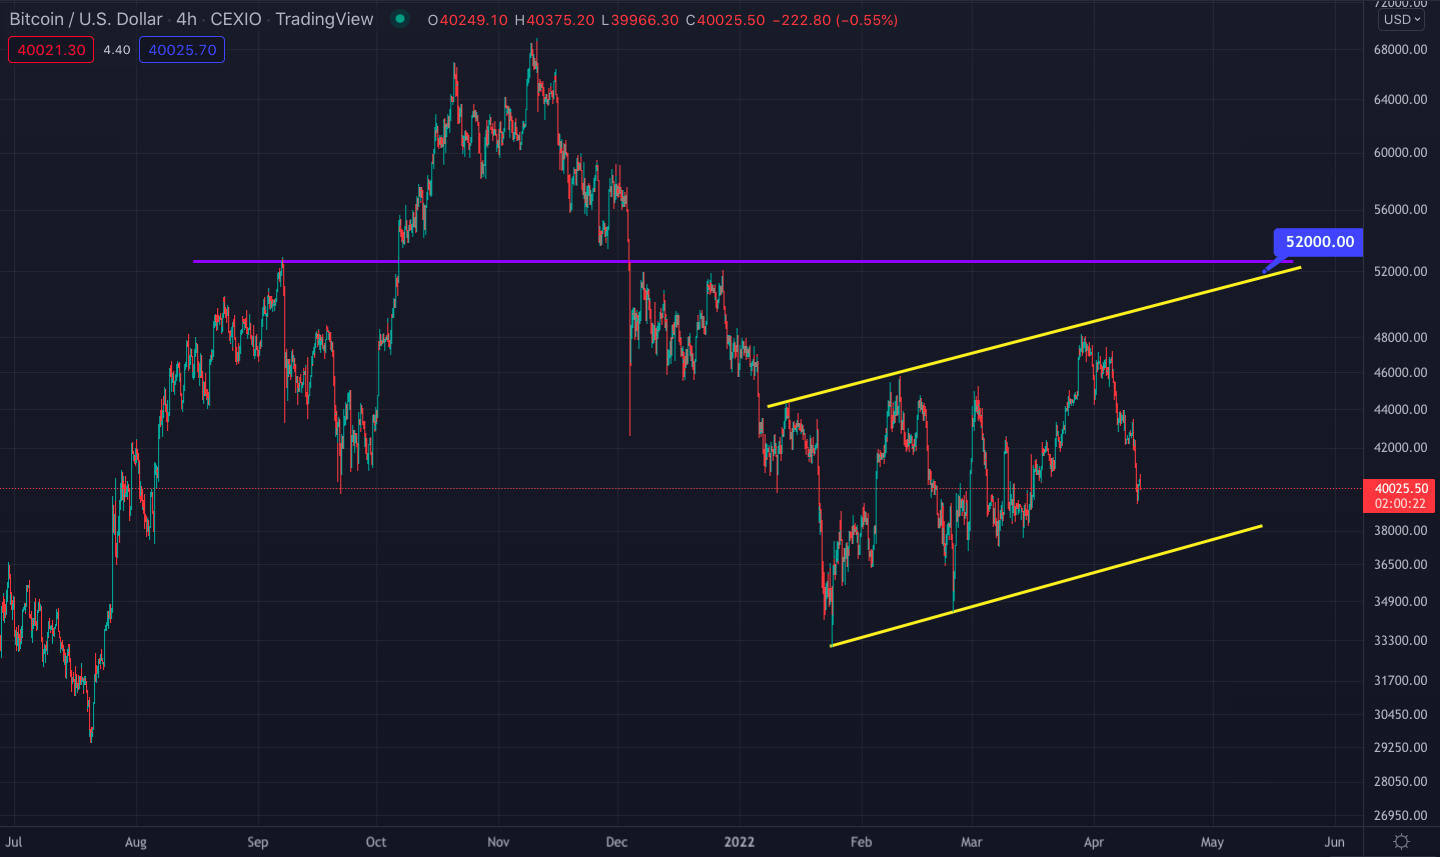
It would be much more bearish if Bitcoin made a double or triple top during its swing highs, instead of parallel-rising tops, because double or triple tops are highly bearish price formations during downtrends. This increases the likelihood that there will be one more swing high at around the $52,000 resistance. This is because there are usually three swing highs in parallel rising channels.
$52,000 corresponds to both the upper resistance of the rising channel and the horizontal resistance from the 2021 bull market (see the chart below).
- Weekly Stochastic RSI
Bitcoin’s weekly stochastic relative strength index (RSI) was rejected at 87 when Bitcoin hit its 200-day SMA resistance at $48,200 (the 200-day SMA is the yellow line in the chart below).
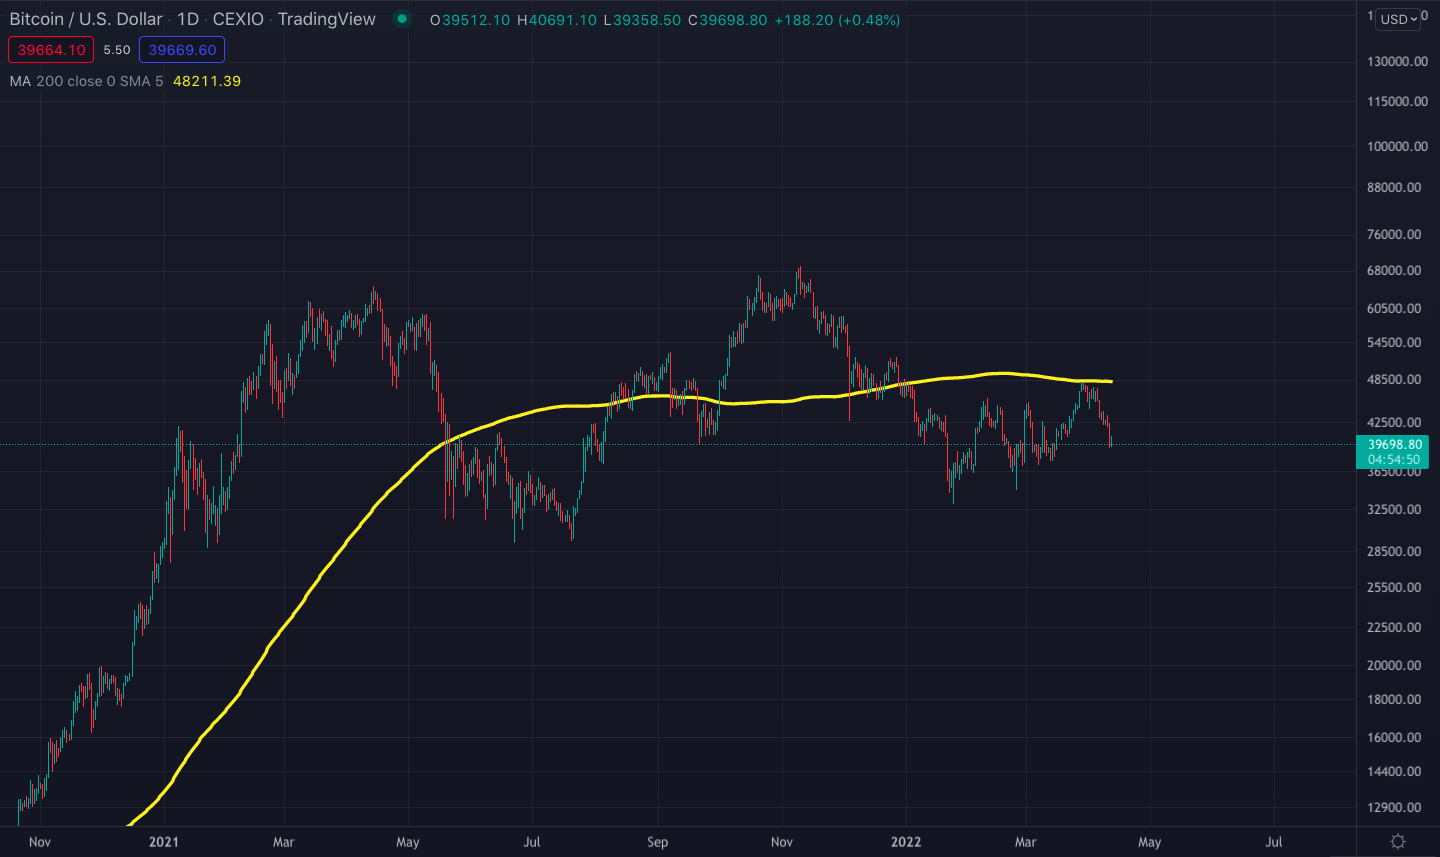
Bitcoin/U.S. Dollar daily price chart. The yellow line represents the 200-day SMA.
The weekly stochastic RSI looks poised to advance to the overbought 100 area as long as it holds 65 as support. Bitcoin usually makes its largest and quickest price spikes after its weekly stochastic hits 100, as you can see below.
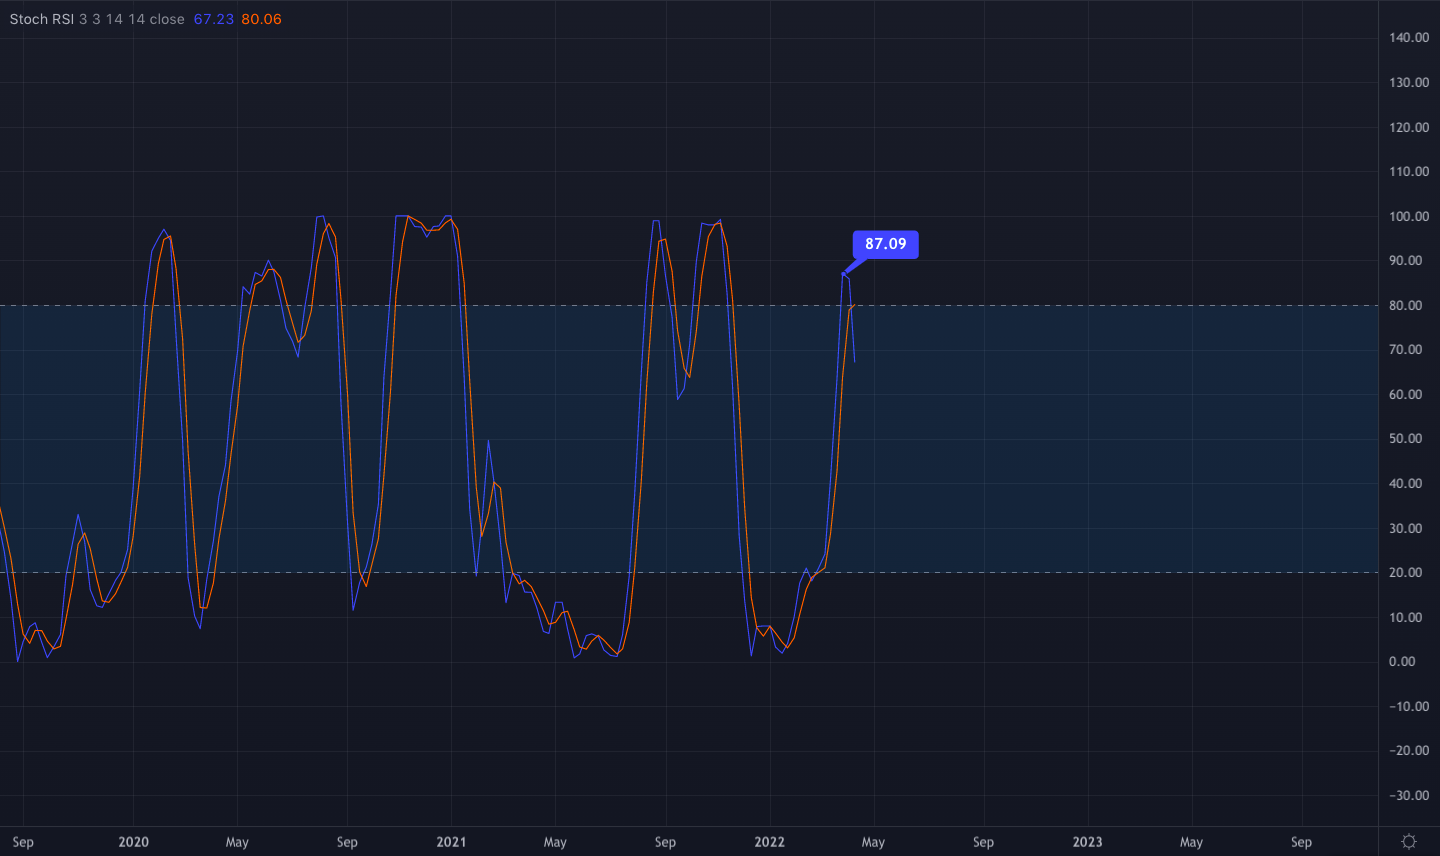
Bitcoin/U.S. Dollar weekly stochastic RSI chart
- 3-Day Death Cross
The 3-day death cross is getting closer and closer every day. This is the crossing down of the 3-day 50 SMA (the red line in the chart below) and overlapping the 200 SMA (yellow line).
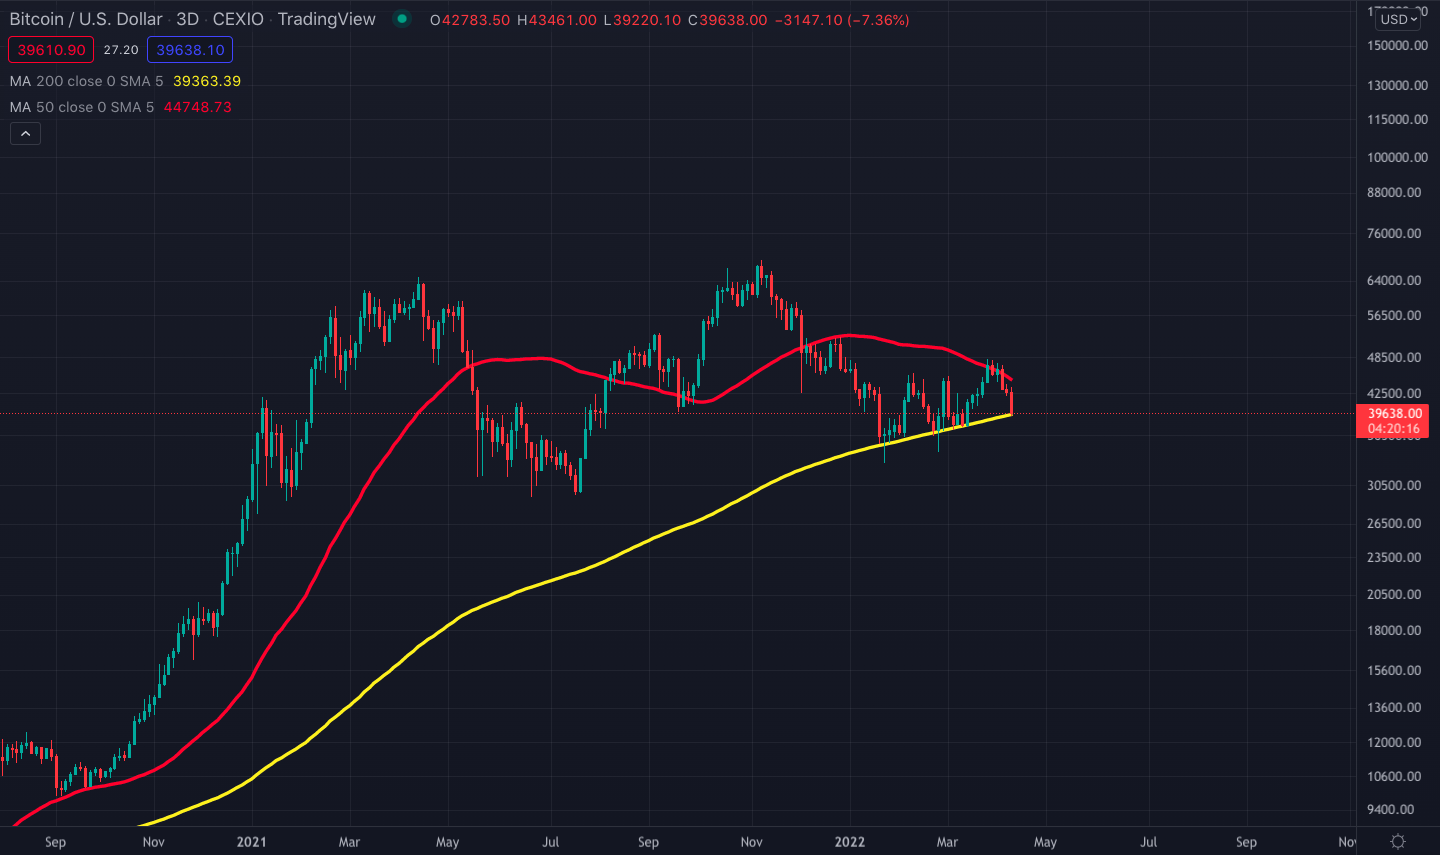
Bitcoin/U.S. Dollar 3-day price chart. The red line represents the 50 SMA and the yellow line represents the 200 SMA.
With Bitcoin’s recent pullback, the 3-day 50 SMA now acts as a resistance level. If Bitcoin makes a new swing high above $50,000, it will be very crucial for the alpha cryptocurrency to print a 3-day closing candle above this 50 SMA resistance (currently at $44,750). Otherwise, the swing high will be nothing but a “pump and dump” scheme to create exit liquidity for the market.
Considering the current angles of the 3-day 50 SMA and 200 SMA lines, the two lines are destined to cross each other by May 10 (see the chart below). If Bitcoin cannot make a new swing high and stay above the 50 SMA resistance by that date, troubles may be brewing for Bitcoin for a possible mega crash. This is because there has been a 3-day death cross for Bitcoin once every four years and all of the 3-day death crosses to date were followed by a 50% crash from their corresponding bear-market demand zone, which is currently at $40,000.
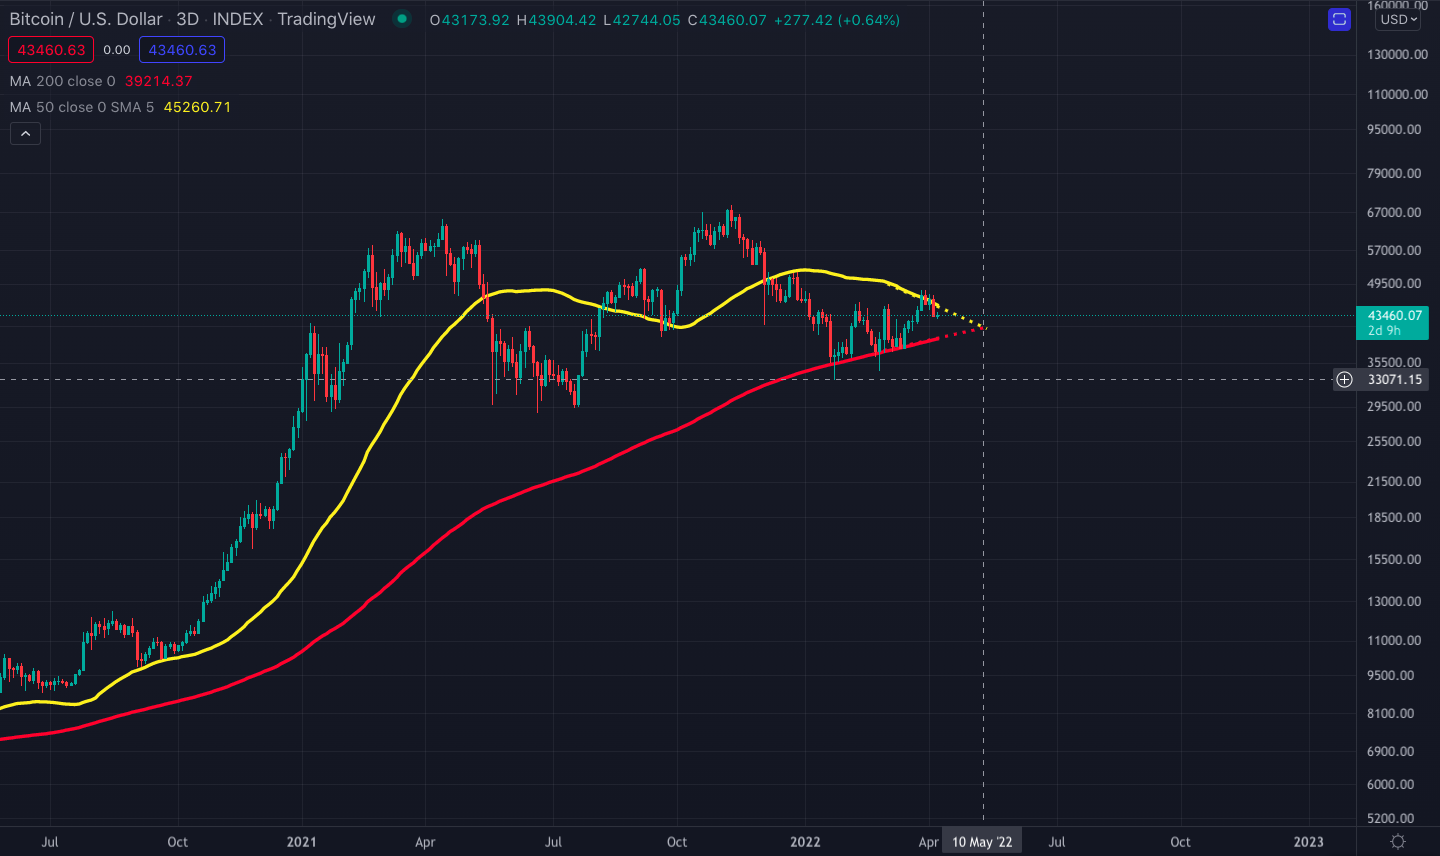
Bitcoin/U.S. Dollar 3-day price chart. The yellow line represents the 50 SMA and the red line represents the 200 SMA.
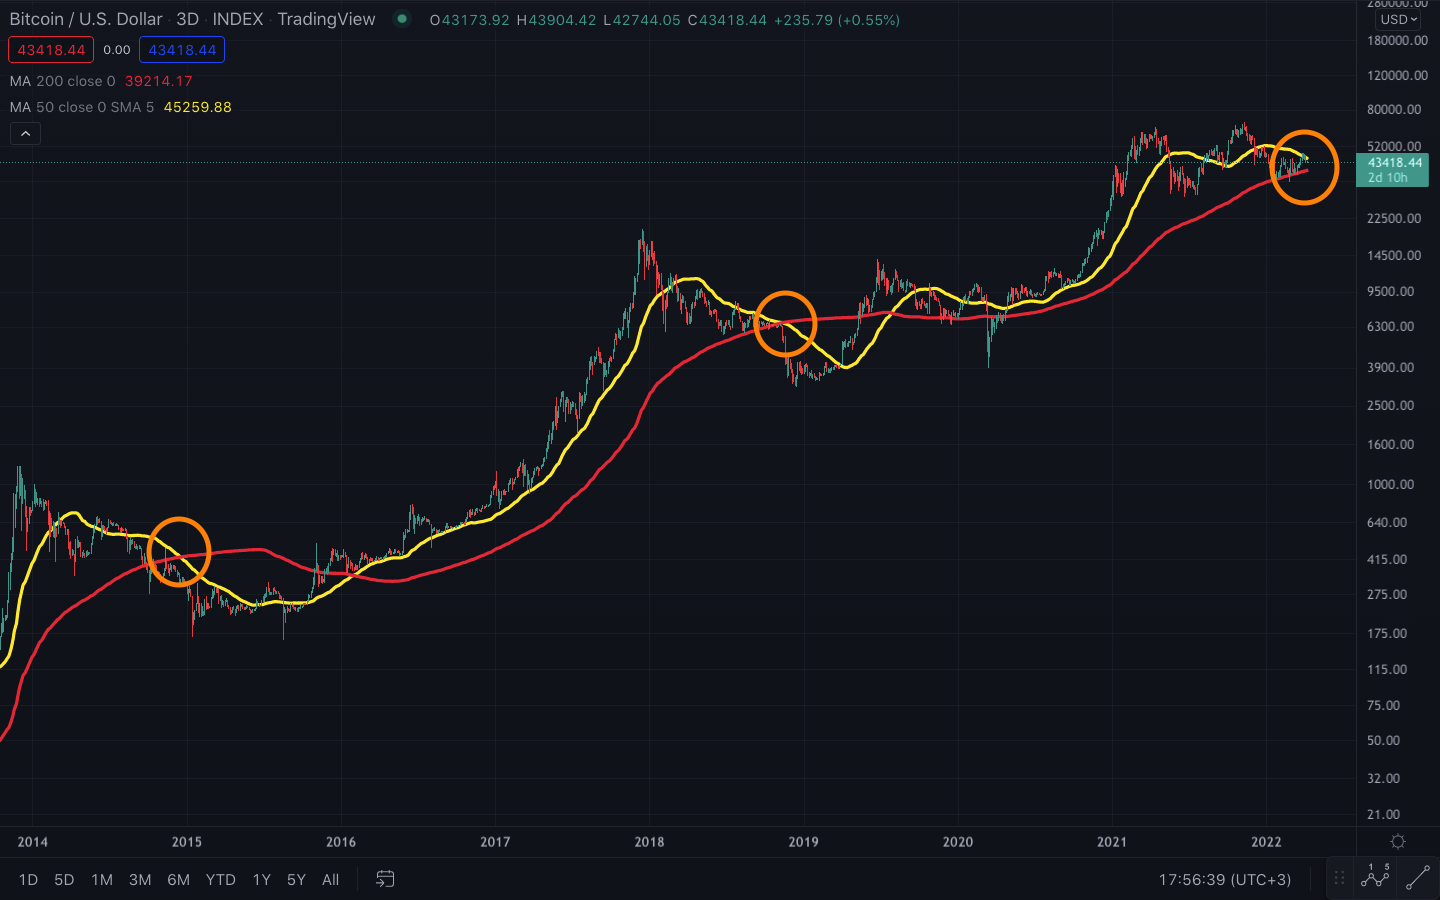
Historical 3-day death crosses on the Bitcoin/U.S. Dollar chart
ETHEREUM ANALYSIS
Price Overview
- Last 7-day change: -2.8%
- 7-day low: $2,957
- 7-day high: $3,310
- Last 30-day change: +18.9%
- 30-day low: $2,513
- 30-day high: $3,402
Ethereum Technical Analysis:
Ethereum’s price action has historically correlated to Bitcoin’s price action. Throughout the history of cryptocurrencies, Bitcoin has managed to drag Ethereum and other altcoins along with itself, either to the upside or to the downside.
The reason for this synchronized price action was that funds entering and exiting the cryptocurrency market initially flowed into Bitcoin, which then moved in and out of Ethereum and other altcoins. As a result, Bitcoin should not be having a downtrend for Ethereum’s price to be able to have an uptrend.
- 200-Day Moving Average
During downtrends and periods of uncertainty, funds sitting in cash are scared to flow into Ethereum and other altcoins in large quantities, this makes Ethereum very sensitive to the price action of Bitcoin. As we are in this stage of the cryptocurrency market now, Ethereum’s price almost perfectly mimics the price action of Bitcoin.
For example, Ethereum also hit its 200-day simple moving average (SMA) resistance at $3,570, albeit a week later than Bitcoin did on April 3. This is how the cryptocurrency market usually works. Bitcoin moves first and other major coins make the same types of movements within a couple of days or a week later.
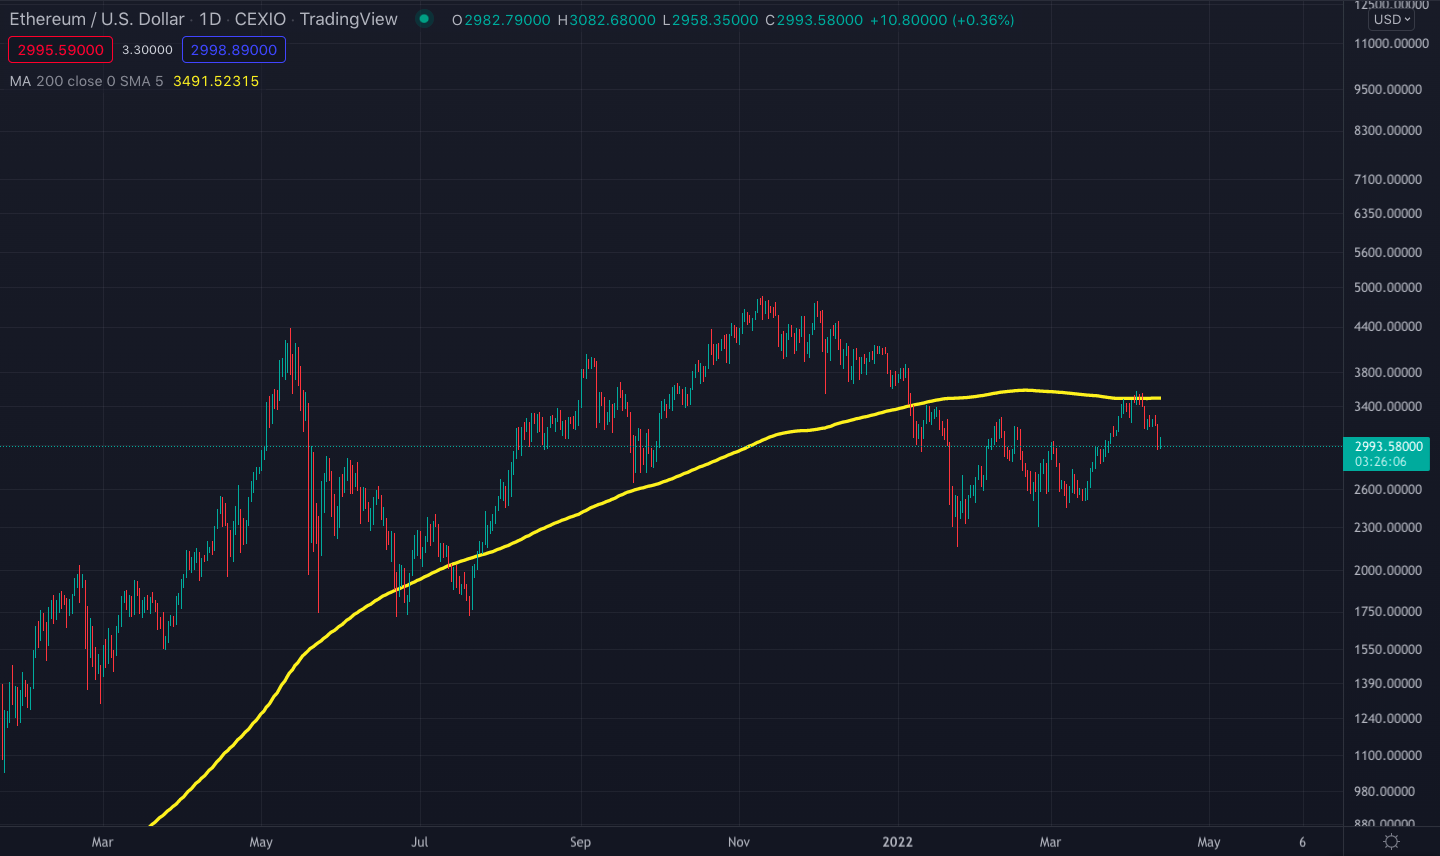
Ethereum/U.S. Dollar daily price chart. The yellow line represents the 200-day SMA.
- Symmetrical Triangle
In a slightly different way than Bitcoin, Ethereum has been following a symmetrical triangle, where the price hit the upper resistance of the triangle on the same day that it hit the 200-day SMA (April 3).
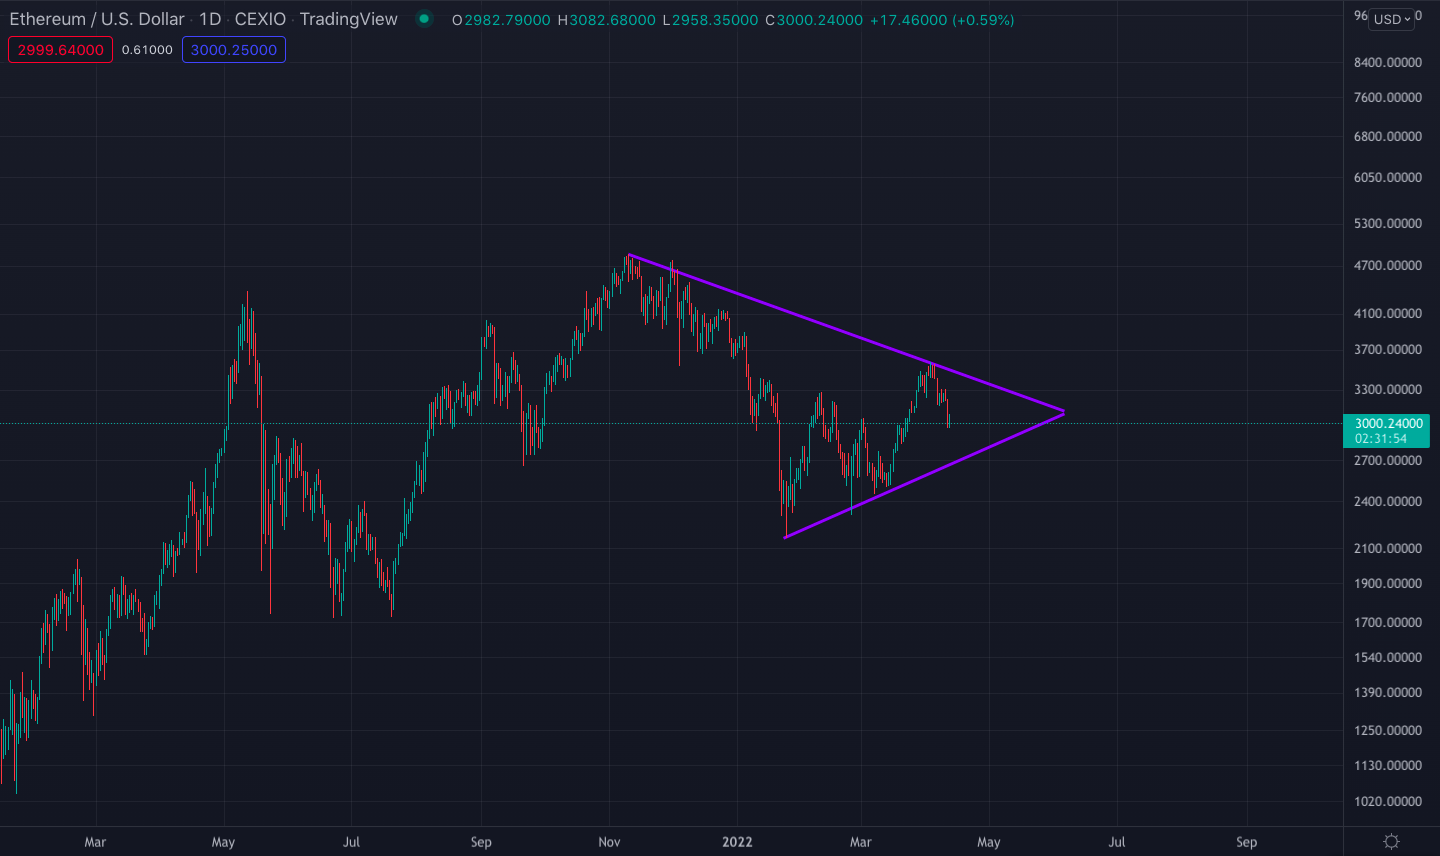
Ethereum/U.S. Dollar daily price chart with the symmetrical triangle.
After pulling back to the lower support of the symmetrical triangle at around $2,650, Ethereum may gain strength from there and break out of the triangle by climbing to the $4,100 resistance if Bitcoin does not break down from its current support levels.
- Ethereum/Bitcoin Parity
The ETH/BTC parity has been moving inside a rising channel since the May 2021 market top, making higher highs and higher lows. If Bitcoin can make a new swing high above $50,000, it is then likely for Ethereum/Bitcoin parity to climb towards the upper resistance of the rising channel, which currently passes around 0.10. This is a historical resistance level because it constitutes the lower end of Ethereum’s all-time high price channel against Bitcoin.
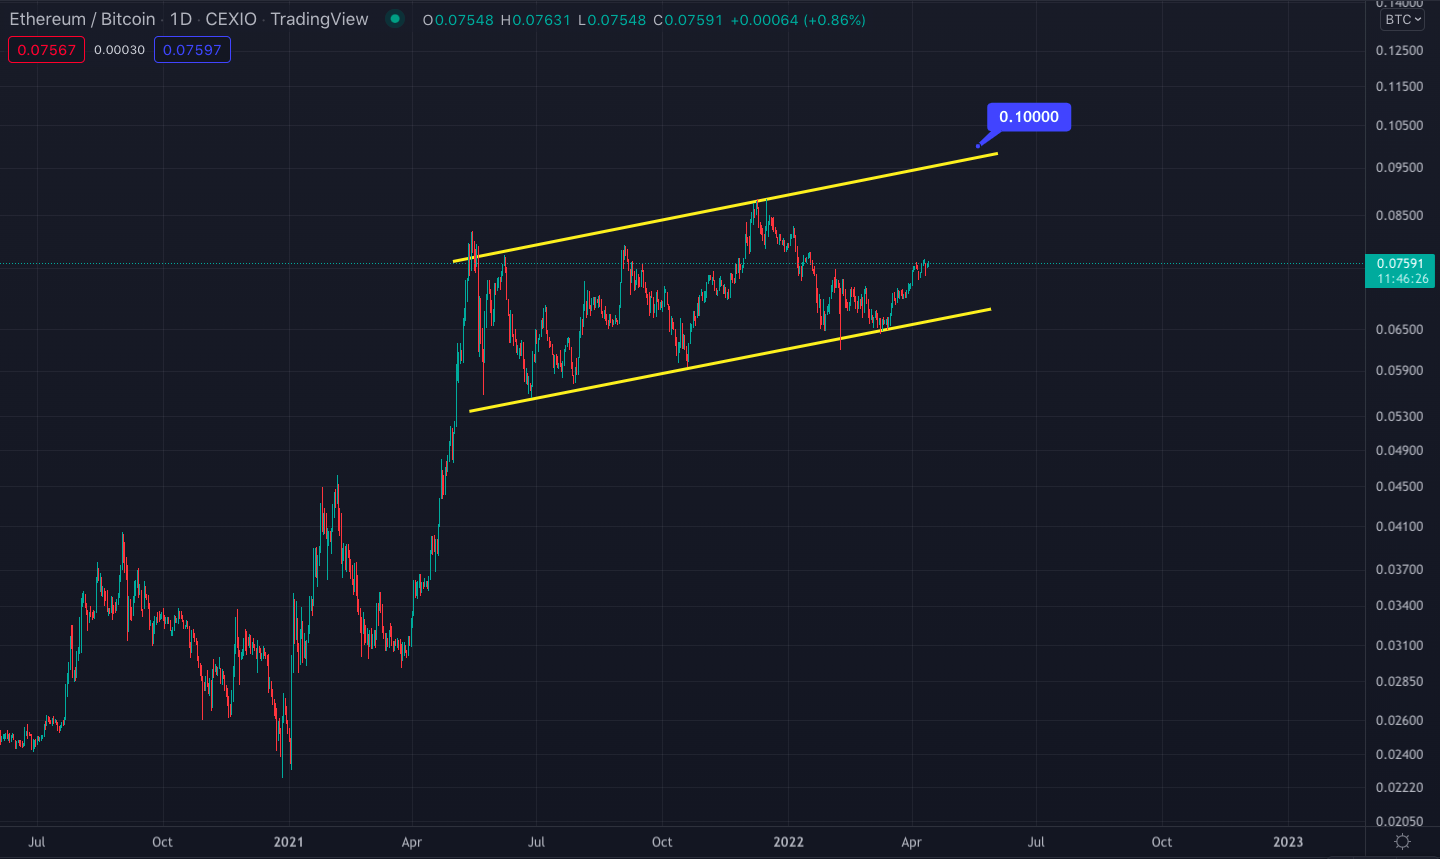
Ethereum/Bitcoin parity chart on a daily timeframe
ALTCOINS TO WATCH
- Serum (SRM) – Whales are accumulating Serum
Serum (SRM), the decentralized exchange on the Solana platform, has been the fourth most purchased token during the past 7 days, only after Ethereum, Tether, and USDC, according to Whalestats.
Three Arrows Capital, a leading cryptocurrency hedge fund, took the largest share in the SRM token purchase last week. The company has added about 66 million SRM tokens to its portfolio, worth over $167 million. Before the purchase, Three Arrows held over $194 million in SRM tokens.
- Terra (LUNA) – Terra buys $200 million of AVAX for its reserves
Terraform Labs (TFL) and the Luna Foundation Guard (LFG) have announced that they have purchased $200 million worth of Avalanche (AVAX) from the Avalanche Foundation.
TFL, the company behind Terra, swapped $100 million worth of Terra (LUNA) for AVAX while LFG, the foundation that buys reserves for Terra’s algorithmic stablecoin TerraUSD (UST), swapped its own holdings of UST to purchase an additional $100 million worth of AVAX from the Avalanche Foundation.
The purpose of these transactions is to reinforce the peg of Terra’s native stablecoin on the U.S. Dollar.
Do Kwon, the founder of Terra, told Bloomberg that LFG selected AVAX for its UST reserves because of its solid growth in its blockchain ecosystem as well as the stark loyalty of its users.
- XRP – Ripple gains a victory against the SEC
The judge on the Ripple Labs’ ongoing securities fraud case denied the Securities and Exchange Commission’s (SEC) motion to review documents that may not be related to the prosecution.
Back in 2020, the SEC filed suit against Ripple and its executives, Brad Garlinghouse and Christian Larsen, for selling unregistered securities. Since then, investor confidence in Ripple’s famous XRP has tanked. As a result, XRP was one of the weaker performers of the 2021 bull run.
During the hearing on April 11, Judge Sarah Netburn denied the SEC’s request to reconsider the shielding documents related to a June 2018 speech made by SEC’s then-director William Hinman. In the speech, Hinman stated that Bitcoin and Ethereum are not securities.
Although such a development would have brought serious buying activity in a normal market, the positive news did not affect the price of XRP at all. This is due to the ongoing instability of the crypto market. However, it could still be something to keep in mind moving forward.