The University of Michigan’s long-term inflation expectation survey settled back to 3.1% in June 2022, down from the 14-year high in May at 3.3%. The slight drop in long-term inflation expectation brought buying activity to stock markets following the announcement on June 23.
Cryptocurrencies followed suit where Bitcoin recorded an 8% increase and Ethereum recorded a 20% increase during the remainder of the week.
Since inflation tends to be lower during the summer months, a new leg down below the June 18 lows may not be on the horizon at least until fall 2022. If Bitcoin and Ethereum can consolidate around their current support levels for some time, the crypto market may be due for a summer rally unless actual inflation figures, bond yields, and stock markets dictate otherwise.
It has so far been encouraging for the price action to increase from the June 18 lows in gradual waves with higher lows, instead of immediate bounces that directly spike to the next resistance levels.
How things play out by the autumn in terms of the U.S. economy, ongoing commodity sanctions, and geopolitical risks in Europe will likely determine the long-term direction of the bond and stock markets, as well as the cryptocurrency market.
Bitcoin’s closing price this year can likely dictate its direction for the next few years as Bitcoin will print its first yearly bearish engulfing candle in history if it closes in 2022 below $29,000.
Bitcoin price analysis
Bitcoin may have bottomed for the short term considering some reversal signs that have appeared recently.
However, long-term signs and indicators remain bearish for Bitcoin.
Whatever happens throughout the rest of 2022, Bitcoin shall better close the year above $29,000. Otherwise, it will print its first-ever bearish engulfing candle on the yearly time frame, which may spell some trouble for the upcoming few years.
Short-term analysis
- Possible bear trap at $17,600
Bitcoin’s dropping below $20,000 to $17,600 after a four-day sideways consolidation between June 14 and 18 can play out as a bear trap because the price climbed back to the $20,000 support in only two days and has been consolidating at this level since then.
Bear traps usually happen at the end of a downtrend where the price is temporarily taken below key support ($20,000 in this case) to trick investors into believing that it will go much lower.
The price is then quickly taken back to the previous consolidation level where it further consolidates for some more time. This is what has exactly happened with the Bitcoin price action so far.
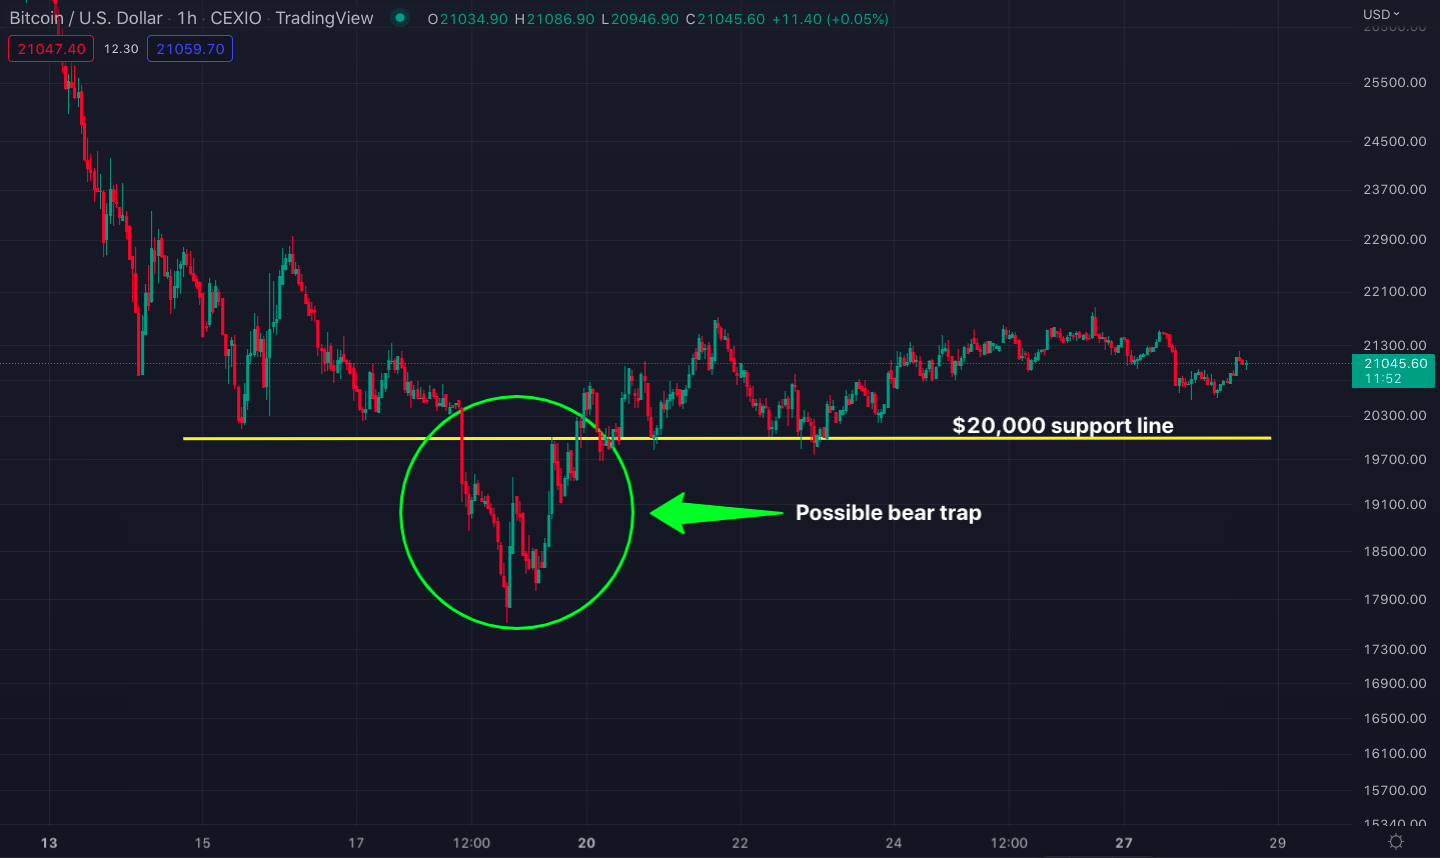
Bitcoin/U.S. Dollar price chart on a one-hour time frame. Source: Tradingview
- Bullish engulfing candle
On the daily price chart, Bitcoin recorded a bullish engulfing candle right next to the June 18 bottom candle. Bullish engulfing candles are typically reversal candles, which increase the likelihood of a possible bear trap.

Bitcoin/U.S. Dollar daily price chart with the bullish engulfing candle
- Five-wave advance to the local top
The climb from the $17,600 bottom to the $21,800 swing high as of June 21 was a five-wave advance instead of a sudden spike, which further increases the likelihood of a bear trap.
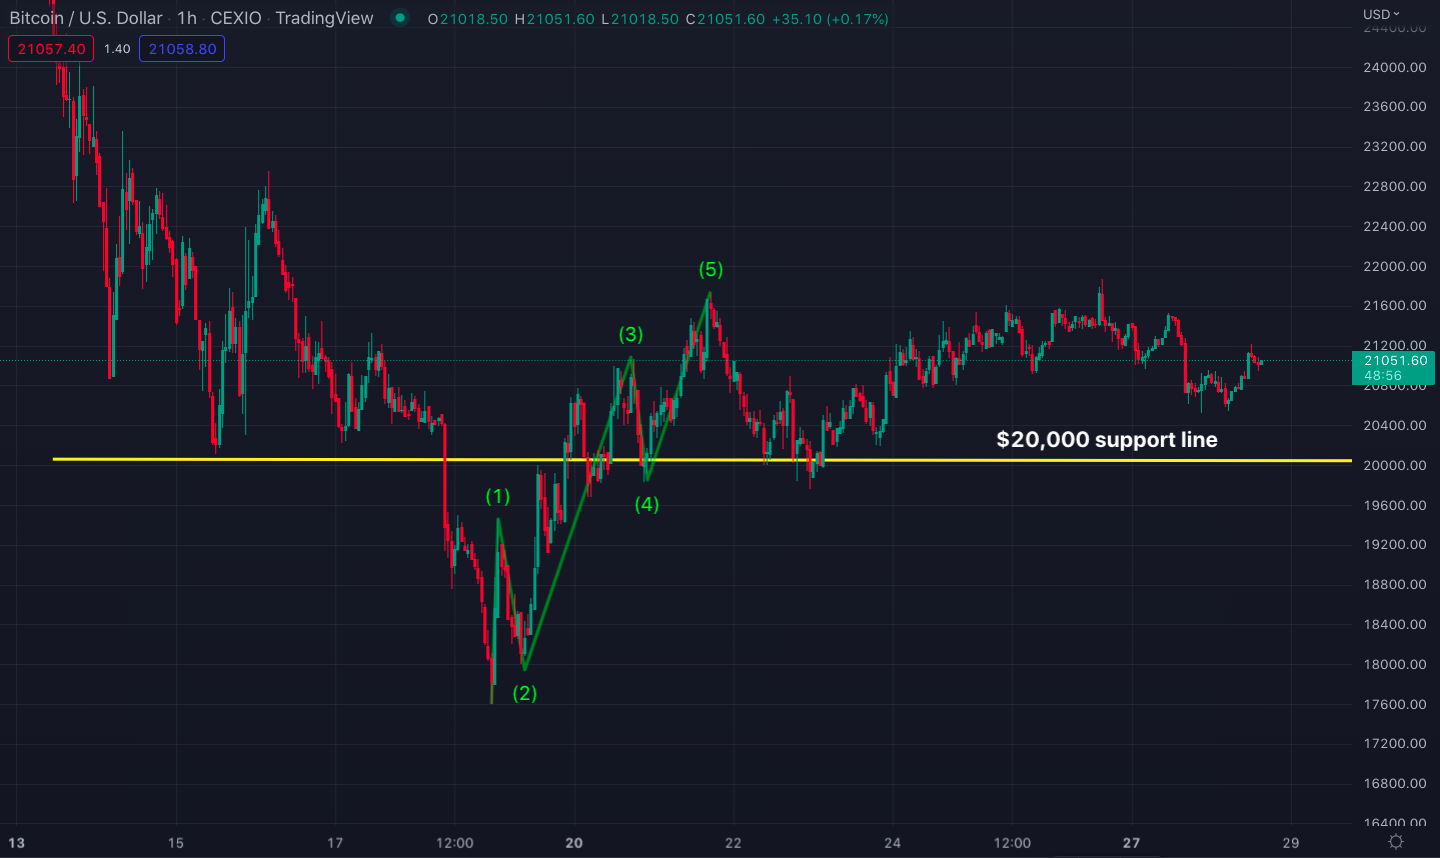
Bitcoin/U.S. Dollar chart with the five-wave advance from the June 18 bottom
- Possible inverse head and shoulders formation
Bitcoin’s five-wave advance from the local bottom, followed by the shallow retracement so far also increases the likelihood of an inverse head and shoulders formation. Inverse head and shoulders formation is a reversal pattern from the bottom.
If the bear trap plays out, we can see Bitcoin breaking out of this inverse head and shoulders pattern in the upcoming days, where $22,000 can act as the diagonal neckline:

Bitcoin/U.S. Dollar chart with the ongoing inverse head and shoulders formation
Based on the above chart, if $22,000 plays out as a diagonal neckline, $19,000 is a possible retracement level that could constitute the right shoulder of the inverse head and shoulders pattern.
What is necessary for the formation to play out is that trade volume on the right shoulder needs to be higher compared to the volume on the left shoulder.
$19,000 will likely be the final stop for Bitcoin to start an uptrend in the upcoming days. If Bitcoin somehow loses this level during July, it may be the harbinger for further adverse developments up in the hierarchy, such as new-record U.S. inflation rates and the accompanied interest rate hikes.
Long-term analysis
- 200-week simple moving average
Bitcoin price closed below the 200-week simple moving average (SMA) for the second week in a row. This has never happened before in Bitcoin’s history. Until the week of June 27, Bitcoin closed below the 200-week SMA only once (in March 2020) and climbed above this critical support within the following week.

Bitcoin/U.S. Dollar all-time history chart with the 200-week SMA (yellow line)
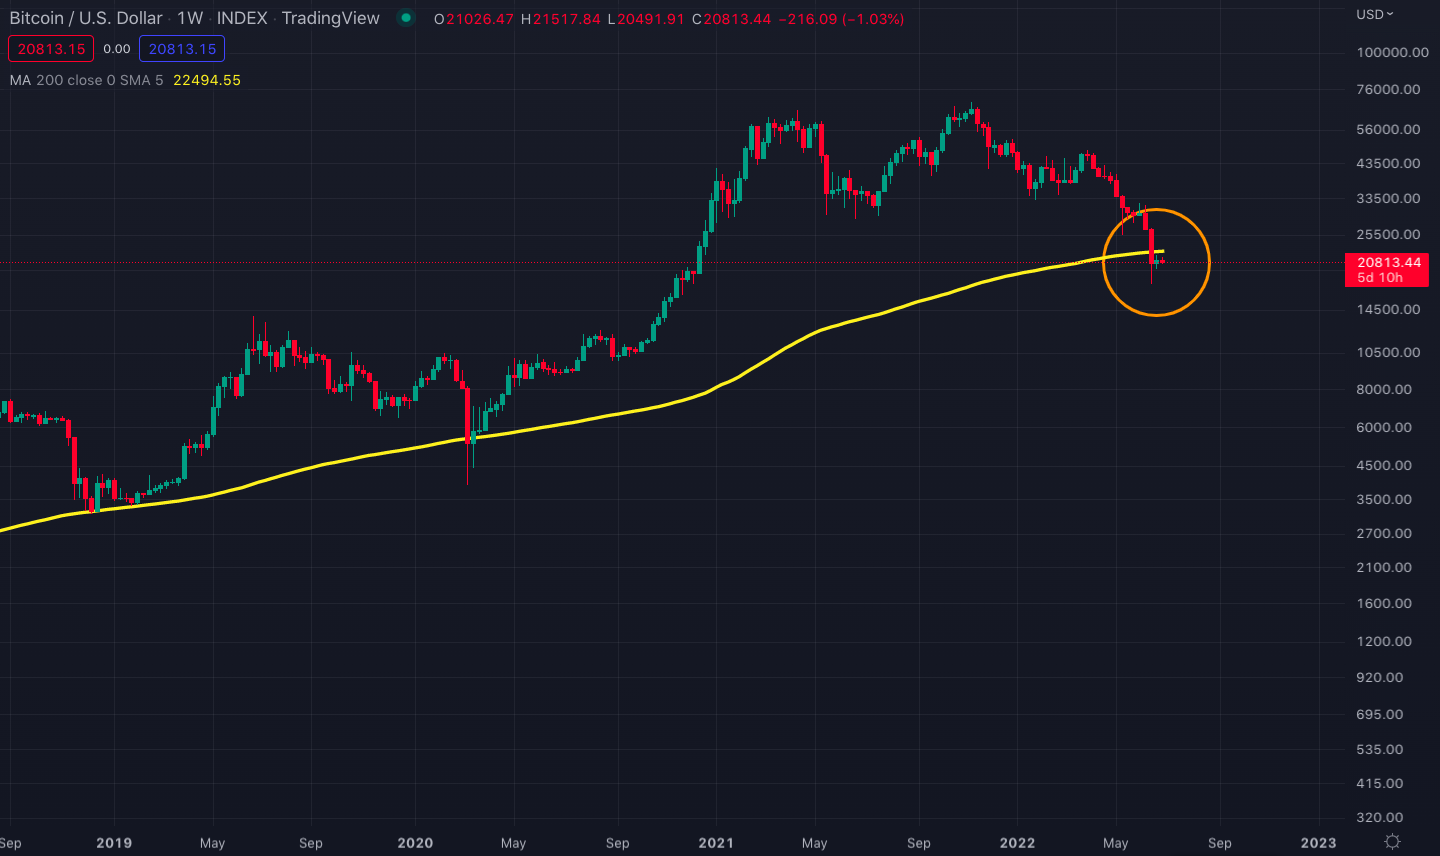
Bitcoin’s closing below 200-week SMA two times in a row
A potential rally can put Bitcoin back above the 200-week SMA but it may not mark the absolute market bottom this time. Although the 200-week moving average has always been treated as Bitcoin’s absolute market cycle bottom indicator, the fact that so many people in the media talk about this weekly moving average right now can potentially undermine its significance going forward.
- 6-month bearish engulfing candle
Bitcoin is about to print its first-ever bearish engulfing candle in a six-month time frame (circled in orange in the below chart). Closings on large time frames such as the monthly, quarterly, semi-annually, and yearly can have a lot of significance in determining the absolute market tops and bottoms.
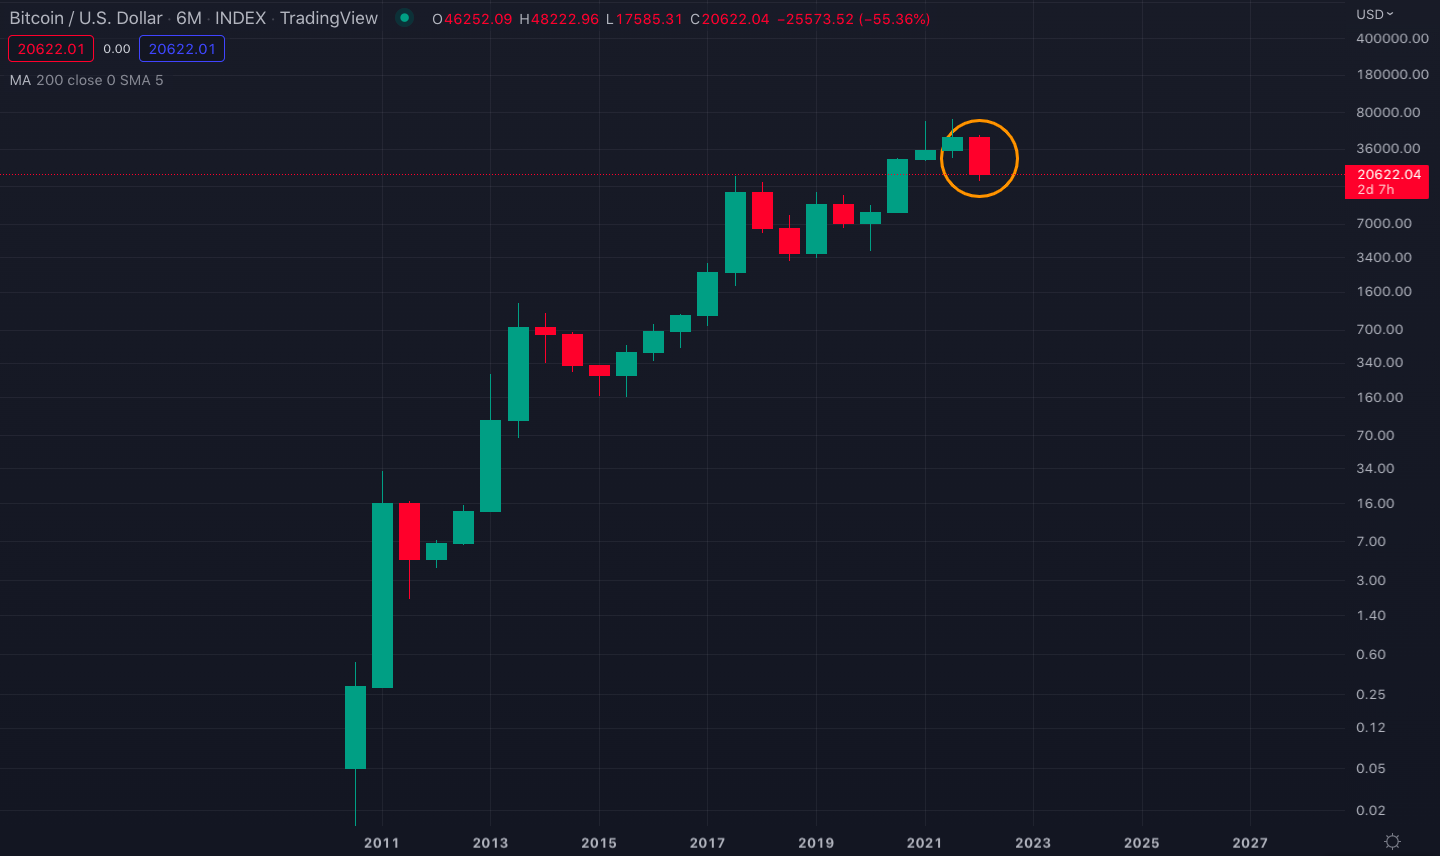
Bitcoin bearish engulfing candle on the 6-month price chart
Considering this, if Bitcoin prints a bearish engulfing six-month candle by the end of June, it should be treated as a yellow flag meaning that $17,600 may not be the long-term bottom.
And if Bitcoin completes 2022 with a yearly bearish engulfing candle (closing below $29,000), then that candle may be interpreted as a red flag regarding the market bottom price.
- All-time low monthly RSI
As of June 2022, Bitcoin recorded its all-time low monthly relative strength index (RSI) value (circled in orange in the below chart). Long-term momentum indicators are known to precede the price action so the monthly RSI’s breaking down the long-term 44 support may indicate further downside in the Bitcoin price over the coming months.
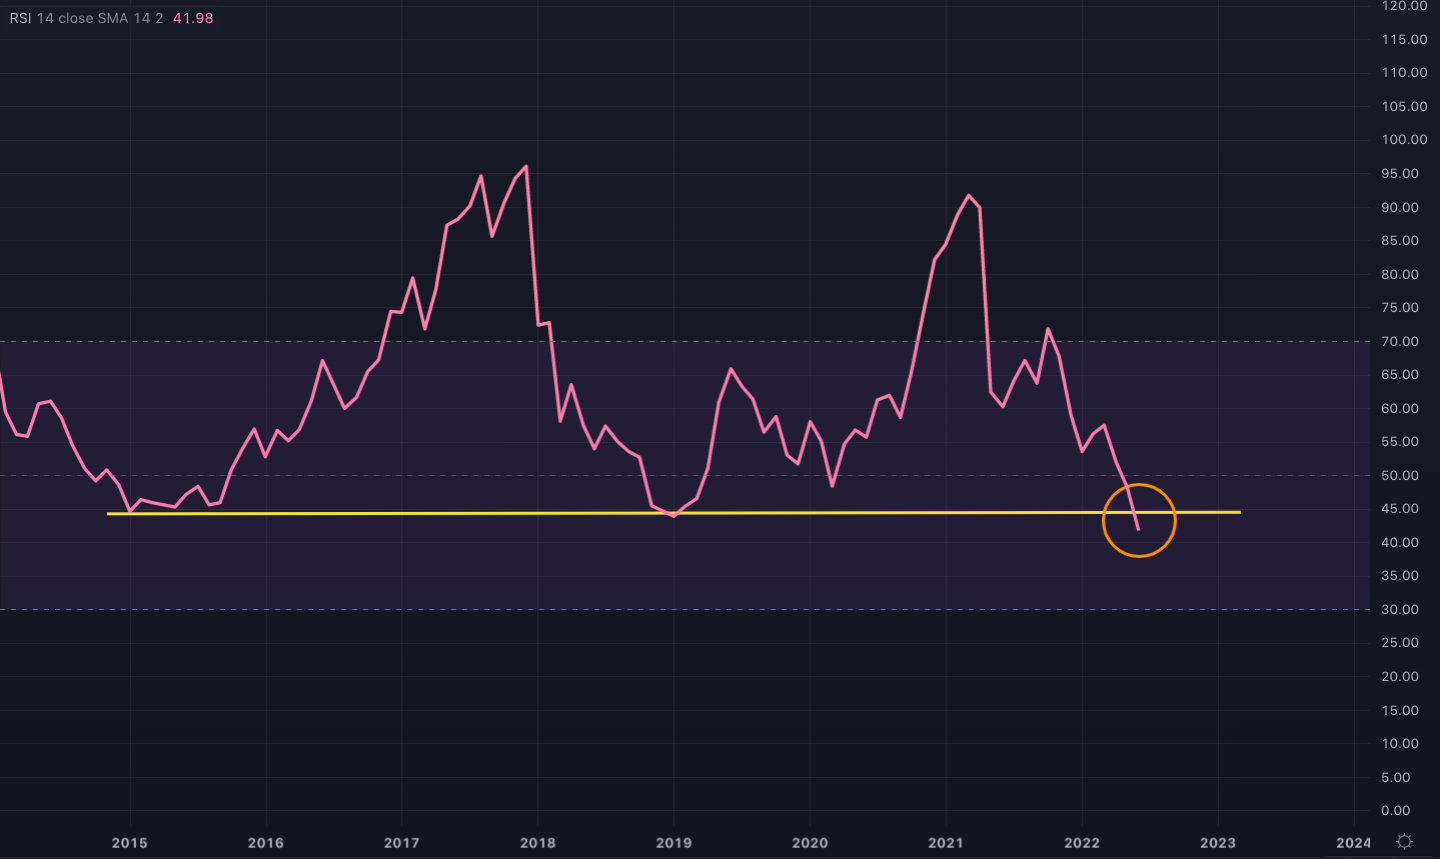
Bitcoin RSI chart on the monthly time frame
- Logarithmic growth curve about to become void
Another alarming long-term signal is produced by the Bitcoin logarithmic curve chart. Throughout its 12-year history, Bitcoin has perfectly followed the below logarithmic growth curve, where it consistently created cycle tops at the top of the curve and made market bottoms at the bottom of the curve.
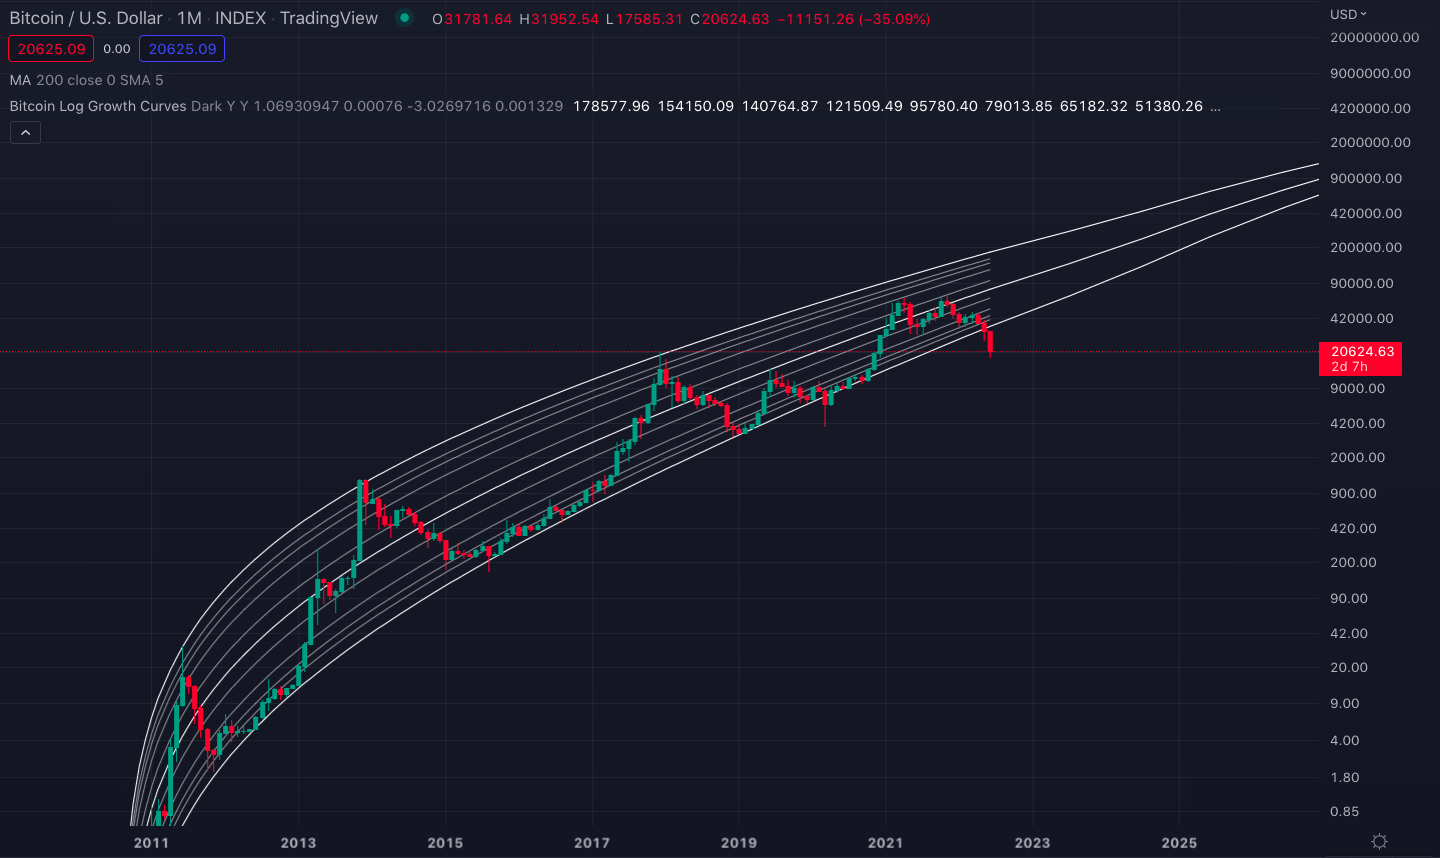
Bitcoin logarithmic growth curve on the monthly price chart
As of June 2022, Bitcoin is recording a monthly candle close below the logarithmic curve for the first time in history (see the chart above).
Invalidating the curve may take Bitcoin to unknown waters, as it will be left without any reference channel to grow through. Unless the price climbs back into the curve by July, where and how it ends up on the chart will likely be uncertain for everyone.
What is more concerning is that Bitcoin is also recording a six-month candle by the end of June, not just any monthly candle. As discussed, a bearish candle on very large time frames has way more significance in determining the long-term direction, which would in this case decrease the likelihood of the price climbing back into the logarithmic growth curve.
Bitcoin dominance
Bitcoin dominance is the ratio of Bitcoin’s market capitalization against the total cryptocurrency market value.
Following the Luna/UST collapse in May, Bitcoin dominance started to increase as many people have grown skeptical about their altcoin investments and decided to reduce their exposures. Due to this, although the Bitcoin price has been dropping as well, altcoin prices fell more until June 13 when the Bitcoin dominance topped at 48%.
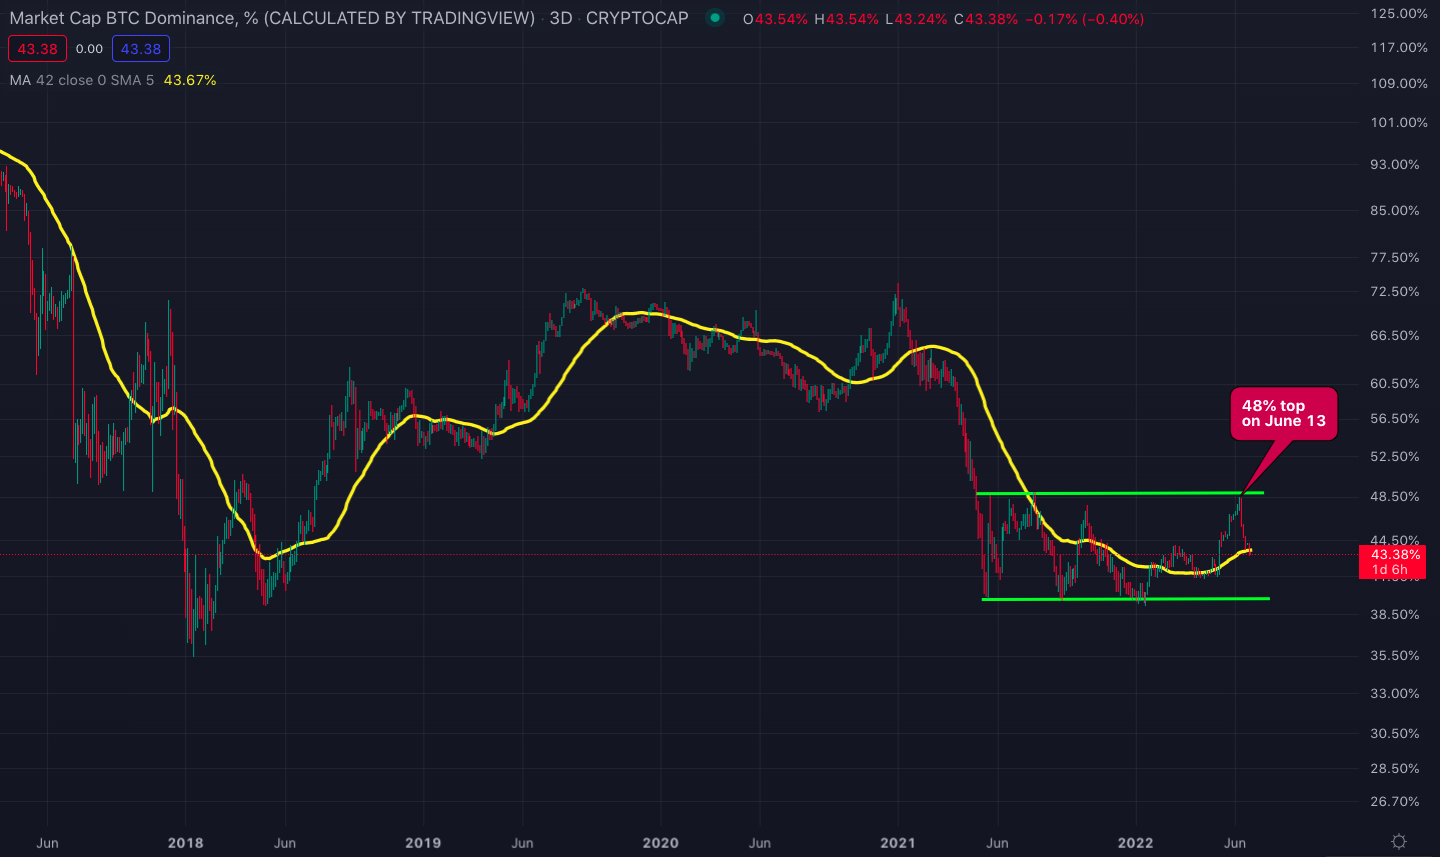
Bitcoin dominance on the 3-day chart
Dominance touched a major moving average support now. If the ratio can hold the support throughout the next month, it can resume the uptrend that started in early 2022 (at 39%).
A decisive close above the current horizontal channel (above 50%) would be a huge positive for Bitcoin. However, in that case, Ethereum and other altcoin prices will get adversely affected since Bitcoin’s rise would be triggered by the funds flowing out of altcoins. The dollar prices may still increase but overall returns would likely be lower compared to Bitcoin.
When you invert the Bitcoin dominance chart, it looks like a textbook rising channel. Rising channels often break to the downside. Although the dominance ratio has climbed back into the channel after wicking below it, the June candle will likely fail to record an engulfing candle. This would suggest the drop from 48% to 43% is a fakeout, one last correction before decisively breaking out of the channel.

Inverted monthly Bitcoin dominance chart
Crypto industry updates
Celsius lawyers advocating for Chapter 11 bankruptcy
Only two days after Goldman Sachs announced that it seeks to raise $2 billion from investors to buy Celsius assets at a discount, news hit the market that the troubled crypto lender’s lawyers are advocating for Chapter 11 bankruptcy.
Celsius is a decentralized lending and borrowing platform, similar to the industry leader Aave, and holds more than $10 billion of client assets.
Due to the cratering of crypto assets in recent weeks, there have been too many loan liquidations on the platform (due to the crash in the value of crypto collaterals) and Celsius suddenly found itself unable to honor its obligations, which consist of user deposits.
Following Bitcoin’s dropping below $28,000 on June 12, Celsius suspended client withdrawals. This created pandemonium for the CEL token, the native cryptocurrency of the Celsius platform. CEL dropped from $0.70 on June 9 to as low as $0.15 on June 13. Although the price has managed to rebound back to the $0.70 level since then, the future of customer funds remains bleak.
Chapter 11 of the US Bankruptcy Code allows a company to continue operating while it works out its debts. If Celsius enters bankruptcy protection, client positions will be sold into US dollars at the current market price and clients will be added to the list of the firm’s creditors.
And this is where Goldman Sachs plans to step in by buying the client positions at a huge discount (paying $2 billion for the formerly $10 billion worth of funds).
In contrast to the company’s lawyers, the Celsius management is not willing to file a Chapter 11 bankruptcy. They believe that avoiding bankruptcy will result in more value for account holders in the long run as they expect the cryptocurrency market to eventually recover so they try to win some time by promoting this idea to their investors.
If Celsius eventually chooses to file bankruptcy, the use case for the CEL token could disappear entirely since the platform would cease operations and the token would run out of utility.
On the contrary, if the management could win the time they need until the market recovers, then the token might preserve its utility.
Voyager issues default notice against 3AC
Voyager Digital, one of the biggest crypto hedge funds offering up to 12% rewards defaulted on a loan as of June 27.
The company issued a default notice against Three Arrows Capital (3AC) for failure to pay the loan. The loan value is at around $650 million and consists of two tranches:
- 350 million USDC stablecoins
- 15,250 bitcoins (currently worth $305 million)
Unlike Celsius, Voyager stated that it continues to operate and fulfill customer orders and withdrawals. In addition, Alameda Research has extended a $75 million credit line for Voyager Digital and committed to increasing the amount as needed.
On the other hand, how 3AC will tackle this new challenge in addition to its already illiquid situation remains to be seen.
Crypto product/altcoin updates
Uniswap Labs acquires Genie
Uniswap Labs, the developer of the crypto industry’s largest decentralized exchange (Uniswap) announced its acquisition of the NFT marketplace aggregator, Genie.
Although Uniswap is the largest decentralized exchange with a locked value of over $4.77 billion, the DeFi field has generally failed to gain mainstream adoption so far due to technical barriers, complex dynamics, and difficult user experiences.
This situation reflected itself in the valuation of DeFi products and platforms. Following the DeFi boom in 2020 and early 2021, the price of UNI, Uniswap’s governance token peaked at $45 in May 2021 and has been dropping ever since then. It fell to a low of $3.5 on June 18, 2022.
Uniswap seeks to regain traction for its platform and increase transaction volume by integrating an NFT marketplace as NFTs have comparatively been much more successful in gaining mainstream adoption.
The acquisition of Genie, a leading NFT marketplace aggregator could facilitate a new kind of NFT that does not only rely on rarity factors and exclusivity but also on actual financial utility as Genie gets integrated with Uniswap’s DeFi capability.
Uniswap’s newfound potential to go mainstream with NFT products was met with enthusiasm, which manifested itself in the governance token’s recent price action. After making the $3.5 low on June 18, the price of UNI has climbed to as high as $6 following the acquisition announcement on June 20.
Axie Infinity reopens the Ronin bridge
Axie Infinity, 2021’s phenomenal play-to-earn game, reopens the Ronin sidechain bridge that became the target of a $600 million exploit back in March 2022.
The Ronin blockchain allowed Axie Infinity players to transact with very low fees while playing the game, compared to using the Ethereum blockchain. Ronin was unavailable for Axie players since March due to which Ethereum has been the default network to play the game.
Since it is usually quite expensive to transact on Ethereum, the lack of a cheaper alternative took a big toll on the gaming volume and the price of Axie’s governance token, AXS. The price of AXS fell from $75 on March 25 to a low of $12 on June 18.
For Axie Infinity players, the Ronin development team stated in a Twitter post that the sidechain bridge for the popular blockchain game will reopen on June 28 with all user funds returned.
The return of low transaction fees, along with the hacked user funds, may bring a portion of the former astronomical gaming volumes back to the Axie Infinity ecosystem.
Lido DAO votes on limiting Ethereum staking
Lido token (LDO) holders are having a vote about reducing the Lido protocol’s Ethereum staking dominance on Ethereum’s new Beacon chain.
Lido DAO currently holds a third of all Ether tokens staked on the Ethereum 2.0 staking pool.
The voting decision was triggered by centralization concerns. Industry experts and critics argue that Lido’s dominance in the ETH2 staking pool could pose a security risk to Ethereum after it transitions from proof of work to proof of stake.