Every week, CEX.IO takes a deep dive into the cryptocurrency ecosystem. In the 27th edition of the Crypto Ecosystem Update, we explore the price action and on-chain activity for Bitcoin. Additionally, we provide a concise review of important developments that could impact the ecosystem in the weeks or months ahead.
Read along for insight on the latest DeFi developments, explore in-depth price analyses, and enjoy reviews for correlated markets to help you make the most informed decisions along your crypto journey.
Bitcoin still inside the channel
In July, the U.S. consumer price index (CPI) dropped for the first time since 2020, due to slumping energy prices (from 9.1% in June to 8.5% in July). The inflation announcement on August 10 brought along a positive market movement, pushing the price of Bitcoin up to $25,000 by the next trading day.
However, it is interesting to see that Bitcoin still did not break out of its two-month-old rising channel since the announcement. On the contrary, the S&P 500 index, the asset class that Bitcoin has been most closely correlated with, was able to rise with significantly stronger momentum.
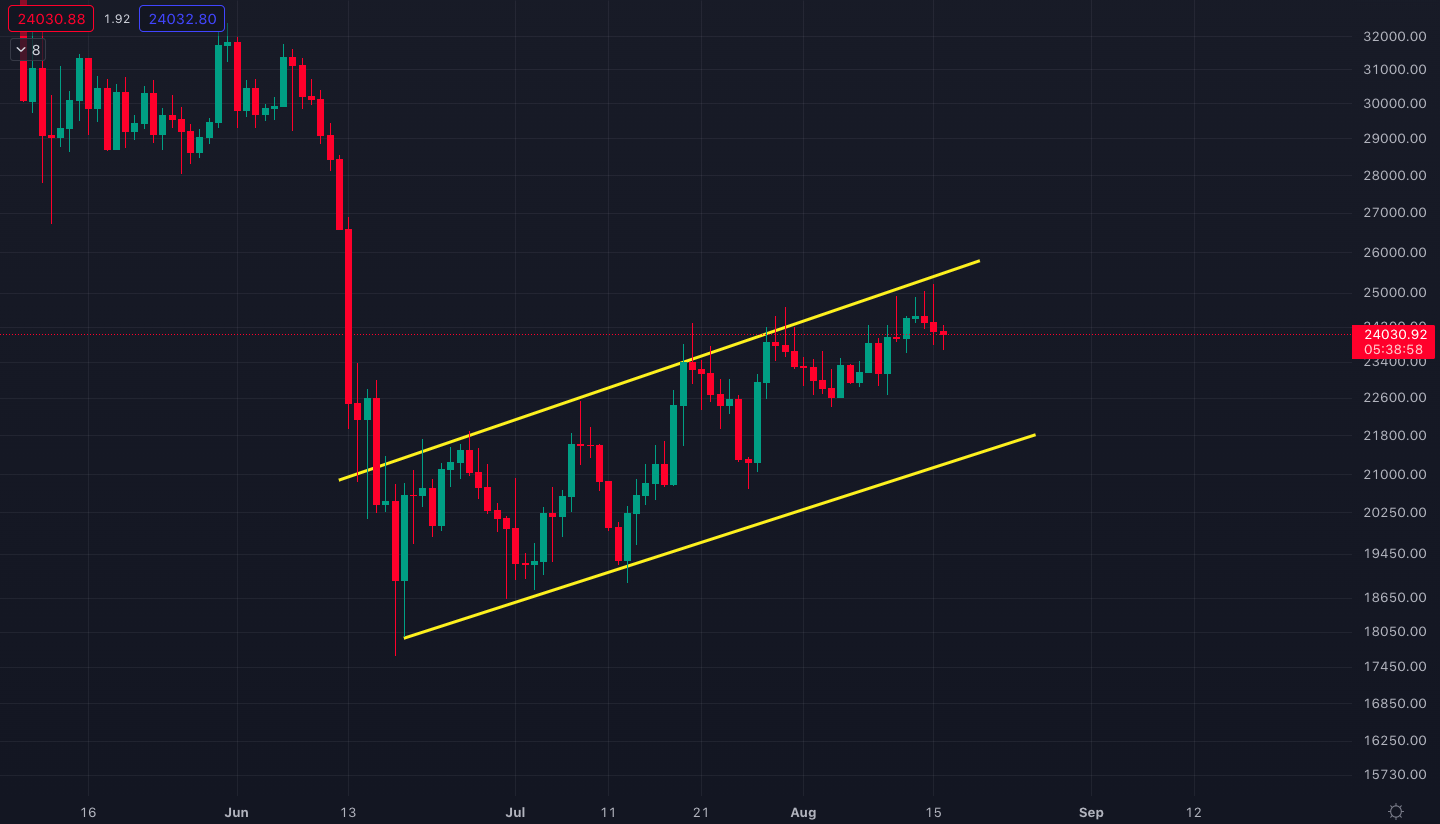
Bitcoin/U.S. Dollar price chart with the parallel rising channel. Source: Tradingview
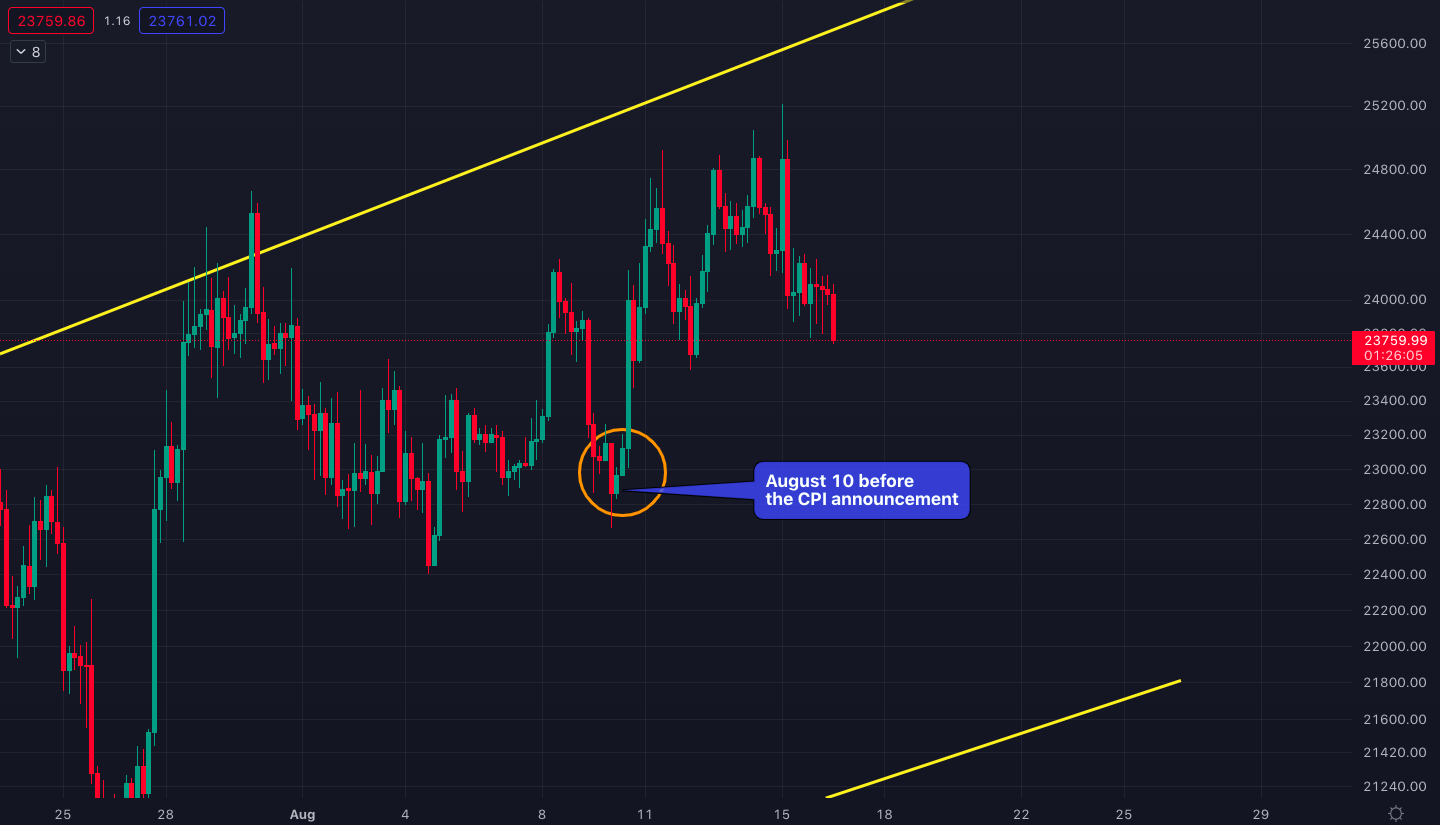
Bitcoin/U.S. Dollar price chart in 4-hour candles
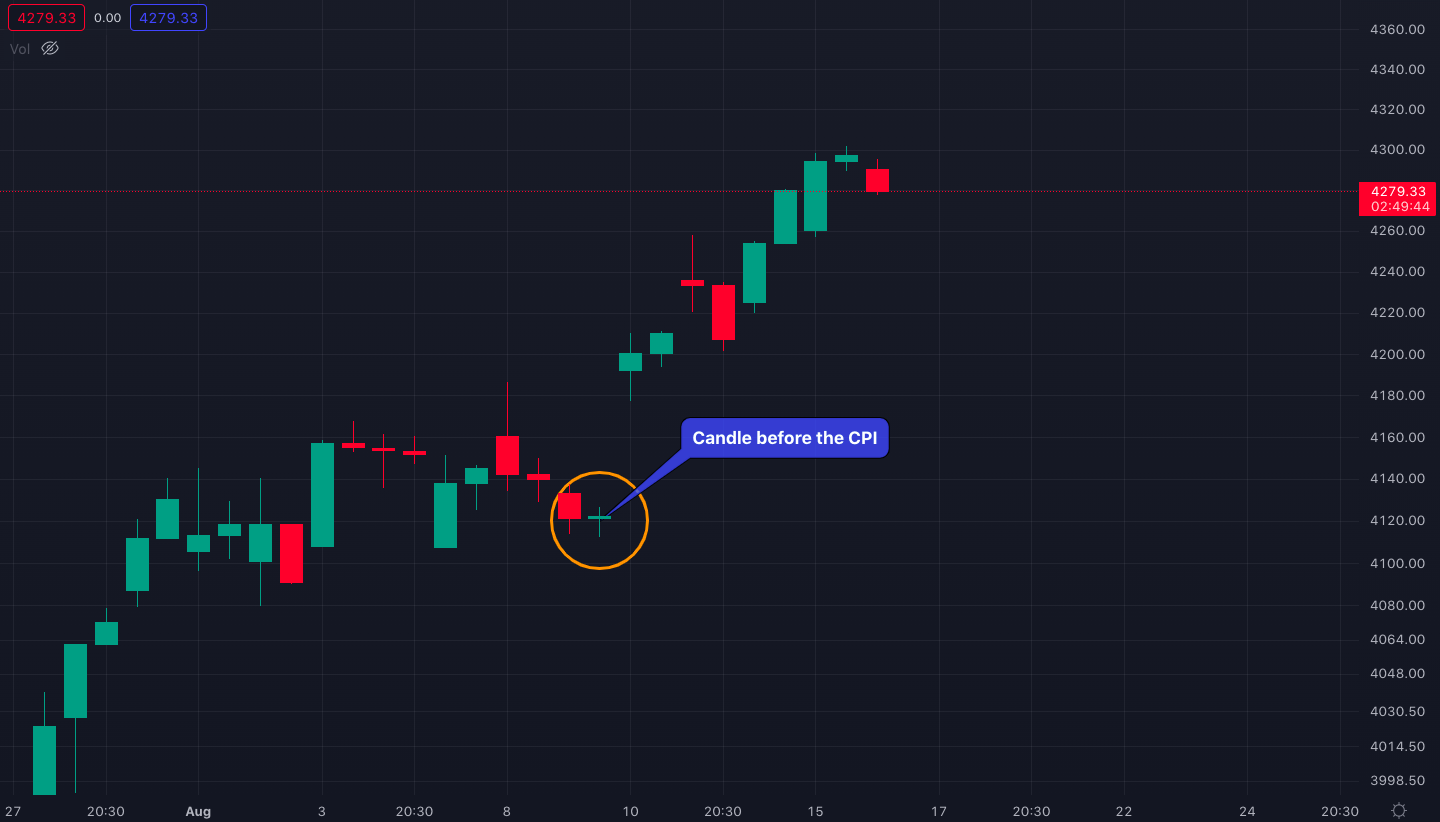
S&P 500 price chart in 4-hour candles
Bitcoin’s parallel rising channel could indicate a make-or-break point is on the horizon. Historically, the later a price action occurs, the more explosive it has the potential to be. In that sense, a break out of the channel could swiftly take the price of Bitcoin above $30,000 or below $20,000.
As the S&P 500 index is getting overbought in multiple time frames, market participants may need to keep a closer eye on this space to more accurately evaluate Bitcoin’s next possible moves. Keep in mind that there could always be a lag in the price moves of correlated assets: even if the S&P tops out, it doesn’t mean Bitcoin is going to top simultaneously.
S&P 500 overbought at major resistance
Following the $3,600 bottom in June, the S&P 500 was able to breach the first major resistance on August 10 ($4,170), right after the lower-CPI announcement.
In only four trading days, the index price hit the next major resistance at $4,300.
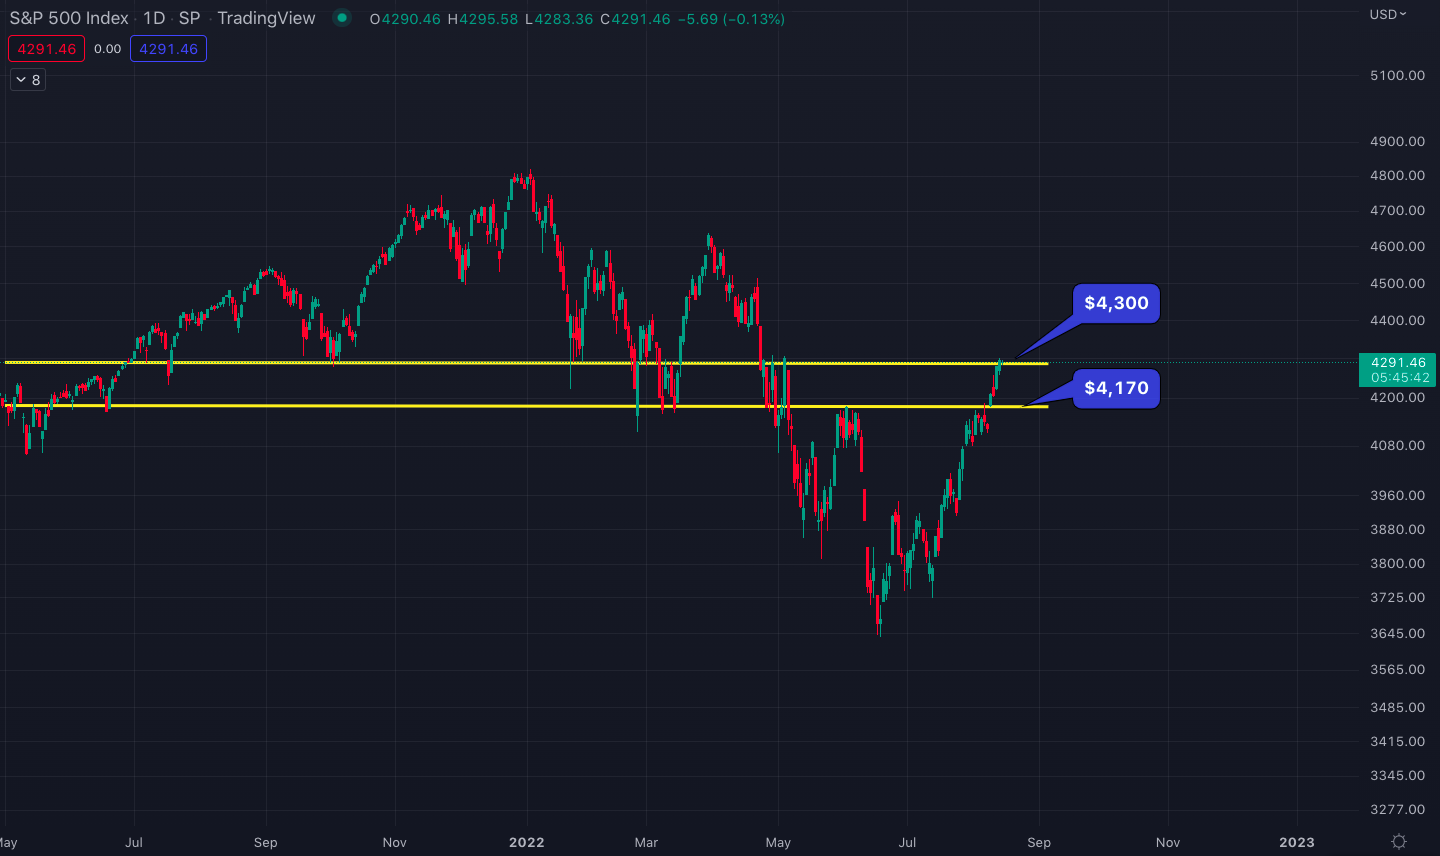
S&P 500 chart in the daily time frame with major resistance levels
Overbought in the weekly time frame
The stochastic RSI for S&P 500 has become significantly overbought in the weekly time frame. Stochastic RSI is a momentum indicator used to determine overbought and oversold price levels for an asset. The values of the indicator can range between 0 and 100, where 0 indicates an oversold price and 100 indicates an overbought price.
The S&P 500’s weekly stochastic RSI hit 100 on the week of August 1, and has stayed at that level since then. This could suggest that the $4,300 resistance may not be broken at the first attempt, at least in the short term.
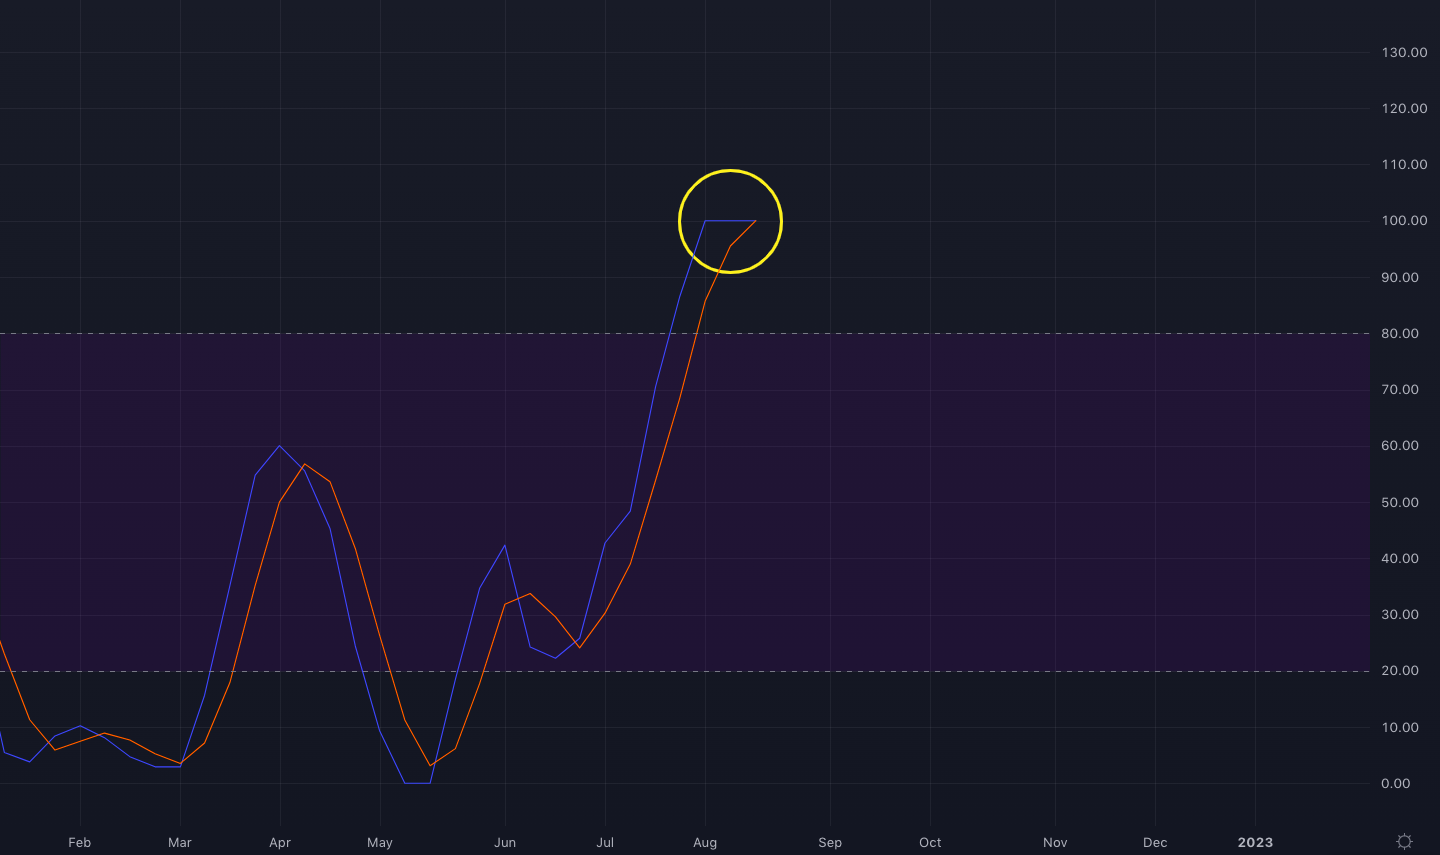
Weekly stochastic RSI chart for S&P 500
Possible cup & handle formation for Bitcoin
In the meantime, the price of Bitcoin is sitting on short-term support at $23,800. If the support sustains, the price action since July 26 could play out as a cup and handle formation:
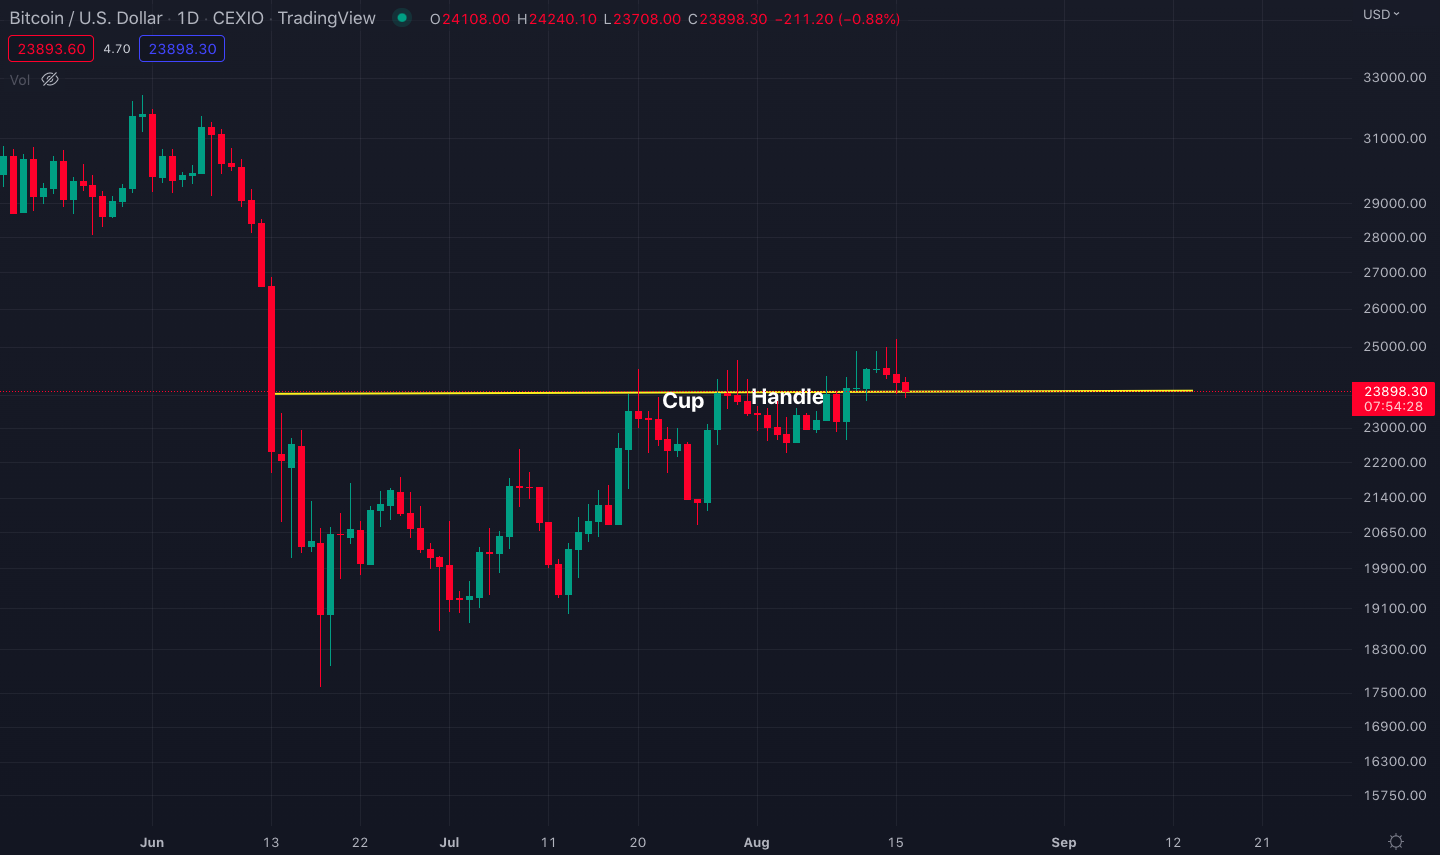
Daily Bitcoin/U.S. Dollar chart with the $23,800 resistance
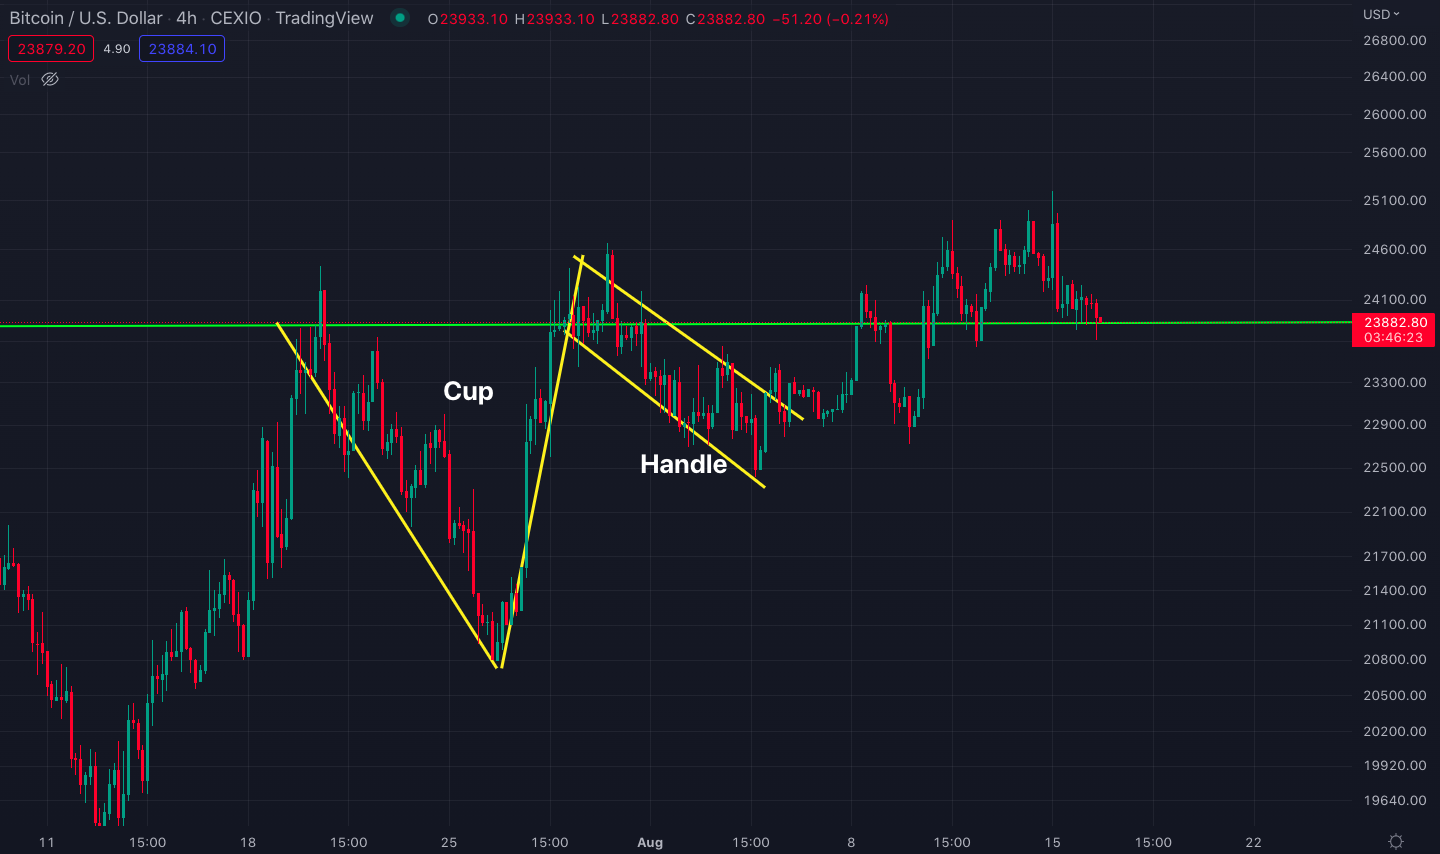
Zoomed-in view of the cup & handle formation in the 4-hour time frame
If the S&P 500 index ranges around the $4,300 resistance for some time, it could give Bitcoin the momentum it needs to finally break out of the channel and head to the major $29,000 resistance.
Rising wedge
On the other hand, Bitcoin has also been traveling inside a rising wedge since July 26. Rising wedges, especially during bear markets, often play out as a bull trap. If this is indeed the case, we could see the wedge break to the downside, back to the $20,800 support from June 26.
Currently, the price of Bitcoin is exactly at the bottom support of the wedge (see the chart below) so it is worth watching this wedge formation to better monitor where Bitcoin could be headed next.
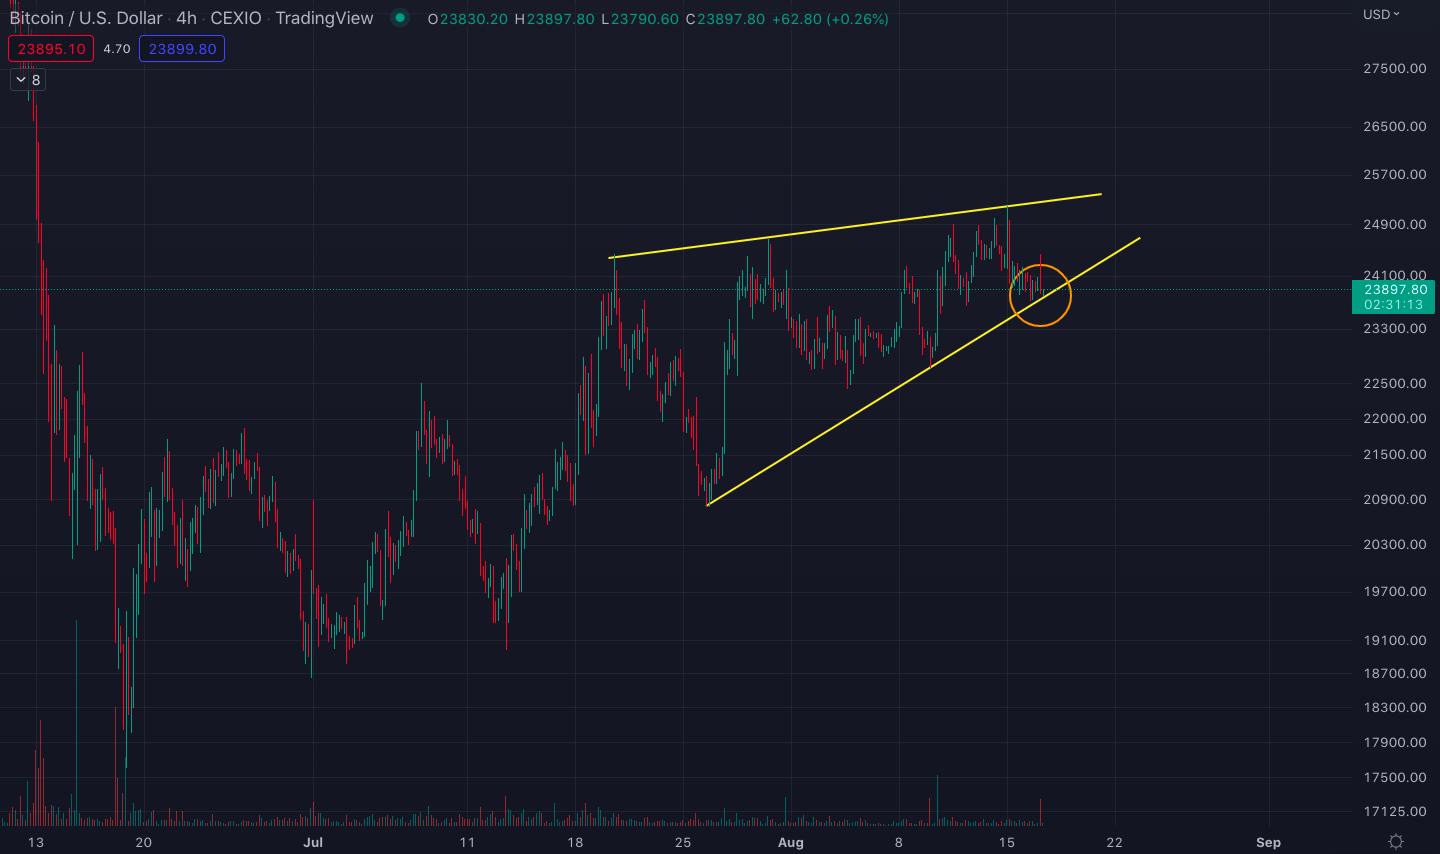
The rising wedge formation on the Bitcoin chart
Spent Output Profit Ratio
In terms of Bitcoin’s on-chain activity, the Spent Output Profit Ratio (SOPR) has reached the historically critical 1.0 threshold.
SOPR calculates the ratio of realized profit or loss for all bitcoins moved on-chain.
In the past, whenever the Bitcoin SOPR hovered above 1.0 for an extended period, it brought a massive bull run. The historical 2016/17 bull run (from $300 to $20,000), the giant 2019 bear market rally (from $3,000 to $14,000), and the last bull run in 2021 (from $10,000 to $60,000) all mark the periods when the SOPR was consistently above 1.0 (see the chart below).
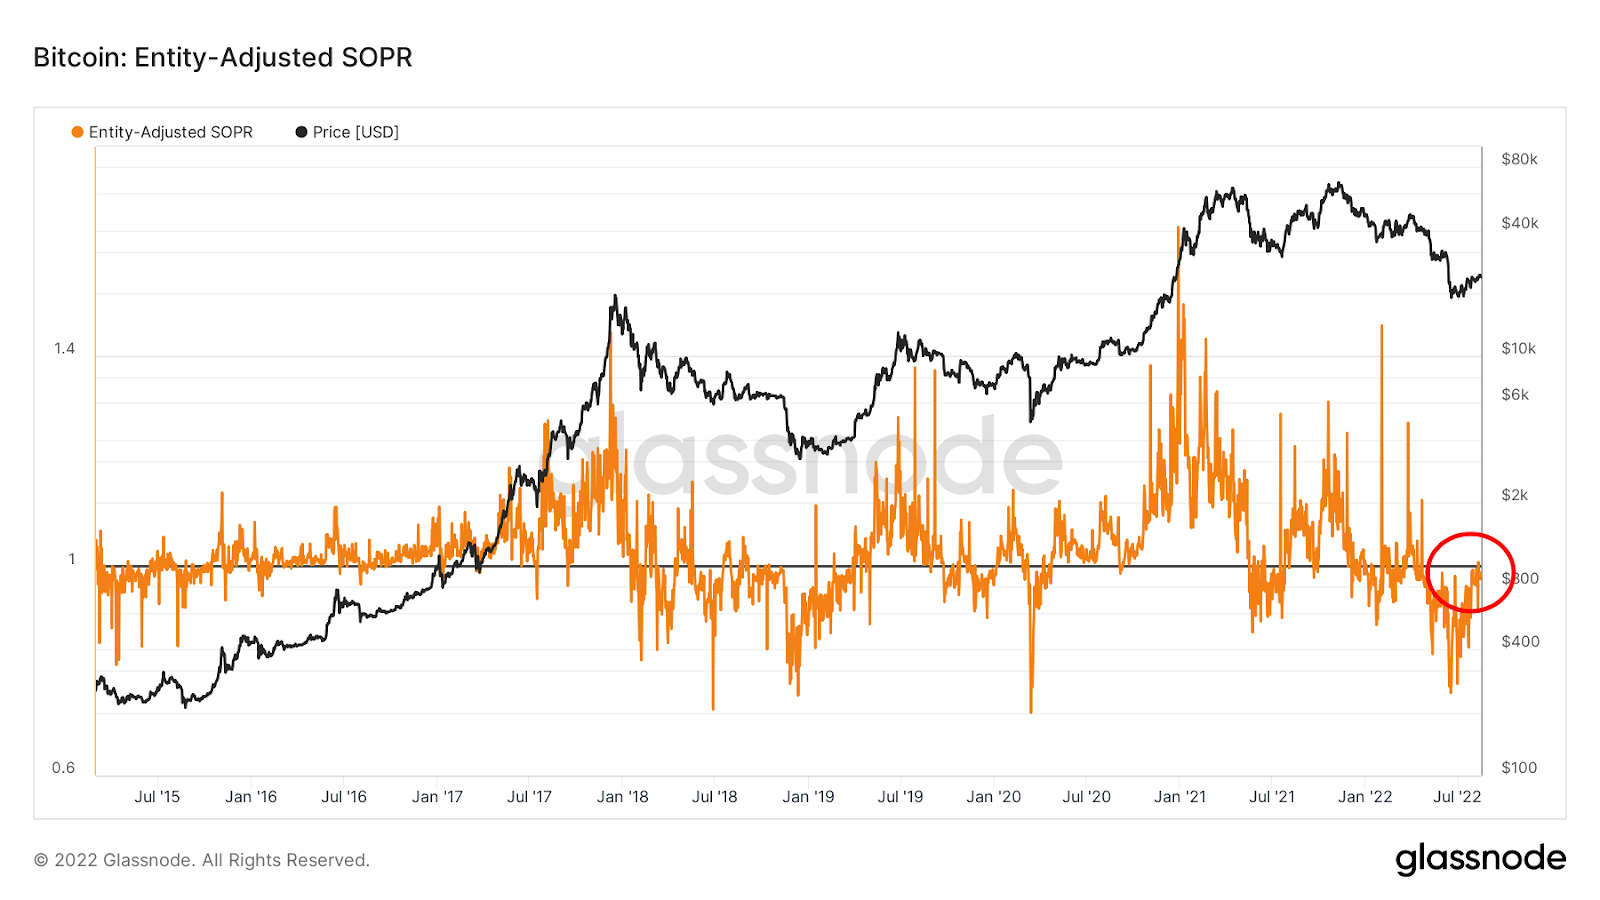
Entity-adjusted Spent Output Profit Ratio (SOPR) & Bitcoin price chart. Source: Glassnode
Please note that the chart above displays the entity-adjusted SOPR which discards transactions between addresses of the same entity (“in-house” transactions). The entity-adjusted SOPR accounts for real economic activity only and provides a superior market signal compared to its raw counterpart.
The entity-adjusted SOPR is currently trying to break above the 1.0 resistance as circled in red in the chart. If the resistance is decisively broken, a new Bitcoin bull trend could start with the price breaking above the rising channel resistance.
On the contrary, the 2022 bear market has not yet seen the SOPR plunge to its 2018-20 lows. In December 2018, the ratio dropped to as low as 0.75 before continuing to drop to less than 0.70 during the COVID-19 crash in March 2020. This suggests that the absolute market bottom may not be in Bitcoin’s future just yet regarding the current cycle.
Bitcoin dominance back at the 40% support
Bitcoin dominance is the ratio of Bitcoin’s market capitalization against the total cryptocurrency market value. Thus a higher Bitcoin dominance means a weaker altcoin market.
The dominance started an uptrend in May, during the Terra/UST collapse, as a consequence of shaken investor confidence for altcoins and stablecoins. The ratio increased as the price of Bitcoin kept dropping until June 18.
Following Bitcoin’s capitulation, the 48% level acted as resistance again for Bitcoin dominance (the resistance from the 2021 bull market). After hitting the resistance, the dominance started to crash very rapidly which manifested itself in Ethereum outpacing Bitcoin throughout July. Additionally, July saw over 100% price gains in major altcoins like Polygon, Aave, and Uniswap.
The ratio is now almost back at the 40% support from last year. If Bitcoin dominance makes a new low below 39%, it will be the first time in cryptocurrency’s history that the dominance breaks down long-term support during a bear market.
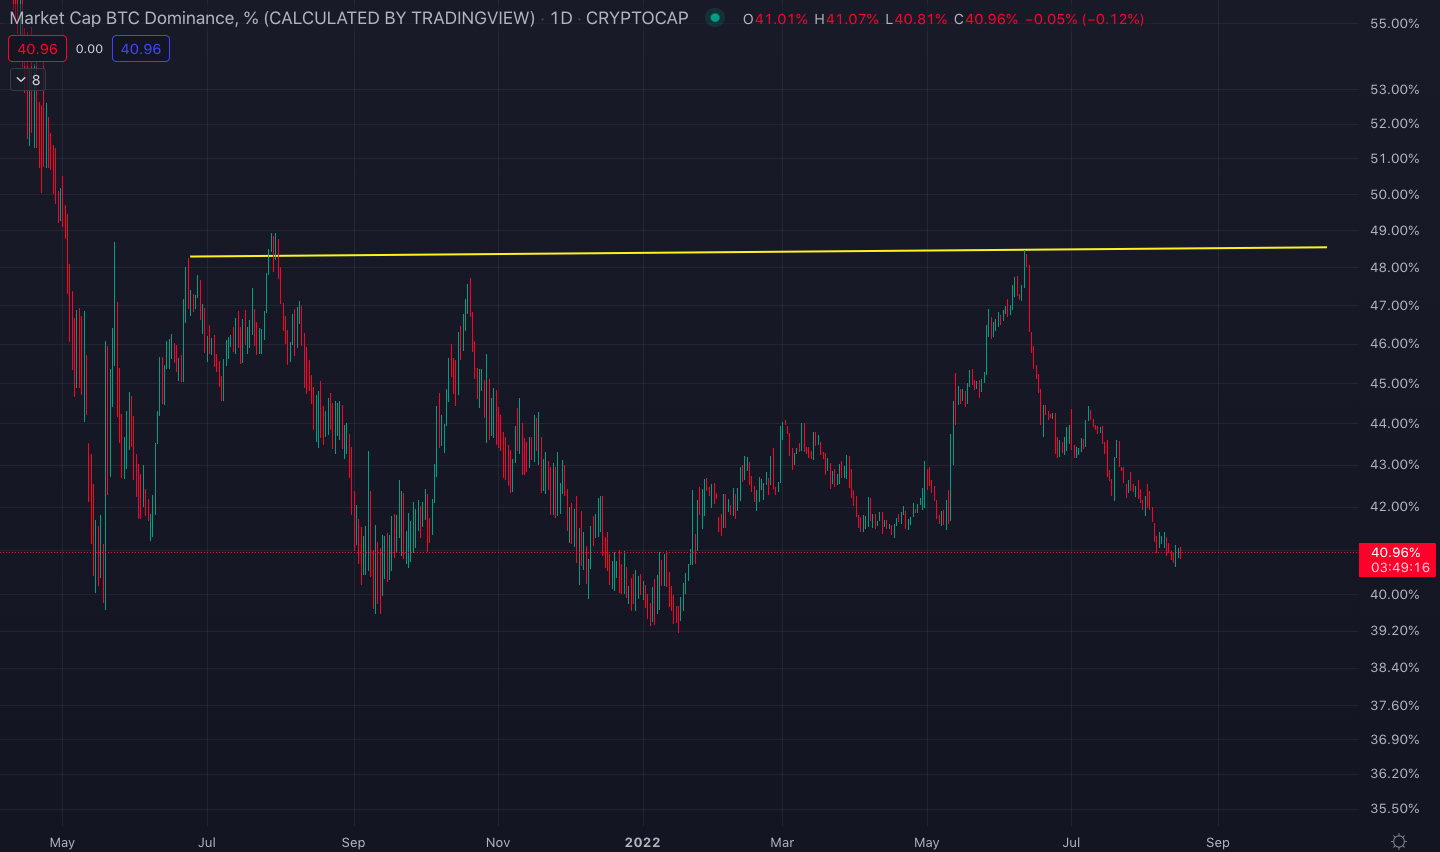
Bitcoin dominance chart with daily candles
To date, bear markets have had rising Bitcoin dominance which peaked during Bitcoin’s cycle-topping bull runs. Cycles were then completed with a massive crash in dominance as a full-blown altcoin season set in.
But the question remains: will there be an alt season this time in the middle of a bear market?
It is possible that the dominance could keep plummeting and test the descending support line at 39% (the green line in the chart below).

In terms of market fundamentals, the ever-increasing hype about the Ethereum Merge could trigger a breakdown below 39% since Ethereum is by far the largest altcoin and a major market mover for altcoins. The past bear markets never witnessed such a fundamental development considering Bitcoin dominated the market’s overall direction during these cycles.
Otherwise, if the 39% level plays out as a bull trap, then the Merge could end up as just another “buy the rumor, sell the news” event in cryptocurrency history.
Tornado Cash sanction sparks fears of crypto enforcement
Tornado Cash was sanctioned by the U.S. Treasury after allegations of money laundering were followed by recent cryptocurrency heists.
Tornado Cash is a privacy protocol on the Ethereum blockchain that anonymizes coin transactions by masking transaction hashes as well as both sender and receiver wallet information. In that sense, the protocol is akin to privacy coins like Monero and Zcash.
The protocol has been accused of facilitating the $455 million hack from Axie Infinity’s Ronin bridge by North Korea’s state-sponsored Lazarus Group.
Tornado Cash was also used during the $100 million heist on Harmony’s Horizon bridge.
Hackers would often use Tornado Cash when stealing funds on blockchain bridges or from individual user wallets. When transactions are made through Tornado Cash, transaction hashes do not appear on blockchain explorers nor on the hacker’s wallet address.
Due to this, the U.S. government enforced the sanction to be able to track stolen funds and access wallet information in the interest of national security.
However, the sanction stirred a lot of concerns in the crypto community. Many people are worried that this could create a slippery slope for Web3 privacy and eventually make the entire space meaningless. While Web3 envisions a decentralized ecosystem,without any privacy it could end up being no different than the centralized internet we are using today.
On August 10, the arrest of a Tornado Cash smart contract developer in the Netherlands further shocked the community because it opened the door to broader questions of cross-border jurisdictions in the crypto space.. Crypto enthusiasts are now asking the question, “if the sanction is enforced in the U.S., then why was there an arrest made on foreign soil?”
Global cryptocurrency enforcements have been hanging above the crypto ecosystem for some time like the sword of Damocles. As such, the recent arrest could pave the way for crypto regulations that span the entire globe.
$1.6 billion transferred from USDC to Tether
Regulatory clampdown fears started to dominate the space immediately after the Tornado Cash ban. For example, Circle, the issuer of USD Coin (USDC), froze $75,000 worth of USDC tokens that belong to Tornado Cash users.
The decision provoked widespread debates in the crypto community. Many people expressed their concern that corporate intrusion has eroded the cryptocurrency ethos of privacy and decentralization.
Following Circle’s account freezes, crypto users transferred $1.6 billion from USDC to rival stablecoin, Tether (USDT). Although Tether was often accused of lacking transparency concerning the reserves that back its USDT stablecoin, many people found it the safer choice after Circle started freezing customer accounts.
Tether’s approach might be paying off for now, but if the U.S. Treasury releases more specific guidelines around stablecoin issuance, the tides could turn in Circle’s favor.
Observers maintain that the crypto ecosystem still needs new stablecoins that are truly decentralized to overcome these obstacles despite the bitterness of UST’s recent collapse.
Ripple looks to purchase Celsius assets
Ripple Labs is considering a potential purchase of assets from Celsius amidst Celsius’ bankruptcy process. It is not yet clear whether Ripple is interested in acquiring Celsius in its entirety.
According to news outlets, Celsius management has not yet responded to the inquiry. Back in June, Celsius rejected a similar offer from Nexo, a prominent cryptocurrency lending platform.
Tune in next week, and every week, for the latest CEX.IO crypto ecosystem update. For more information, head over to the Exchange to check current prices, or stop by CEX.IO University to continue expanding your crypto knowledge.
Disclaimer: Information provided by CEX.IO is not intended to be, nor should it be construed as financial, tax or legal advice. The risk of loss in trading or holding digital assets can be substantial. You should carefully consider whether interacting with, holding, or trading digital assets is suitable for you in light of the risk involved and your financial condition. You should take into consideration your level of experience and seek independent advice if necessary regarding your specific circumstances. CEX.IO is not engaged in the offer, sale, or trading of securities. Please refer to the Terms of Use for more details.