This week, CEX.IO looks behind the mist of Bitcoin’s recent fakeout from $19,500 to $18,500 and subsequent pump to $22,600. In the 31st edition of our Crypto Ecosystem Update, we discuss the bullish and bearish factors for Bitcoin that could determine its direction for the rest of the year.
Additionally, we provide an update on Bitcoin’s dominance and the BNB chain.
Read along for in-depth price analyses and enjoy reviews of correlated markets to help you make the most informed decisions along your crypto journey.
The historic Bitcoin fakeout
Last week, Bitcoin made one of the most remarkable fakeouts in recent memory.
After breaking down from the rising channel that it followed for two months and from the flat consolidation area between $19,500-$20,5000, almost everybody was convinced that Bitcoin would go much lower.
However, buying volume followed on the morning of September 9, pushing the price of Bitcoin from $19,300 to $22,000 in only 24 hours. What is more significant here than the sudden 14% price increase is the volume. September 9 saw almost as much buying volume as the March 2020 capitulation.
Despite the bearish outlook earlier in the month, this unexpected volume could be the harbinger of a trend reversal, at least in the short term. As further confluence, Bitcoin closed last week at the week’s high price. Closing a high time frame (a week or a month) without getting rejected at high prices is critical to sustaining the price momentum.
If a new uptrend is starting, Bitcoin could soon march to the 2021 bull market support at $29,000.
However, there is an important caveat: The former parallel rising channel from July and August now turned to resistance. This resistance is currently at $22,600, which could see Bitcoin having difficulty surpassing this level.
If the resistance turns out to be adamant and Bitcoin cannot close this week above $22,600, the recent price action could end up as just another fakeout, this time to the upside. Failing to close the month above $22,600 could be destructive for the cryptocurrency market considering the S&P 500 price chart has been showing lukewarm performance lately.
In the sections below, we’ll discuss both the bullish and bearish factors brewing for Bitcoin and which factors could determine its next major move going into Q4.
Bullish factors
Stunning whipsaw
In technical analysis terms, a fakeout is called a “whipsaw,” where the price of an asset temporarily breaks up or down from a structure to trap traders out, before moving back in the opposite direction shortly after.
After breaking down from the summer’s rising channel on August 26 (the Jackson Hole meeting), Bitcoin ranged in a tight channel between $19,500 and $20,500 for over ten days (circled in yellow in the chart below).
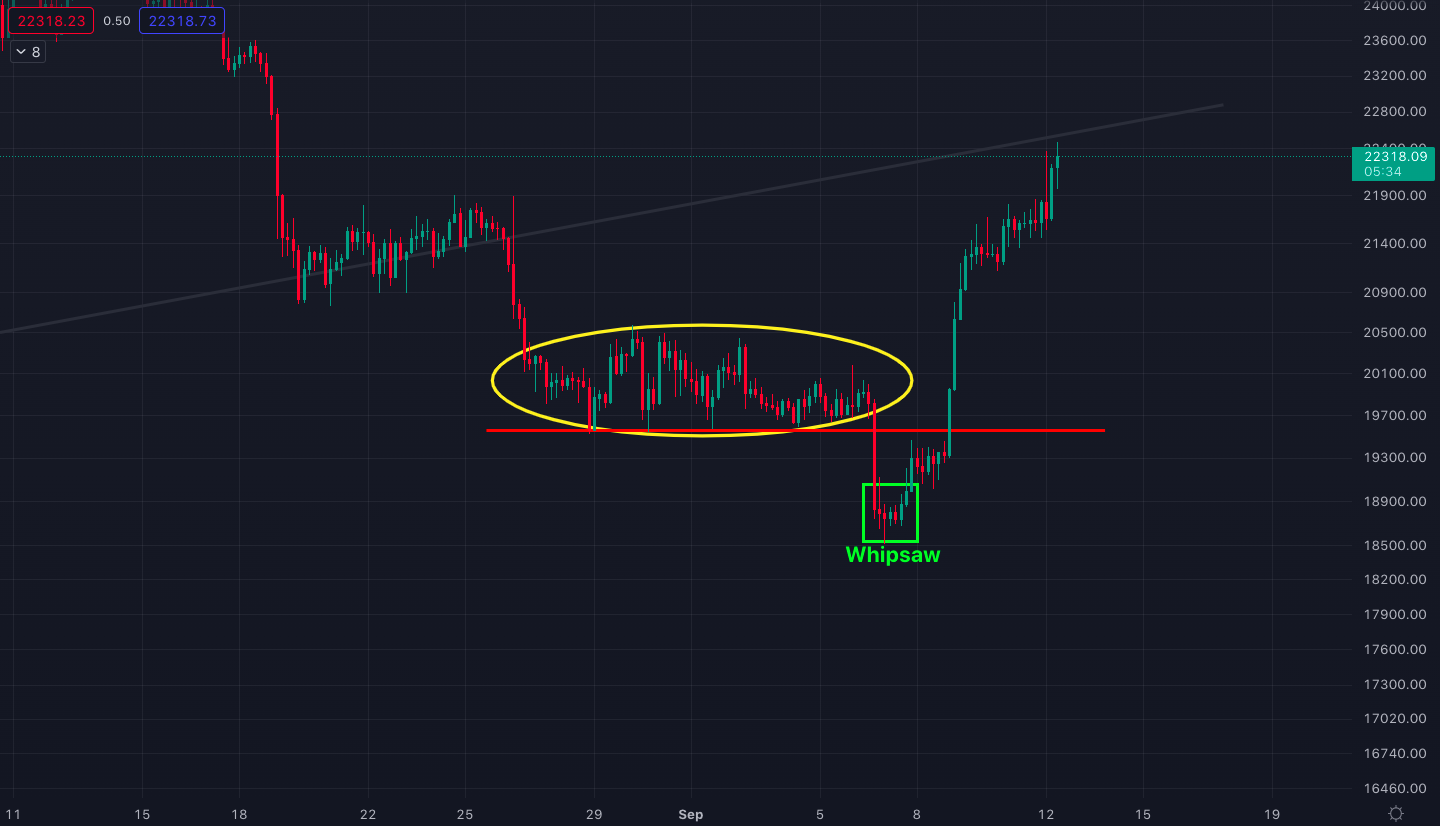
Bitcoin/U.S. Dollar price chart with 4-hour candles.
Breaking from such tight channels after prolonged periods of consolidation often leads to explosive price movements. When Bitcoin broke down from the channel, the market was generally convinced of a move to at least the $17,000 region.
Normally, such a breakdown would have a short-term target of $17,500. But as you can observe in the chart above, there was a whipsaw at $18,500 and the price just exploded to over $22,000 in three days.
Weekly bullish engulfing candle
Bitcoin recorded a bullish engulfing candle on the week of September 5, compared to the red candle on the week of August 22. A bullish engulfing candle is considered a reversal candle, where the higher its time frame, the more likely it could be an indication of coming price actions.

Weekly Bitcoin chart with the bullish engulfing candle.
Massive bounce from the long-term descending line
Bitcoin has been falling along a descending trend line since the end of July (circled in purple in the chart below). It touched the line three times before with weak bounces every time. However, the last touch on September 9 bounced with a ferocious momentum which could fuel the force we need to start an uptrend, at least a short-term one.
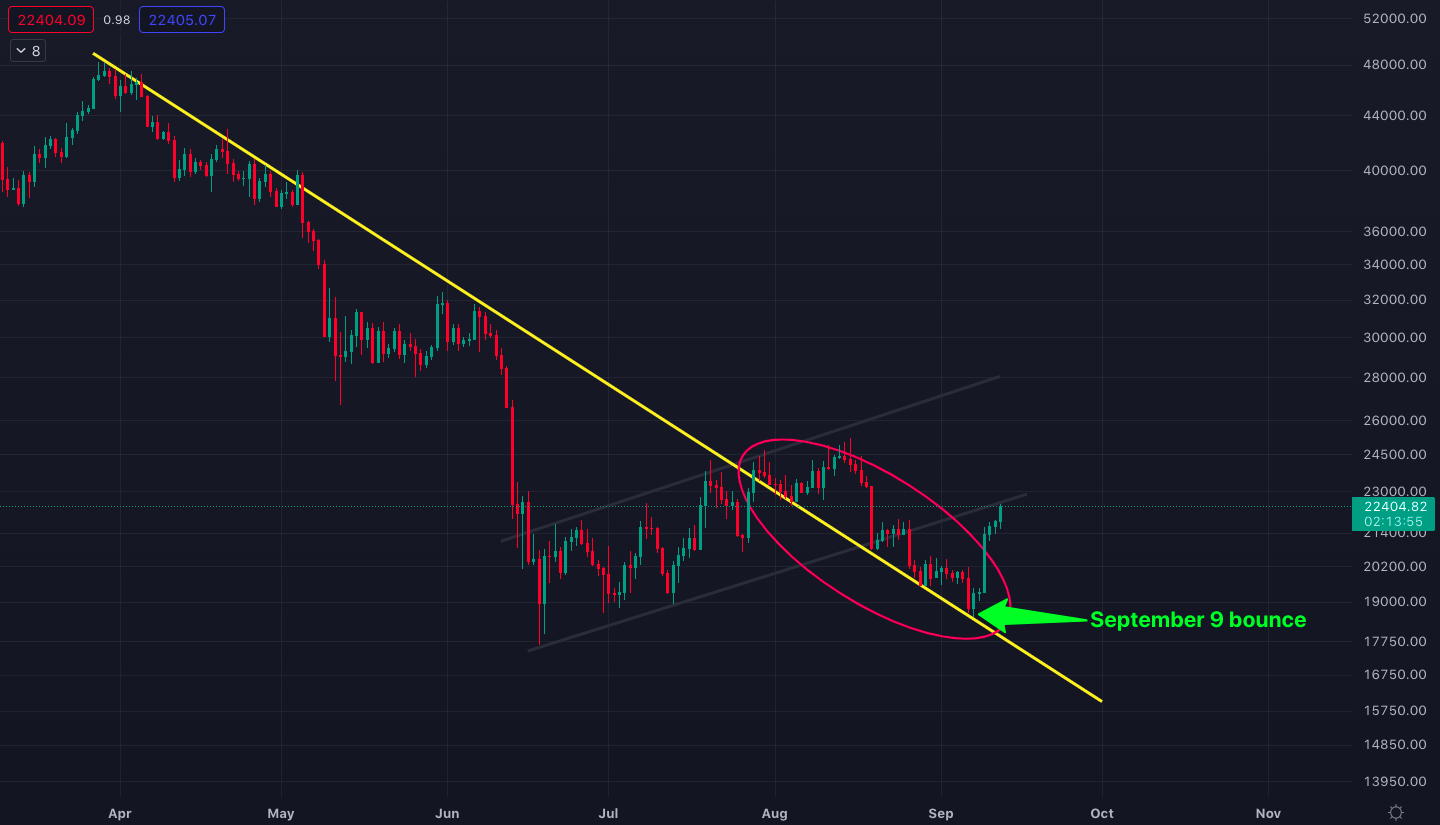
Bitcoin price falling along the descending trend line since August.
Bullish cross in the weekly stochastic RSI
Stochastic RSI measures the speed and magnitude of an asset’s recent price changes to determine overbought and oversold conditions in the price of that asset. The values of the indicator can range between 0 and 100, where 0 indicates an oversold price and 100 indicates an overbought price.
There are two lines in the stochastic RSI indicator – the fast line (blue) and the slow line (orange). When the fast line crosses above the slow line, it means momentum is building up. Again, the higher the time frame of the cross, the more influence it could have on the upcoming price action.
Although Bitcoin’s weekly stochastic RSI made a bearish cross on the week of August 22 (circled in red in the chart below), the cross turned out to be a fakeout with last week’s bullish cross (circled in yellow). This bullish cross could be the precedent of an upcoming uptrend.
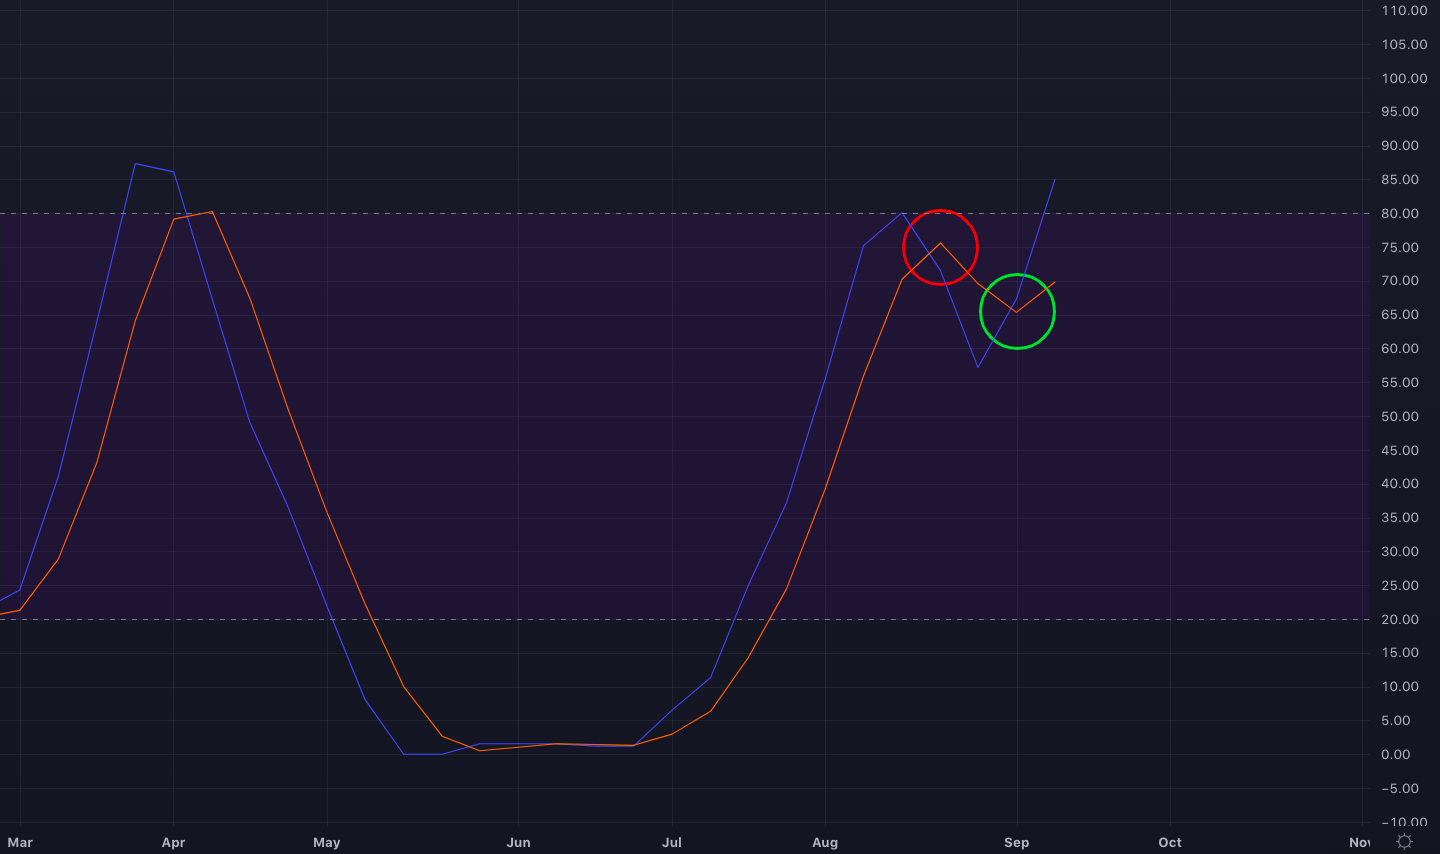
Weekly stochastic RSI chart for Bitcoin.
Weekly MACD builds momentum
Moving average convergence divergence (MACD) is calculated by subtracting the 26-period moving average (MA) from the 12-period moving average. MACD triggers a buy signal when the 26-period MA (the blue line in the chart below) crosses above the 12-period MA (the orange line).
Bitcoin had a bullish weekly MACD cross on the week of August 8 and momentum has been building as indicated by the widening distance between the 26-period and 12-period MA.
On the other hand, the red and green candles at the center of the MACD chart also indicate momentum. Growing dark green candles are a sign of growing momentum as opposed to shrinking light-green candles.
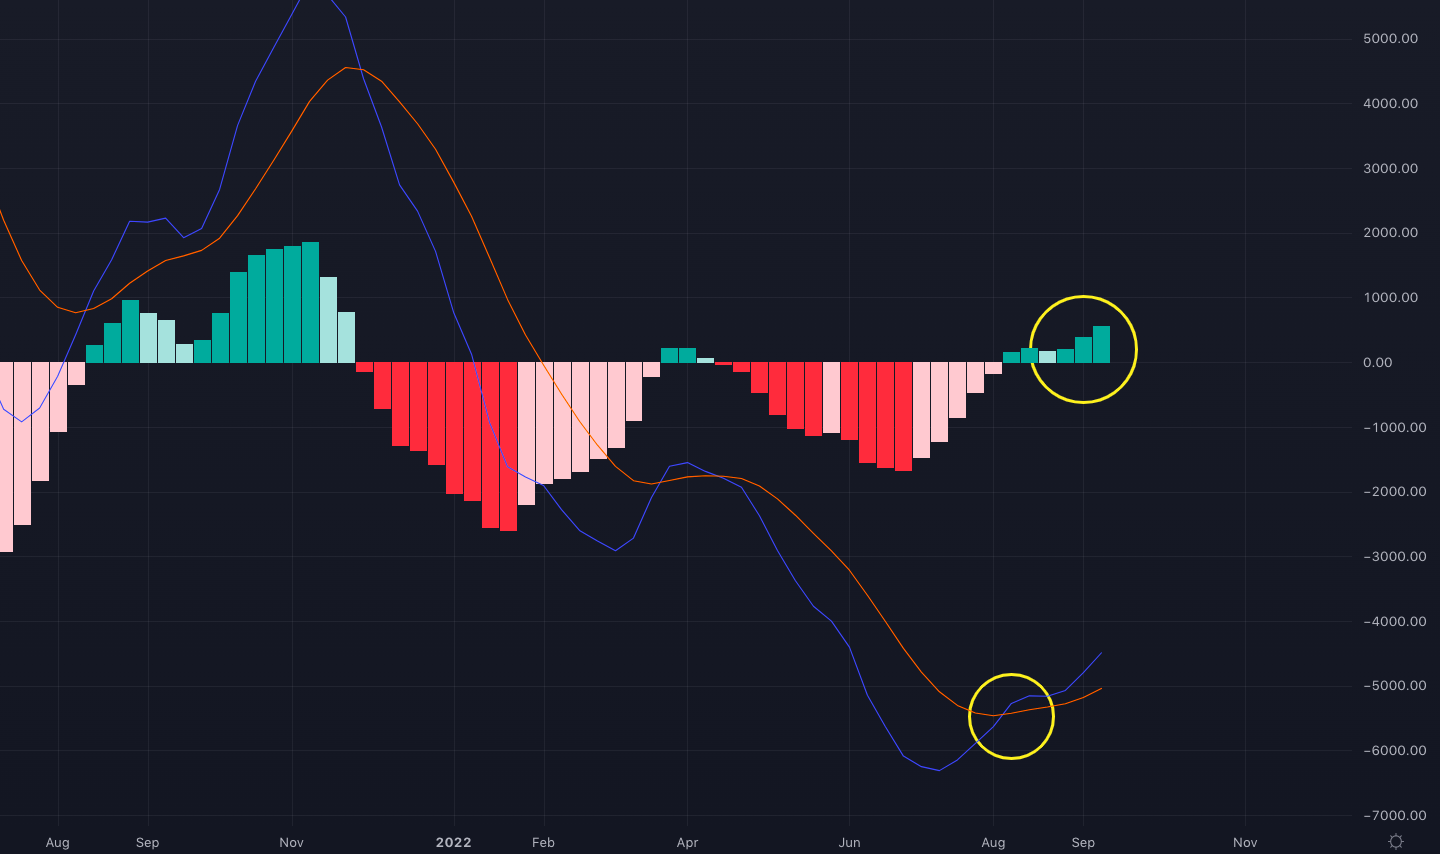
Weekly MACD chart for Bitcoin.
Bearish factors
Rising channel support acts as resistance
With the price advance since September 9, Bitcoin has now reached the moment of truth – the support line of the rising channel from July and August. The price of Bitcoin is currently flirting with this line (as you can observe in the chart below) and the outcome of this affair could likely determine the next big move for Bitcoin.
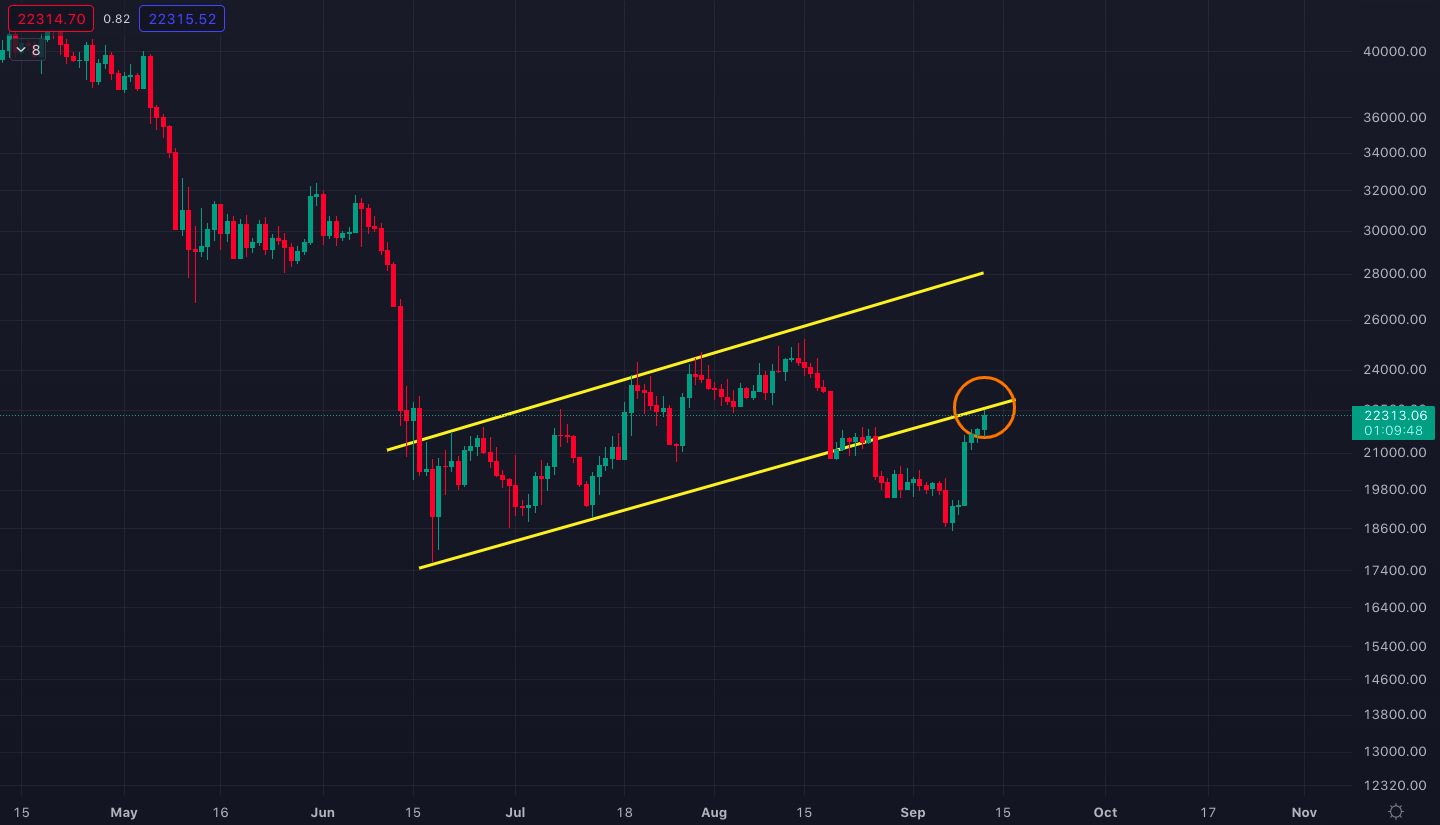
The parallel rising channel in yellow and Bitcoin knocking on the door.
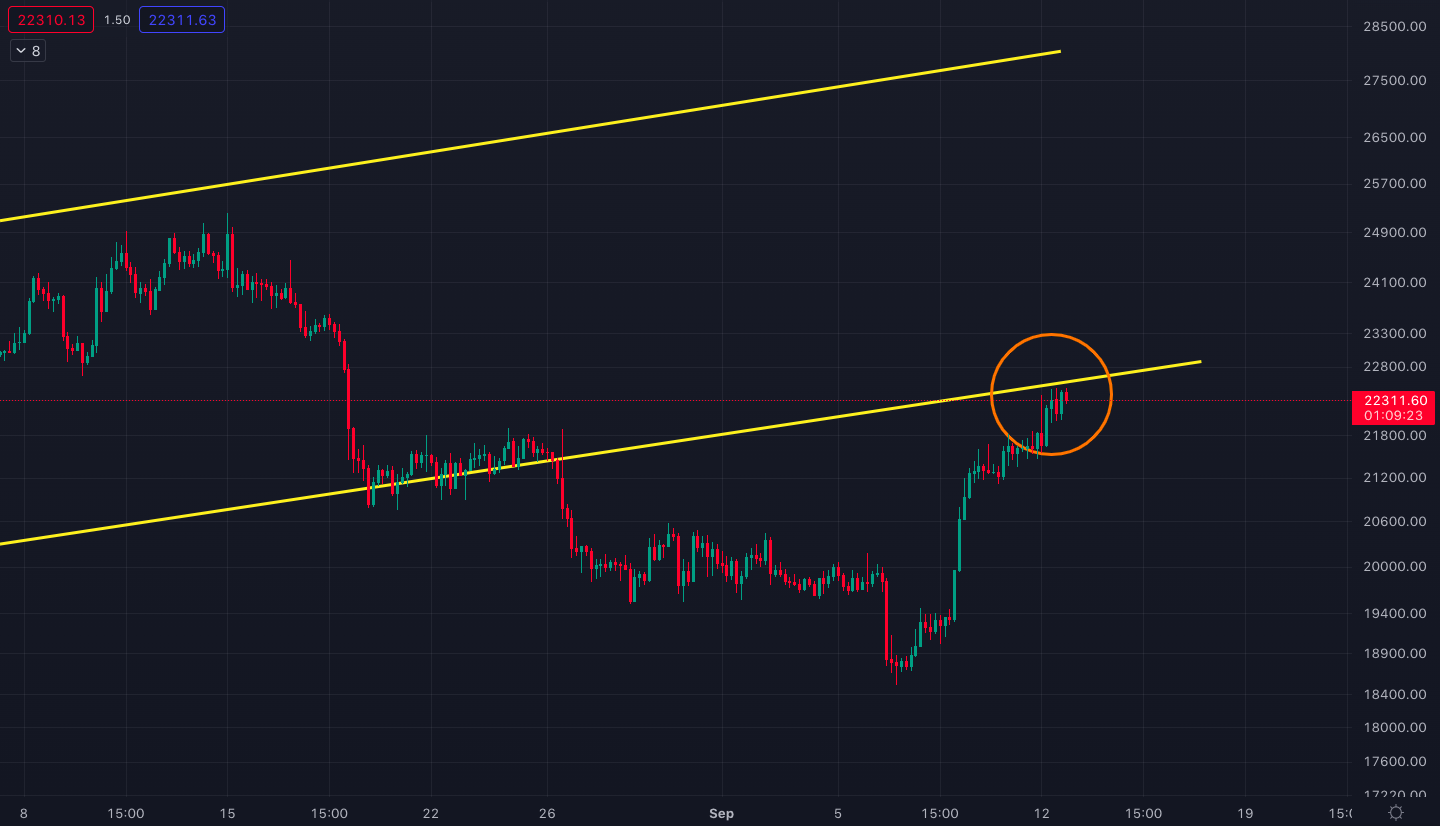
Zoomed-in view of the rising channel resistance.
Invalidating the former support line and breaking back into the channel could open the gates for a rally to the 2021 bull market support at $29,000.
On the contrary, a rejection at the support line on a weekly or a monthly close could spell disaster for Bitcoin as that has the potential to turn into a bear flag with a target price of $12,000.
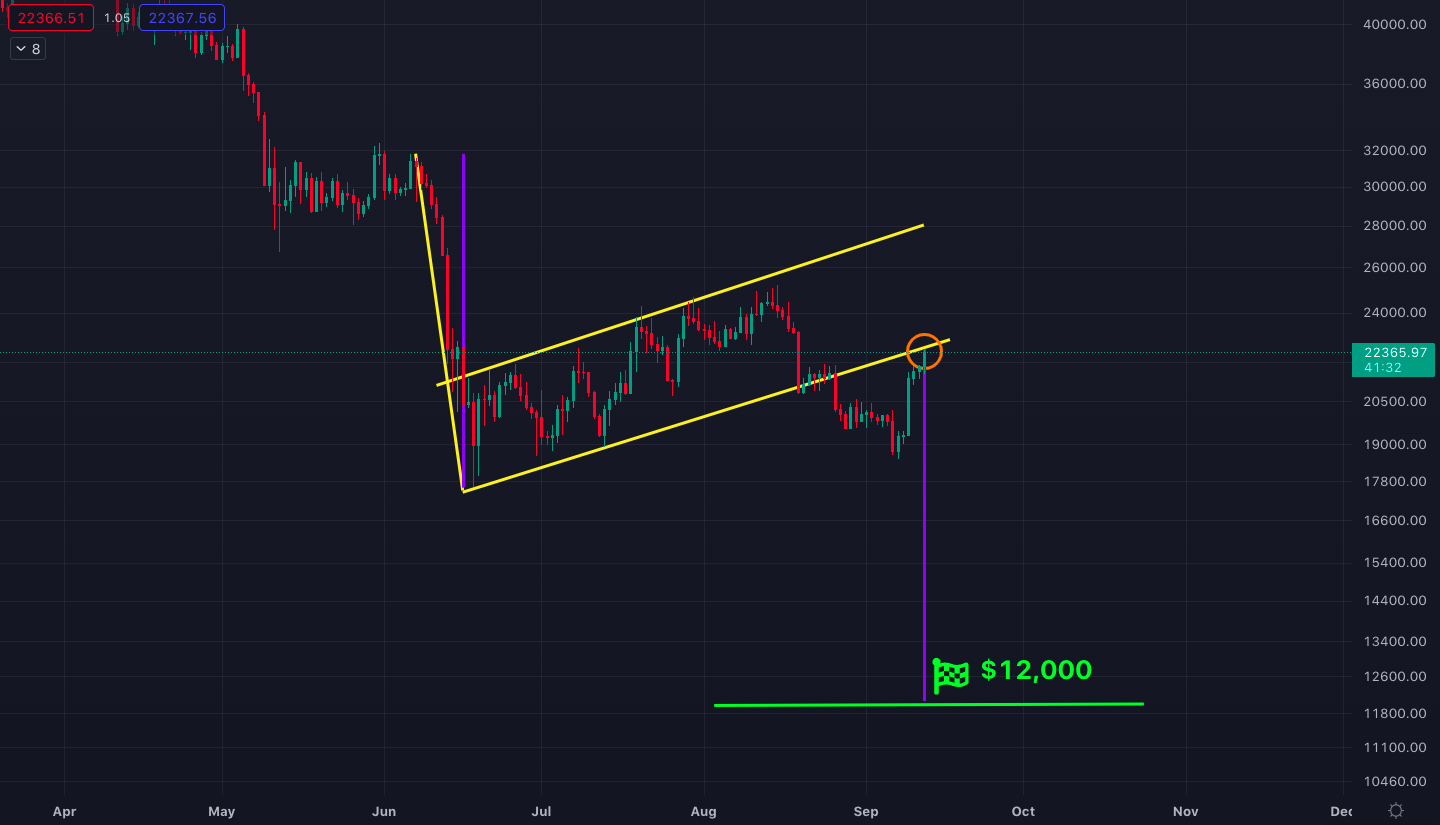
Potential bear flag formation for Bitcoin with the $12,000 target.
Short-term descending resistance
Another major resistance that Bitcoin has to contend with is the descending trend resistance from May’s $32,000 top. This resistance has recently intersected with the rising channel’s support line (see the chart below).
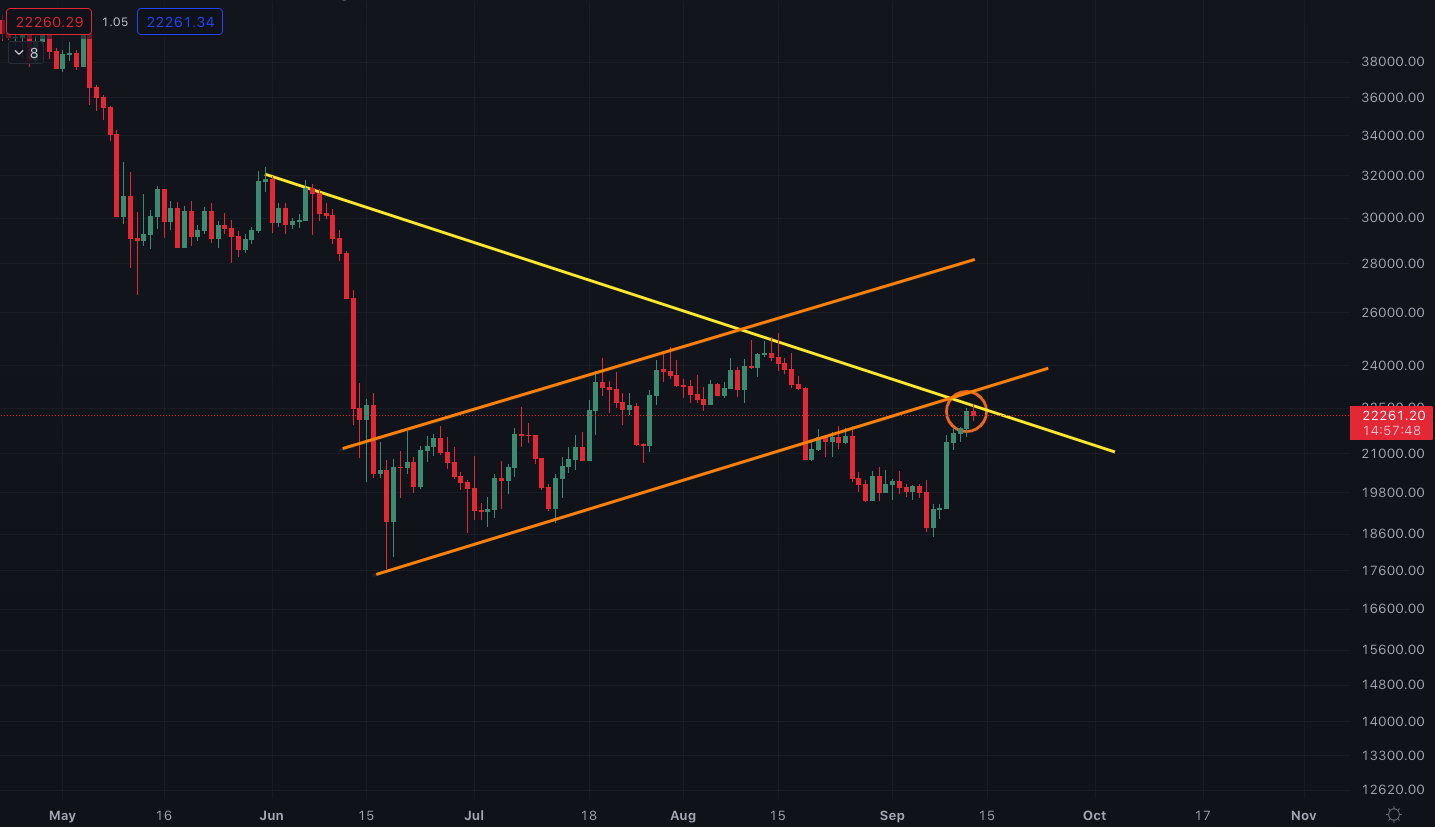
Bitcoin’s double resistance at $22,600.
Having not one but two significant resistances at the same price level ($23,000) could make things more challenging for Bitcoin to break back into the rising channel.
Growing exchange balances
An even more concerning development than the $23,000 double resistance is the recent increase in Bitcoin exchange balances (boxed in red in the chart below).
Despite the Bitcoin pump from $18,500 to $19,500, more bitcoins were moved to exchanges. This creates a divergence with the price increase because when Bitcoin balances on exchanges increase, it is often an indication that more people are gearing up to sell their coins.
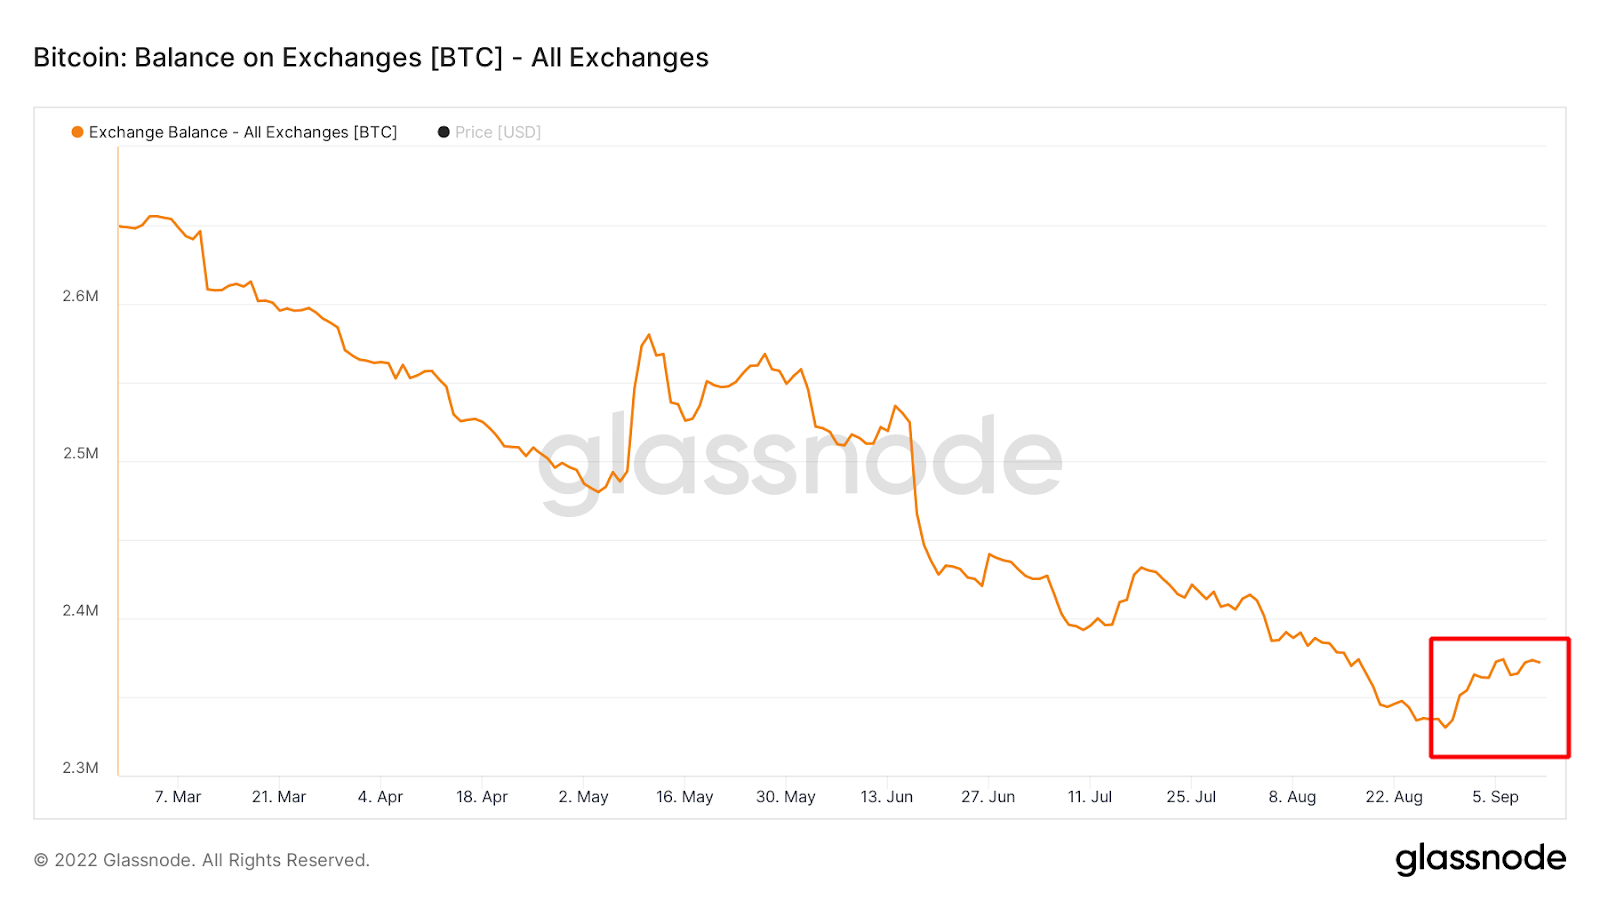
Total Bitcoin balance in all exchanges. Source: Glassnode
When you look left on the chart above, you will see that the last time exchange balances spiked in May, it ended up with Bitcoin’s capitulation in June (the crash from $30,000 to $17,600). While this could just be a coincidence, it might be wise to keep an eye on this indicator going forward.
Bitcoin dominance
Bitcoin dominance is the ratio of Bitcoin’s market capitalization against the total cryptocurrency market value. Thus a higher dominance means a stronger Bitcoin and a weaker altcoin market.
On September 9, Bitcoin dominance exploded from its 39% support when Bitcoin made the whipsaw. This suggests that money has started to move out of altcoins and into Bitcoin, and implies that the recent price surge could indeed be a healthy foundation.
To add more confluence, Bitcoin dominance bounced from the multi-year descending support line for the fourth time. Usually, hitting support lines over and over again weakens them, but the strong bounce from the line this time could indicate the start of a big uptrend for Bitcoin.

Descending resistance channel on the Bitcoin dominance chart.
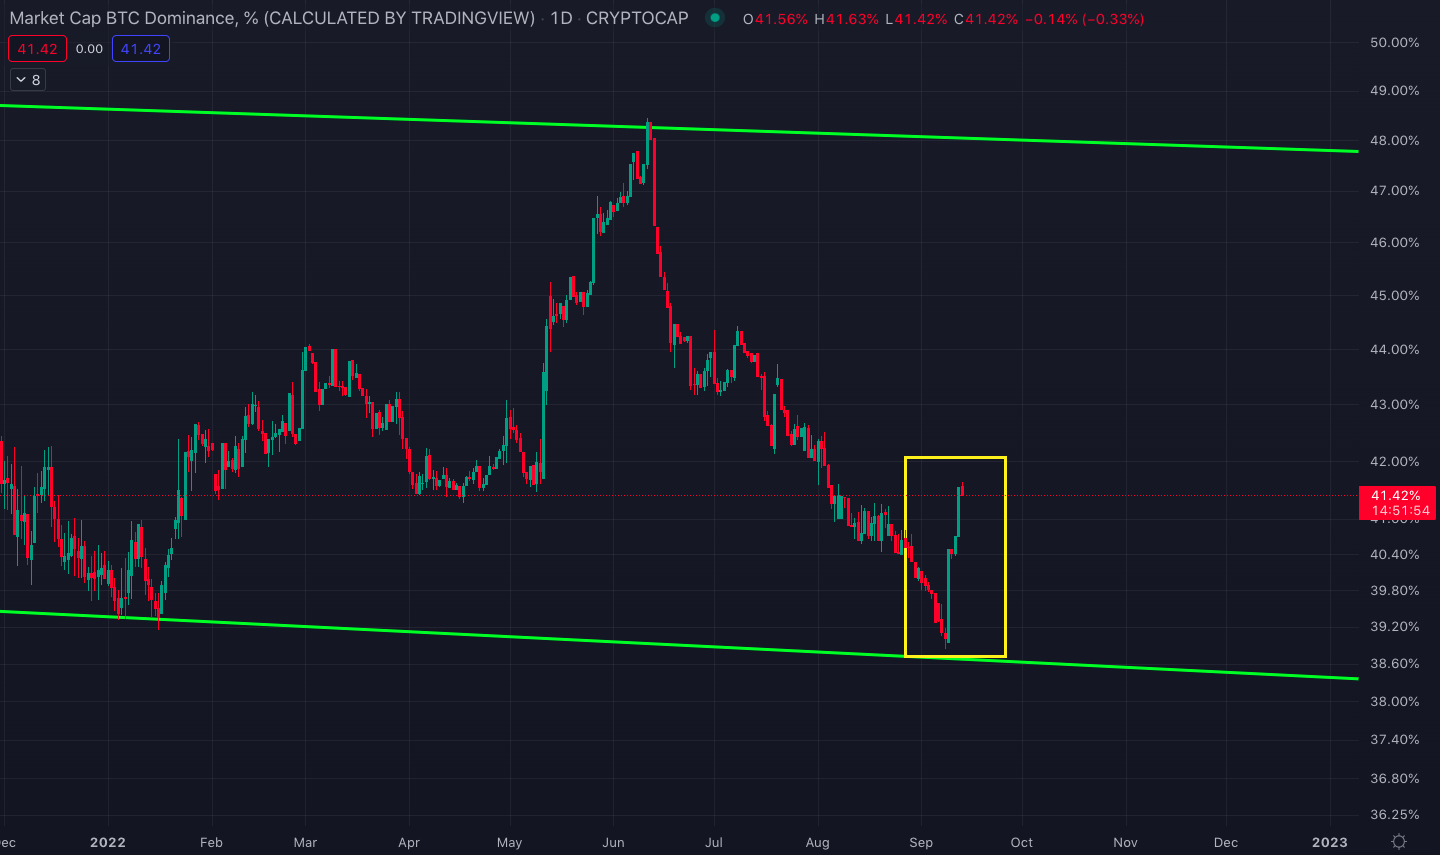
Bitcoin dominance chart on the daily time frame.
Despite all the hype and excitement around the Ethereum Merge, ETH holders should also pay attention to Bitcoin dominance. If the recent bounce starts a new uptrend for the dominance, the Merge could end up as just another “buy the rumor, sell the news” event.
BNB Chain under the radar
While all eyes are on Ethereum, the BNB chain launched its zero-knowledge protocol testnet (zkBNB) to tackle its scaling issues and heat up the layer-1 blockchain wars.
The zkBNB testnet can support 100 million wallet addresses and process up to 10,000 transactions per second. As a result, the BNB chain is soon expected to provide significantly higher transaction speeds and charge lower transaction fees.
The way zkBNB works is akin to layer-2 chains. It gathers sidechain transactions into one single transaction, which generates a cryptographic proof, usually referred to as SNARK.
The price of BNB has been moving inside a descending wedge since its August 8 high. The descending wedge is considered a bullish pattern as it has statistically led to breakouts the majority of the time.
Tune in next week, and every week, for CEX.IO’s latest Crypto Ecosystem Update. For more information, head to the Exchange to check current prices, or stop by CEX.IO University, to expand your crypto knowledge.
Disclaimer: Information provided by CEX.IO is not intended to be, nor should it be construed as financial, tax or legal advice. The risk of loss in trading or holding digital assets can be substantial. You should carefully consider whether interacting with, holding, or trading digital assets is suitable for you in light of the risk involved and your financial condition. You should take into consideration your level of experience and seek independent advice if necessary regarding your specific circumstances. CEX.IO is not engaged in the offer, sale, or trading of securities. Please refer to the Terms of Use for more details.