This weekly piece of industry analysis and thought leadership is brought to you by the expert team at CEX.IO, your crypto guide since 2013. We’re committed to helping users take advantage of more opportunities, with fewer steps along the journey.
In this edition, CEX.IO analyzes Bitcoin’s ongoing limbo: Will the double bottom hold at $18,000, or are we going much lower following the Federal Reserve’s rate hike announcement? In the 32nd edition of our Crypto Ecosystem Update, we discuss the warning signs that have recently flashed for Bitcoin.
We additionally provide an Ethereum update following the successful completion of its Merge, as well as the latest on the Ripple lawsuit.
Read along for in-depth price analyses, and enjoy reviews of correlated markets to help you make the most informed decisions about your crypto journey.
Double bottom, or down into the abyss?
Following a massive pump on September 9, Bitcoin faced a violent rejection at the intersection of the rising channel resistance and the descending resistance, from June’s high. The entire price advance between September 9 and 12 was negated in a single day, with an 11% dump on September 13.
The price of Bitcoin has now devolved to a double bottom pattern in line with the $18,000 low on June 18. Although the Federal Reserve’s 0.75% funding rate hike on September 21 was within market expectations, future rate hikes, along with CPI announcements, could either confirm this double-bottom reversal or throw Bitcoin down the abyss towards much lower prices.
Massive rejection at double resistance
After breaking down from a horizontal consolidation range between $18,500 and $19,500, Bitcoin surprised everyone on September 9 with a whipsaw, explosive move to $22,700.
$22,700 is the level where both the rising channel resistance from the summer (the white channel in the chart below), and the descending resistance from June’s high (the yellow line) intersect. That double resistance caused a large sell-off when Bitcoin hit that level, crashing it to as low as $18,230 on September 19.
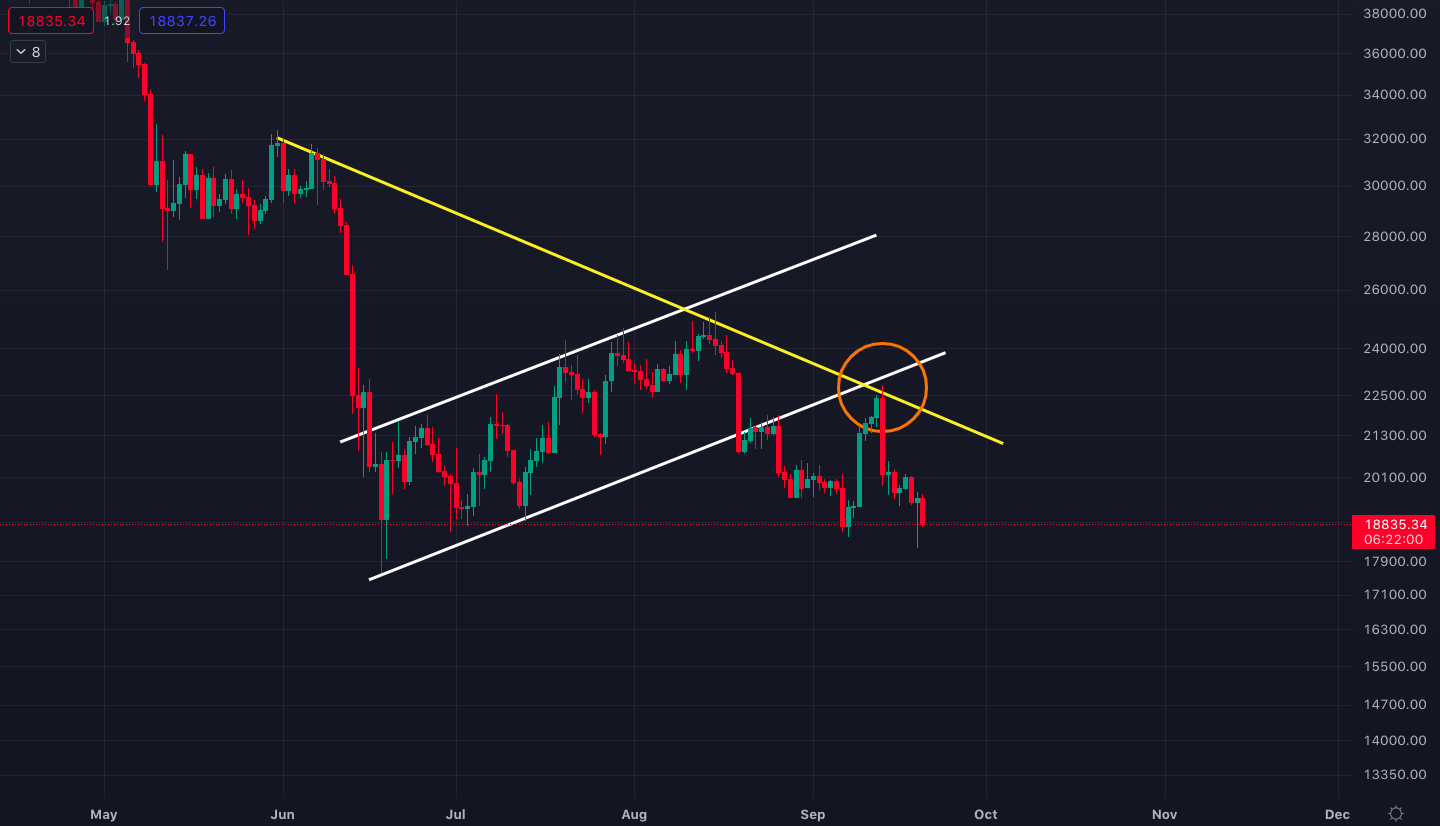
Bitcoin chart with the rising channel resistance (white) and the descending resistance (yellow). Source: Tradingview.
Rejection at the 200-week moving average
Another major resistance where Bitcoin experienced rejection is the 200-week simple moving average (SMA).
The price of Bitcoin fell below this historical support line during June’s capitulation and climbed back above it during an August rally.
However, it failed to remain above the line after crashing down from a rising wedge on August 17. The $22,700 top on September 12 was exactly where the 200-week SMA had passed, so Bitcoin was rejected at this major weekly moving average (see the chart below).

Weekly Bitcoin price chart and the rejection at the 200 SMA.
Rejections from major moving averages on larger time frames (weekly or monthly) are usually quite dangerous for financial assets. The 200-week SMA is such critical support in Bitcoin’s history that it never closed below this moving average line in a single week, until this year.
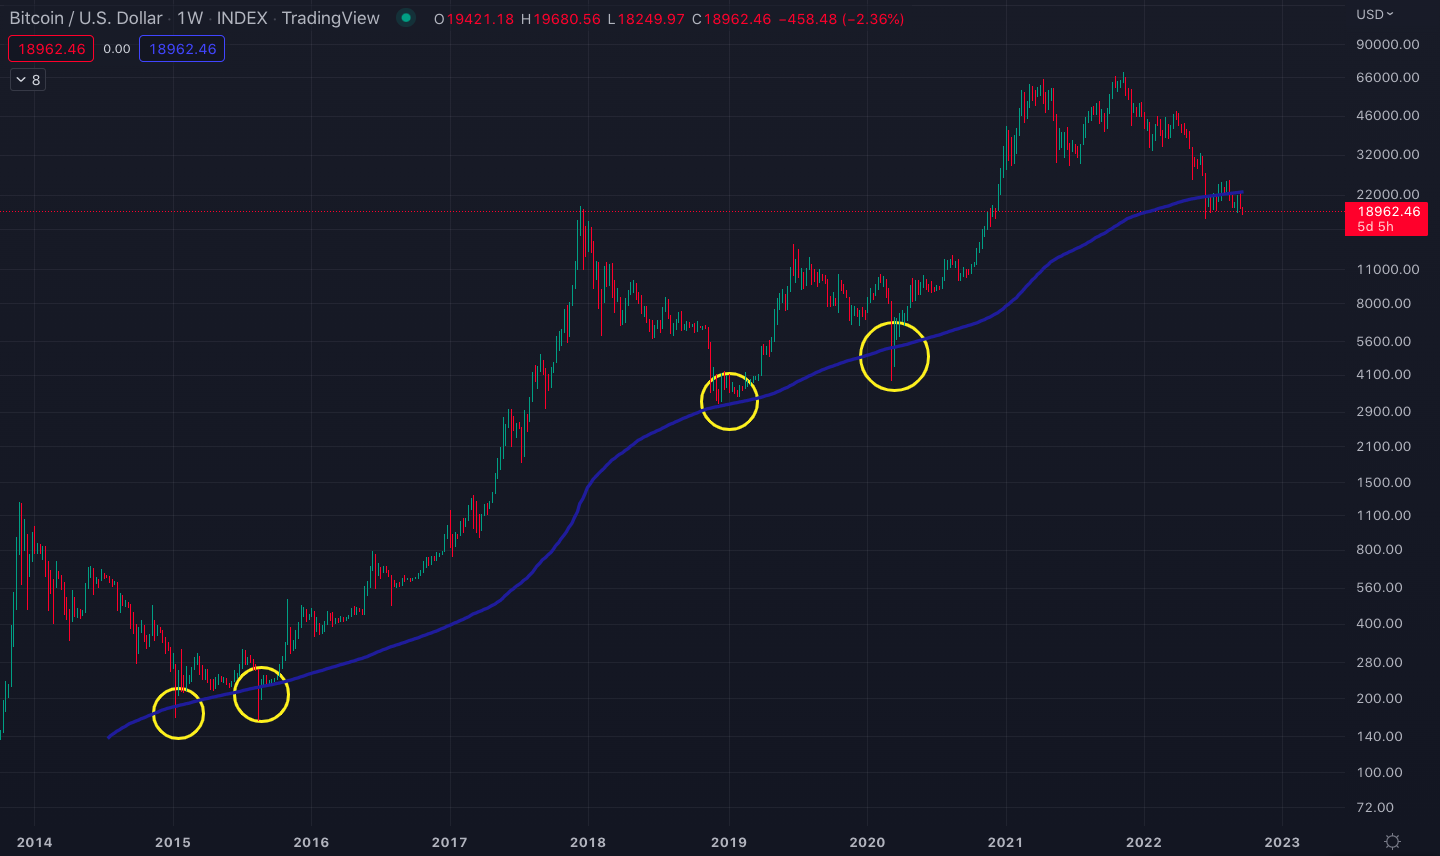
Previous bounces at the 200-week SMA line.
The decisive rejection the week of September 12 suggests persistence among sellers and weakness among buyers. This could spell trouble for Bitcoin unless the double bottom works in due course.
Bearish weekly engulfing candle
To make matters worse, the September 12 weekly candle was a bearish engulfing candle. A bearish engulfing candle is a red candle that has a lower closing price (i.e. larger body) versus the opening price of the green candle that preceded it. This means the momentum from the previous week is entirely lost.
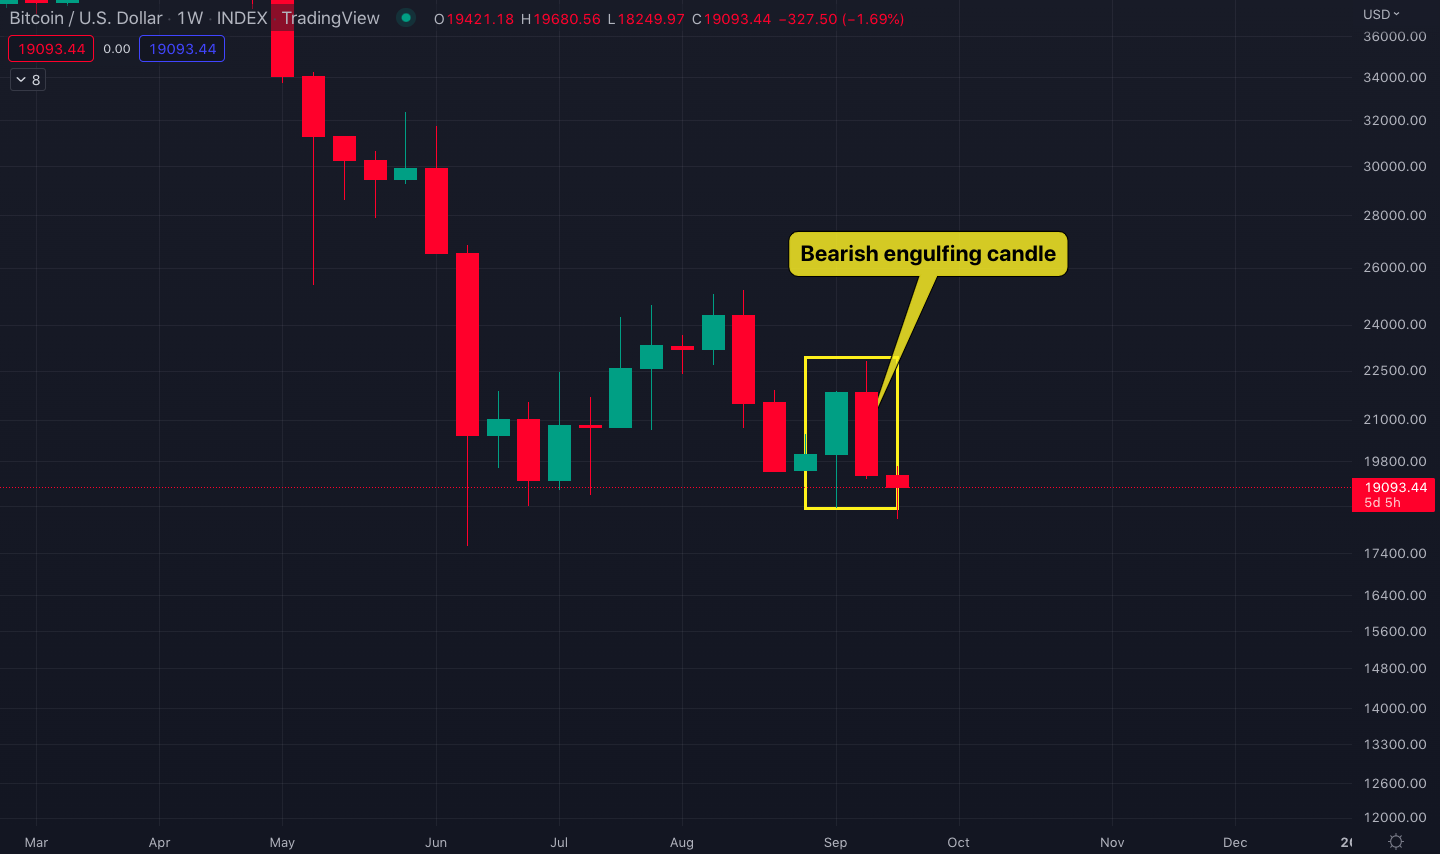
Bitcoin bearish engulfing candle on the week of September 12.
Double top in the weekly RSI
The relative strength index (RSI) measures the speed and magnitude of an asset’s recent price changes, to determine overbought and oversold conditions in the price of that asset.
RSI often acts as a precursor for future price action. Bitcoin’s weekly RSI topped at 37 when the price hit the resistance of the rising channel at $25,000 (the week of August 8). The RSI topped at 37 again last week when the price hit the descending resistance at $22,700.
A double top in the RSI with a lower-high price on the second top constitutes a negative divergence, as the momentum tops out at a lower price and indicates a reversal. This could result in the continuation of the major downtrend from the $69,000 all-time high, and a breakdown of the $18,000 level.

Weekly Bitcoin price and the RSI chart.
Weekly MACD bar turned light green
Moving average convergence divergence (MACD) is calculated by subtracting the 26-period moving average (MA), from the 12-period moving average. MACD triggers a buy crypto signal when the 26-period MA (the blue line in the chart below) crosses above the 12-period MA (the orange line), and a sell signal when the opposite happens.
On the other hand, the red and green candles at the center of the MACD chart indicate momentum. Growing dark green candles are a sign of growing momentum while shrinking light green candles indicate a waning.
Unfortunately, Bitcoin’s weekly MACD has been printing smaller light-green candles over the last two weeks (circled in yellow) which hints at a weakening momentum:
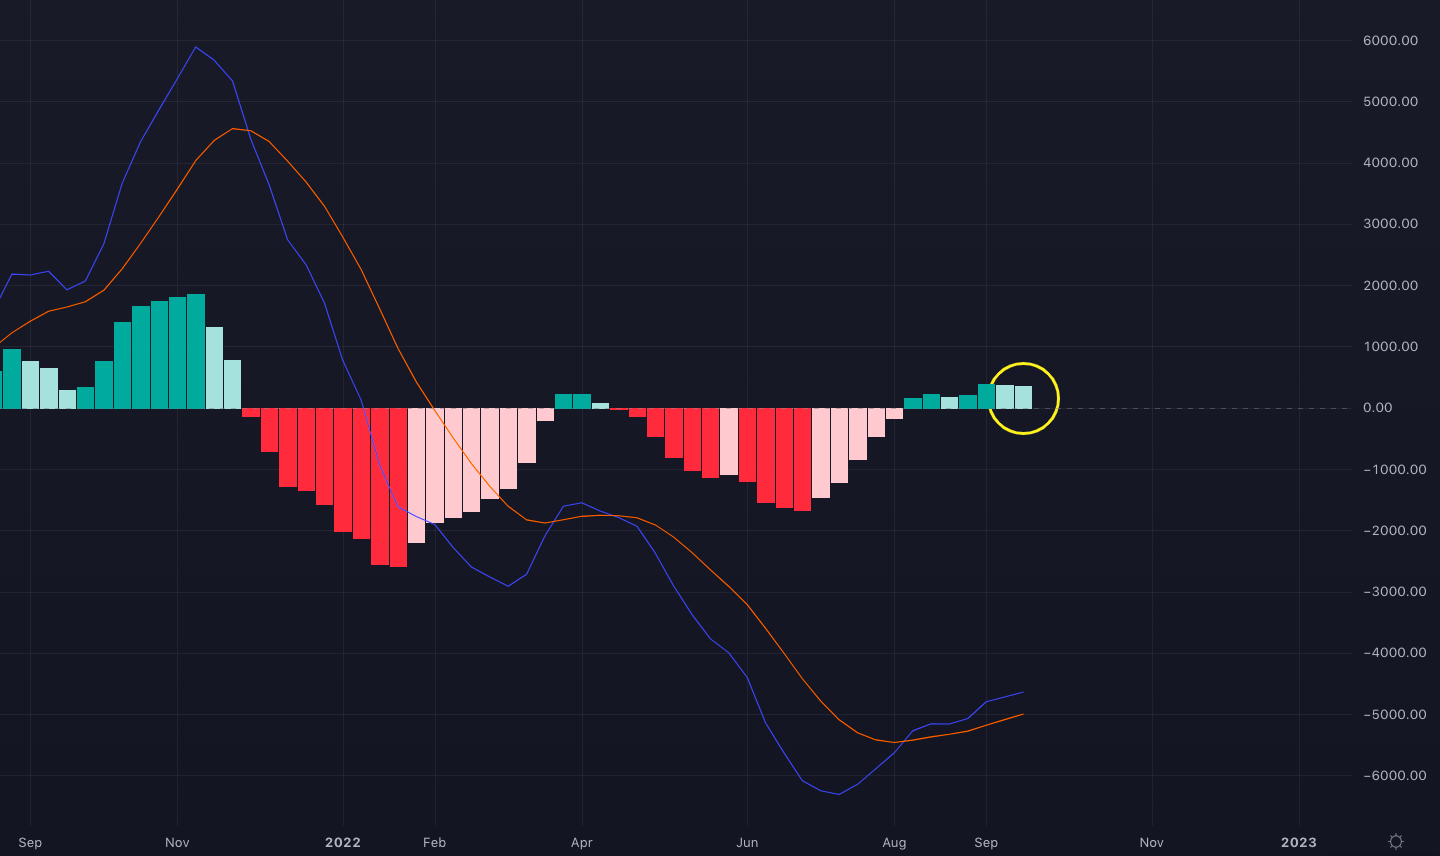
Weekly MACD chart for Bitcoin
Exchange balances on the rise
Bitcoin balances on crypto exchanges have dropped continuously since the COVID-19 crash in March 2020. However, these balances have experienced a strong bounce recently, with a potential rally to the red descending resistance line in the chart below.

Total Bitcoin balance in crypto exchanges. Source: Glassnode
When exchange cryptocurrency balances increase, it is often an indication of people selling their coins. So the recent spike in exchange Bitcoin balances could be bad news since Bitcoin is barely holding its historical support levels today.
Historical death cross on the SPX
On September 19, the S&P 500 stock index (SPX) made a death cross with the 200-day simple moving average (SMA), crossing down the 400-day SMA.
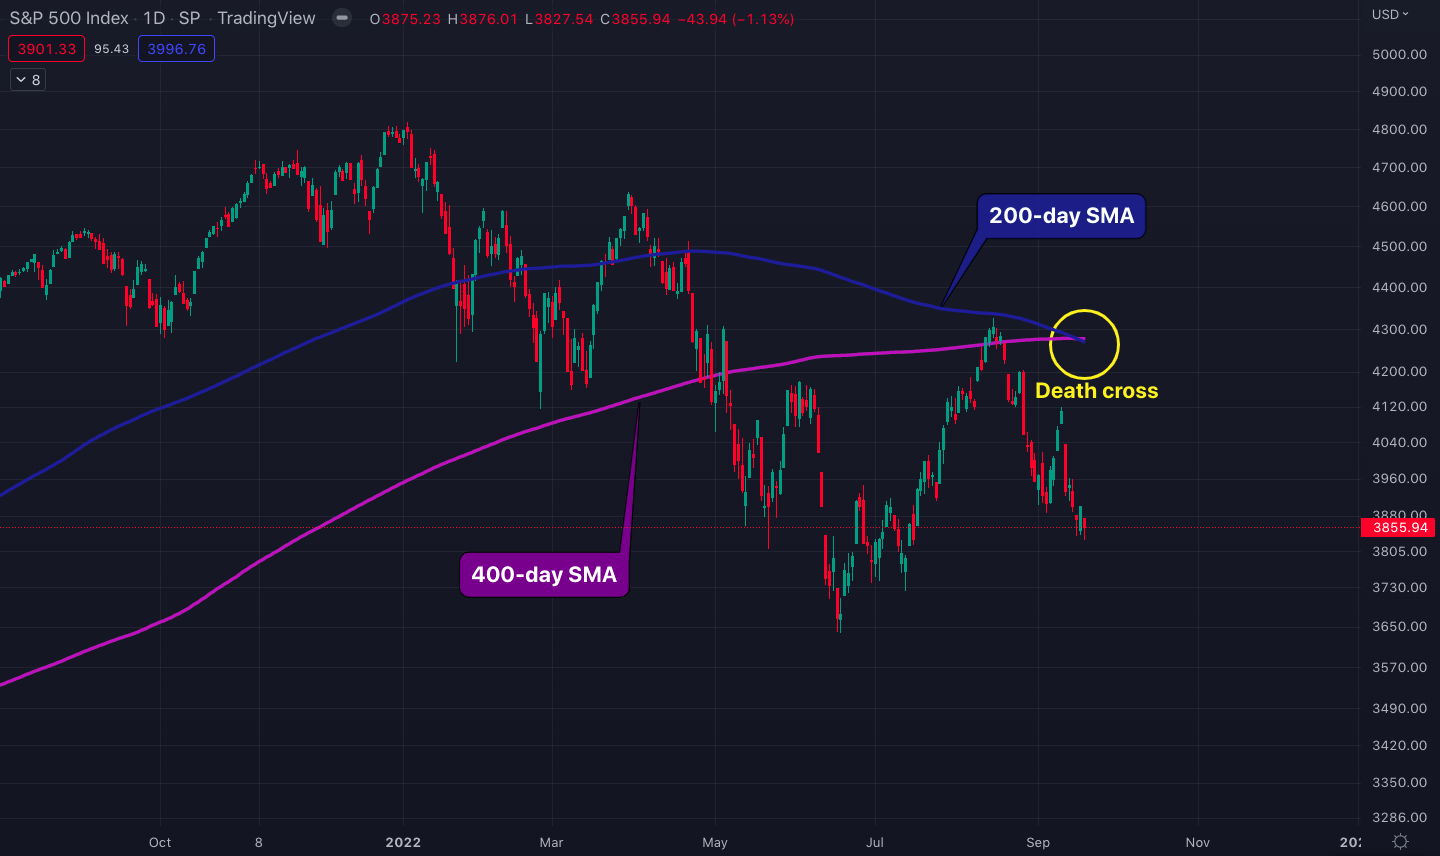
200-day SMA and 400-day SMA death cross on the S&P 500 chart.
Historically speaking, this is a very rare death cross for the S&P 500. The last time it happened was during the 2008 financial crisis in May of that year, following which the index fell by 50% over the next 10 months (from $1,350 to $675).
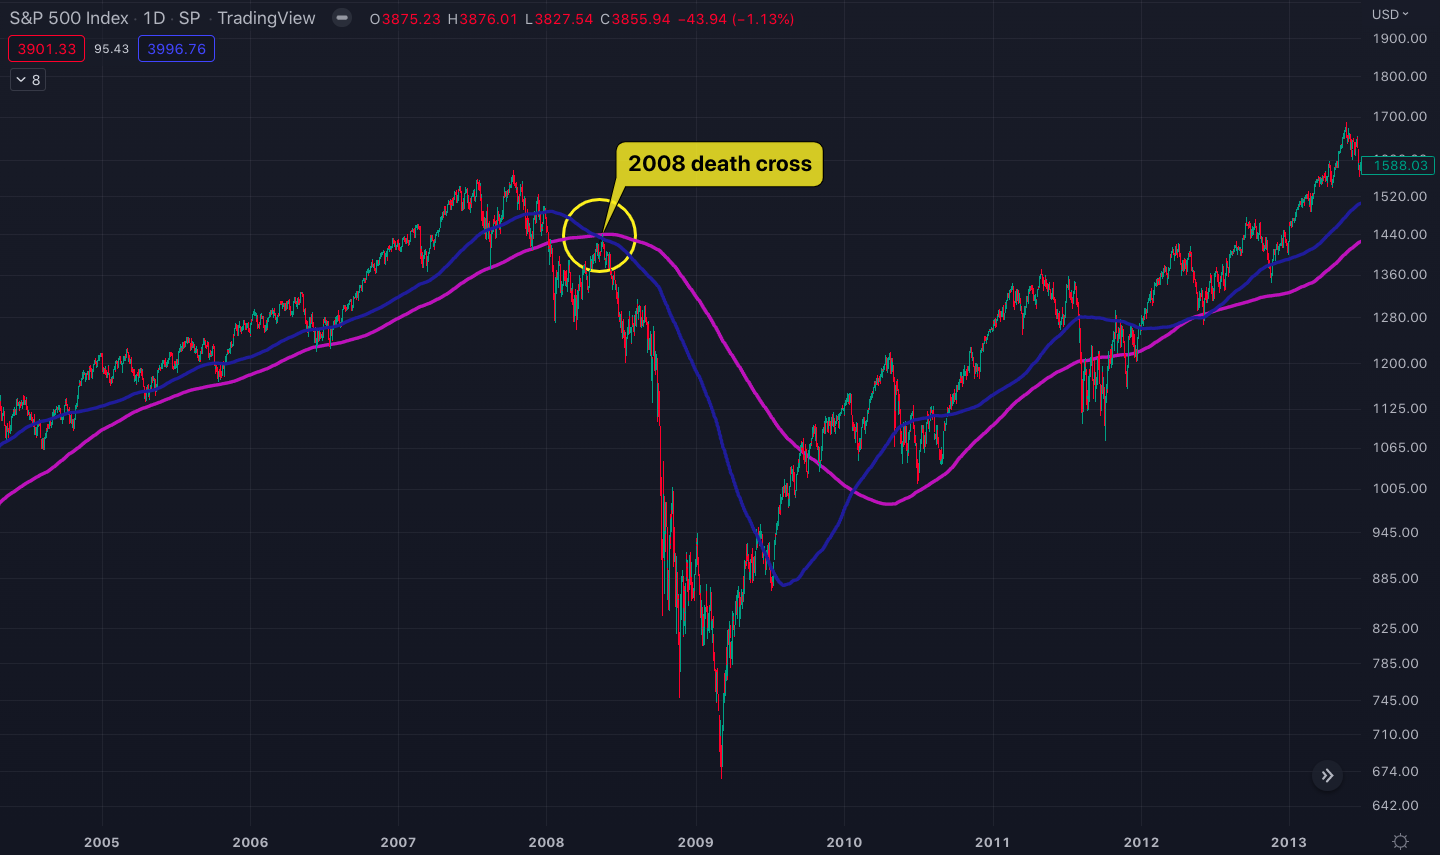
The same death cross in May 2008 followed by a 50% price crash
Considering the similarities between the macroeconomic environments of 2008 and 2022, SPX’s 200 & 400-day death cross could be a major warning sign for an upcoming liquidity crisis.
The moves of the S&P 500 are very critical, as the index represents the asset class that Bitcoin has been most closely correlated with.
Ethereum Merge – what happened to the “Moon”?
In contrast to the overall consensus before the event, Ethereum faced a sharp sell-off from $1,790 to $1,280 following the successful completion of its Merge.
The transition from the former proof of work (PoW) network, to the new proof of stake (PoS) model, has always been marketed as a deflationary move, as PoS validators could prefer staking their ETH holdings indefinitely, compared to PoW miners’ frequent redemption of mining rewards. However, the opposite has happened so far, as ETH balances on crypto exchanges just exploded after the Merge (circled in red in the chart below).
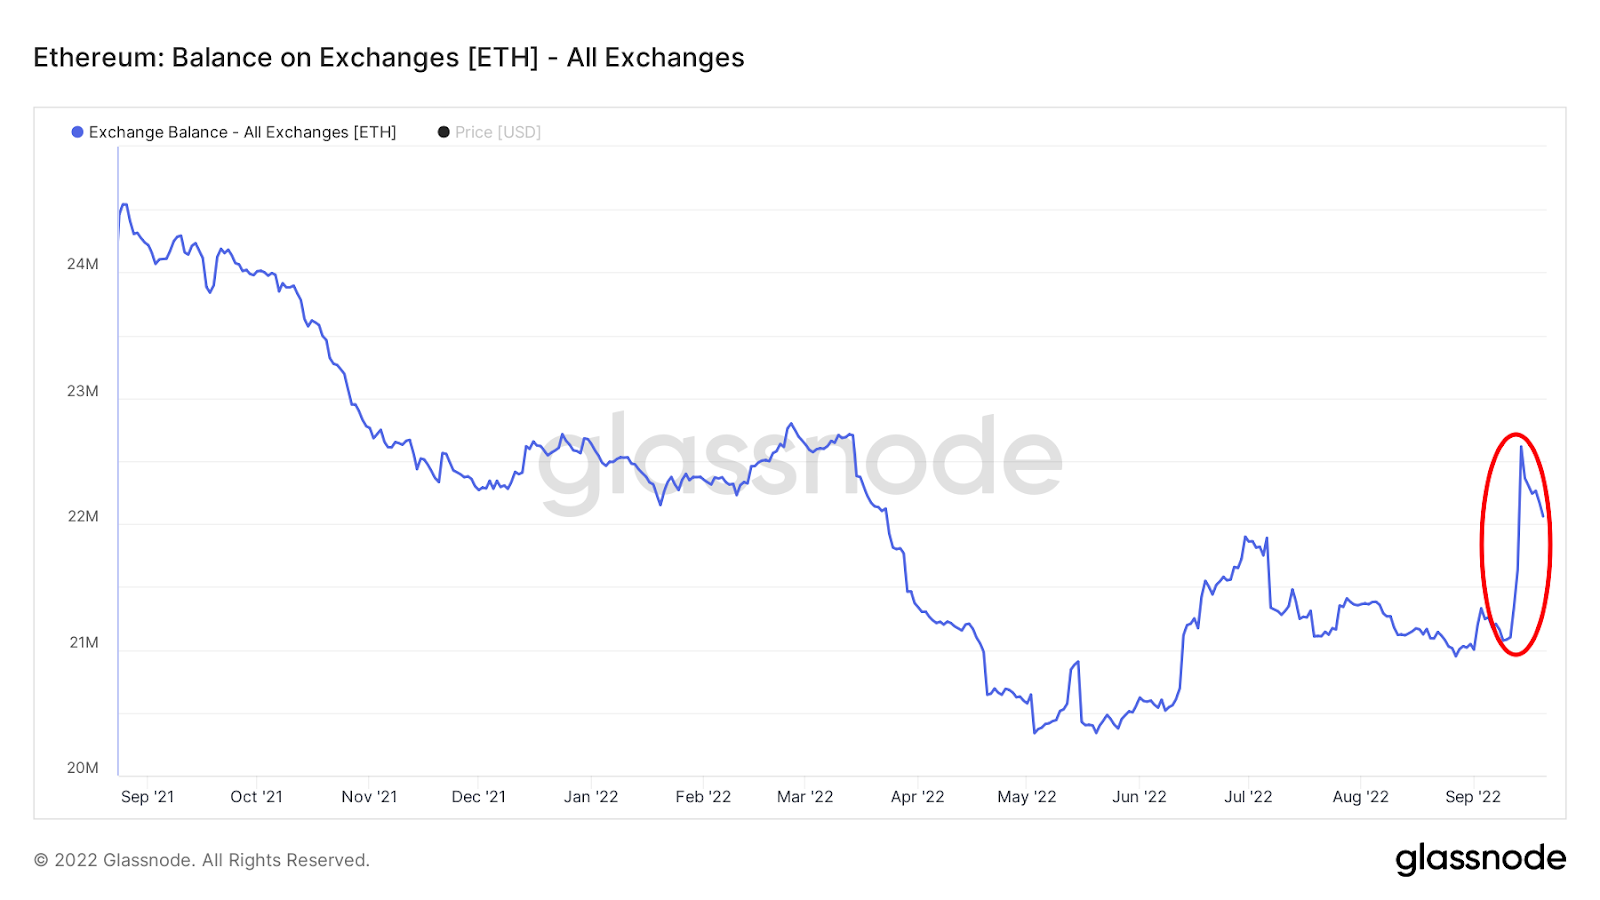
Total ETH balance on crypto exchanges. Source: Glassnode.
In addition, open interest for Ethereum is currently at an all-time high, having increased by almost 80% since early May. Open interest measures the number of outstanding option contracts for a financial asset that has not been settled yet.
In contrast to expectations for a decline post-Merge, there has been an even further incline in Ethereum open interest. This suggests that there are still too many open risk-hedging positions, which could create a long squeeze to the downside.

Ethereum open interest chart with the recent peak. Source: Glassnode.
XRP case heads for conclusion
The United States Securities and Exchange Commission (SEC) and Ripple Labs have both called for a federal judge to make an immediate ruling on whether Ripple’s XRP token violated U.S. securities laws.
The lawsuit has been in motion for two years, but both parties are now at the “enough is enough” stage, and have filed motions for a summary judgment without going to trial.
Expectations regarding the resolution of the lawsuit have created a boost in the price of XRP, despite the dominating bear market. XRP surged by 30% between September 16 and 22, in the wake of the call by Ripple Labs and the SEC.
If the court decision happens to be positive and XRP can close a week above $0.42, it could be clear skies until the major $0.80 resistance.

XRP/U.S. Dollar price chart on the daily time frame
Tune in next week, and every week, for CEX.IO’s latest Crypto Ecosystem Update. For more information, head to the Exchange to check current prices, or stop by CEX.IO University, to expand your crypto knowledge.
Disclaimer: Information provided by CEX.IO is not intended to be, nor should it be construed as financial, tax or legal advice. The risk of loss in trading or holding digital assets can be substantial. You should carefully consider whether interacting with, holding, or trading digital assets is suitable for you in light of the risk involved and your financial condition. You should take into consideration your level of experience and seek independent advice if necessary regarding your specific circumstances. CEX.IO is not engaged in the offer, sale, or trading of securities. Please refer to the Terms of Use for more details.