This week, CEX.IO takes a close look into Bitcoin’s recent consolidation between $19,500 and $20,500. In the 30th edition of our Crypto Ecosystem Update, we analyze which direction Bitcoin could ultimately break and where the target prices could be.
Additionally, we provide updates on Ethereum, Cardano, Terra Classic, and USD Coin.
Read along for in-depth price analyses and enjoy reviews of correlated markets to help you make the most informed decisions along your crypto journey.
Make or break point for Bitcoin
Since the Jackson Hole meeting on August 26, Bitcoin has been ranging inside a very tight price channel between $19,500 and $20,500. Statistically speaking, the longer a tight consolidation takes, the more violent the price breakout tends to be.
If the S&P 500 stock index opens the week with a loss, Bitcoin’s horizontal channel could break to the downside with a $17,500 target in the short term.
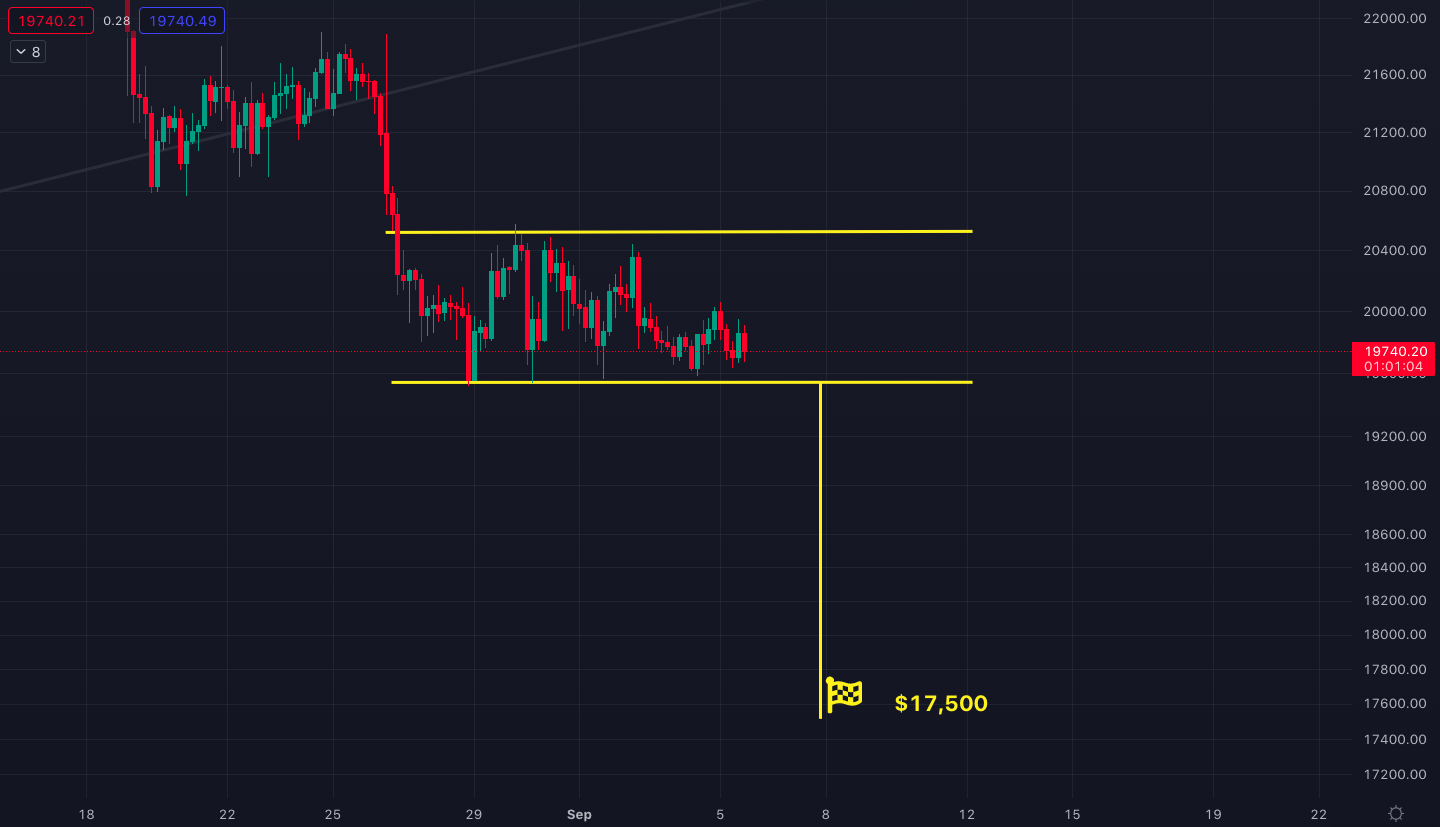
$17,500 target for Bitcoin if the horizontal channel breaks down. Source: Tradingview
However, if the S&P opens positive, the horizontal channel could break to the upside and head to the $22,000 resistance, which is the support line of Bitcoin’s previous rising channel. Bitcoin previously broke down from that rising channel on the day of the Jackson Hole meeting (see the chart below).
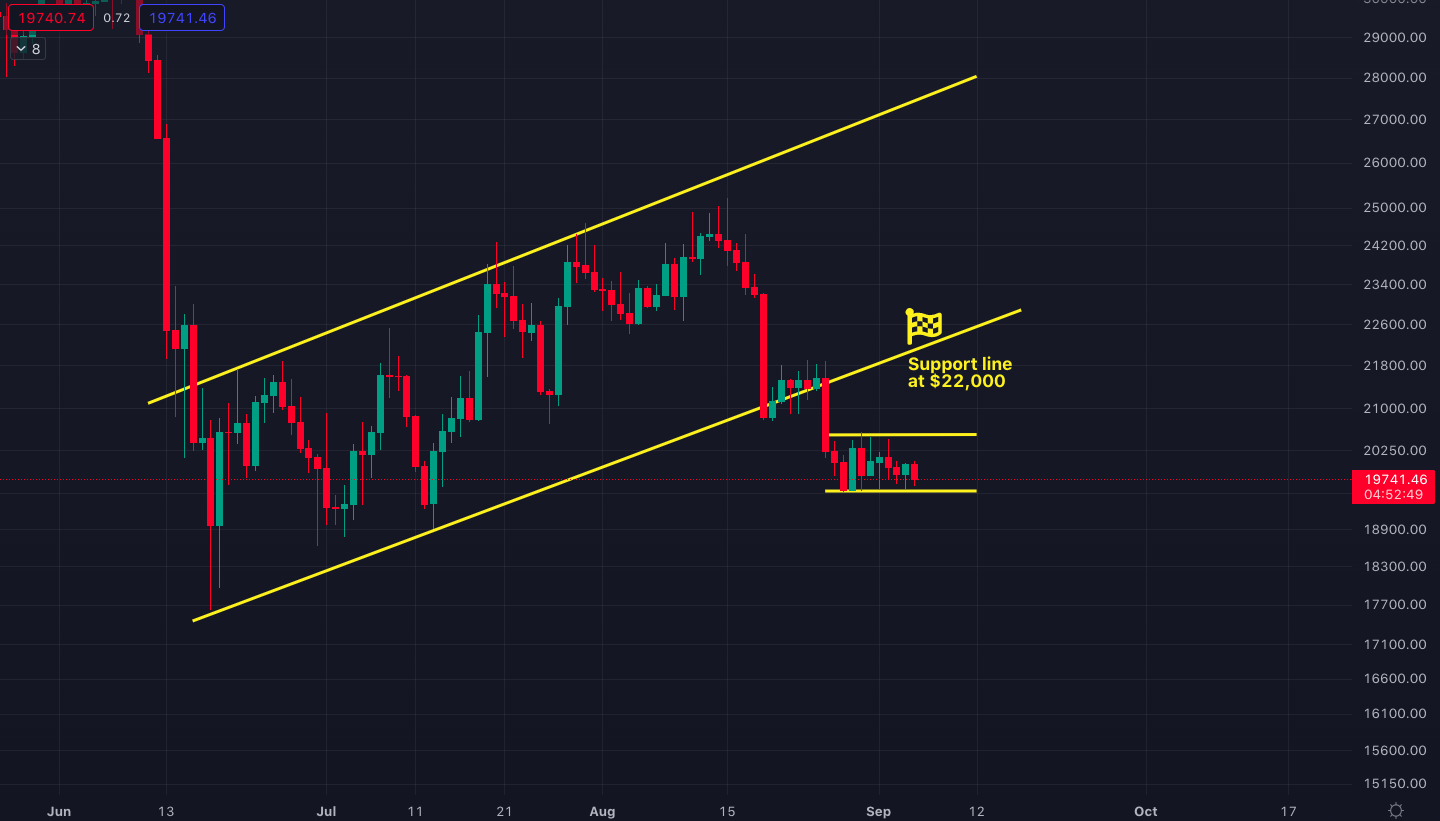
Support line of the previous rising channel at $22,000.
What happens at either of the two price levels ($17,500 or $22,000) is likely to determine Bitcoin’s next major trend over the coming weeks or even months. Breaking below $17,500 could lead to $12,000 – $13,000 and breaking above $22,000 could lead to $30,000.
Triple bottom and triple top
Following the Jackson Hole crash, Bitcoin bounced from $19,500 three times in a row which constitutes a triple bottom. Triple bottoms are often considered a bullish reversal pattern.
On the flip side, the ongoing horizontal channel also saw a triple top at $20,500. Likewise, triple tops are considered bearish reversal formations.
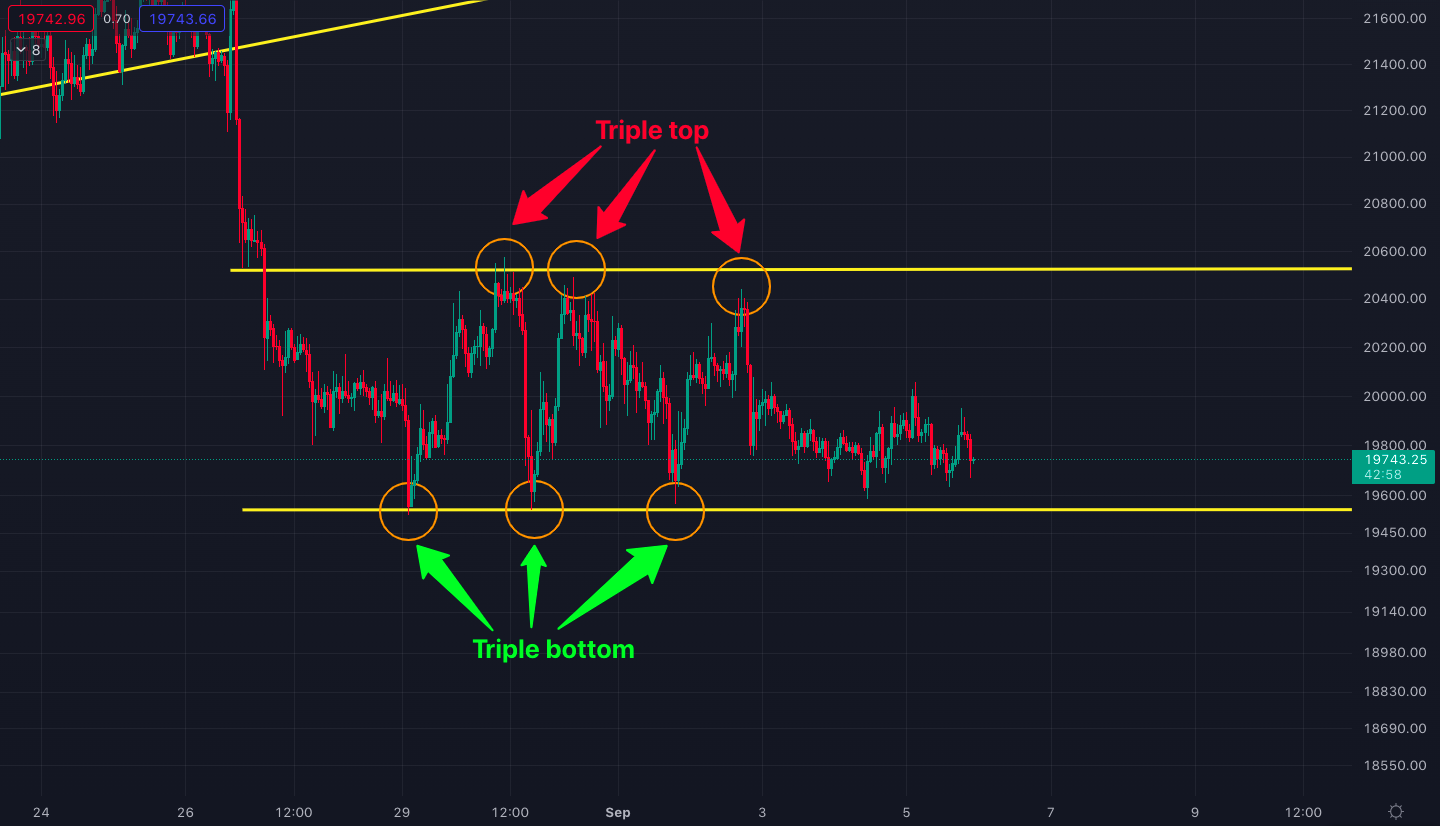
Triple bottom and triple top on Bitcoin’s horizontal channel.
Due to the current horizontal channel, it’s anyone’s call right now in terms of which direction Bitcoin could break.
Descending triangle
A point of concern regarding Bitcoin’s flat consolidation is the currently forming descending triangle.

The view of the descending triangle on the 2-hour time frame.
Descending triangles are usually continuation patterns. Since we have been in a long-term downtrend, it could be more likely for the current triangle to break down.
Considering this, if the descending triangle pattern is monitored in tandem with the horizontal channel, it could be used to identify a possible breakdown in the upcoming days.
Weekly bearish engulfing candle
Bitcoin recorded a bearish engulfing candle on the week of August 15. A bearish engulfing candle is a red candle that has a lower closing price (i.e. larger body) than the opening price of the green candle that preceded it. This means the momentum from the previous week is entirely lost since bearish engulfing candles are usually considered bearish reversal candles.

Weekly Bitcoin/U.S. Dollar price chart with the bearish engulfing candle.
Unfortunately, there was no green candle on the following week to dilute the negative price movement and Bitcoin closed the week of August 22 with another fat red candle (see the chart above).
Then on the week of August 29, the price of Bitcoin attempted to climb back up but it was rejected at $20,500 three times in a row (the triple top on the horizontal channel).
Critical level to watch for the S&P 500
How the S&P 500 stock index starts the week on Tuesday, September 6 could be highly critical in determining Bitcoin’s next immediate direction. The S&P index fell to a low of $3,904 on Thursday, September 1, and had a bounce to $4,020 on Friday with the positive job data. However, the bounce was negated later in the day with Russia’s switching off the gas supply to Europe.
Currently, the index is forming a double-bottom pattern. If the $3,904 bottom is preserved upon Tuesday’s session opening, the index could have a relief rally to the $4,070 region, which could give Bitcoin the freeway to march to its $22,000 resistance (the support line of the rising channel).
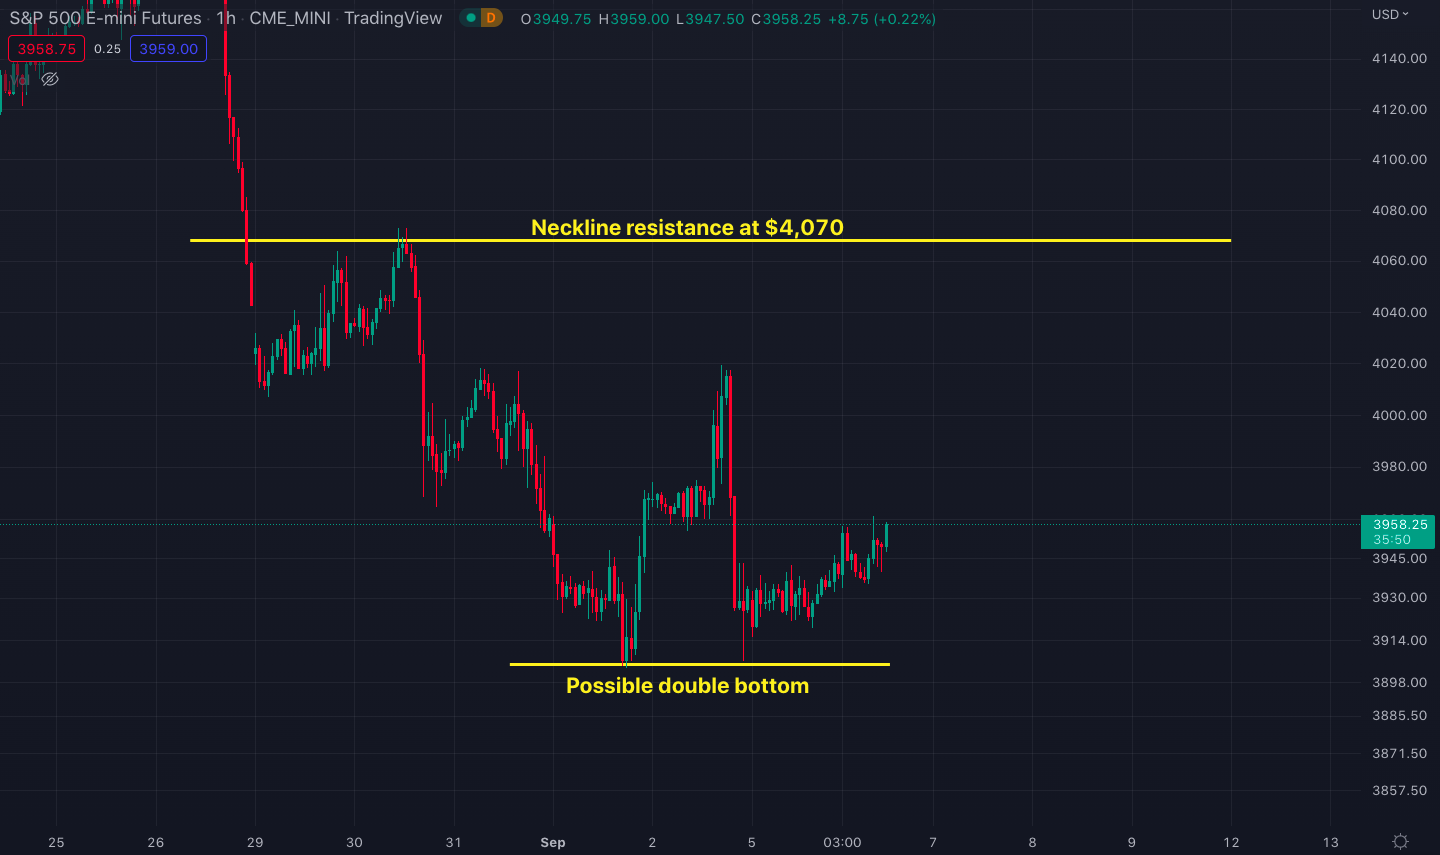
S&P 500 price chart on the hourly time frame.
Bond yields dumped
An interesting development during last Friday’s market dump was that U.S. bond yields took a hit as well. Bond yields and stocks/cryptocurrencies are typically inversely related assets as bonds constitute a risk-averse asset class.
However, there was a demand for U.S. bonds following Russia’s announcement which in turn dropped the yields – especially the 2-year bond yield:
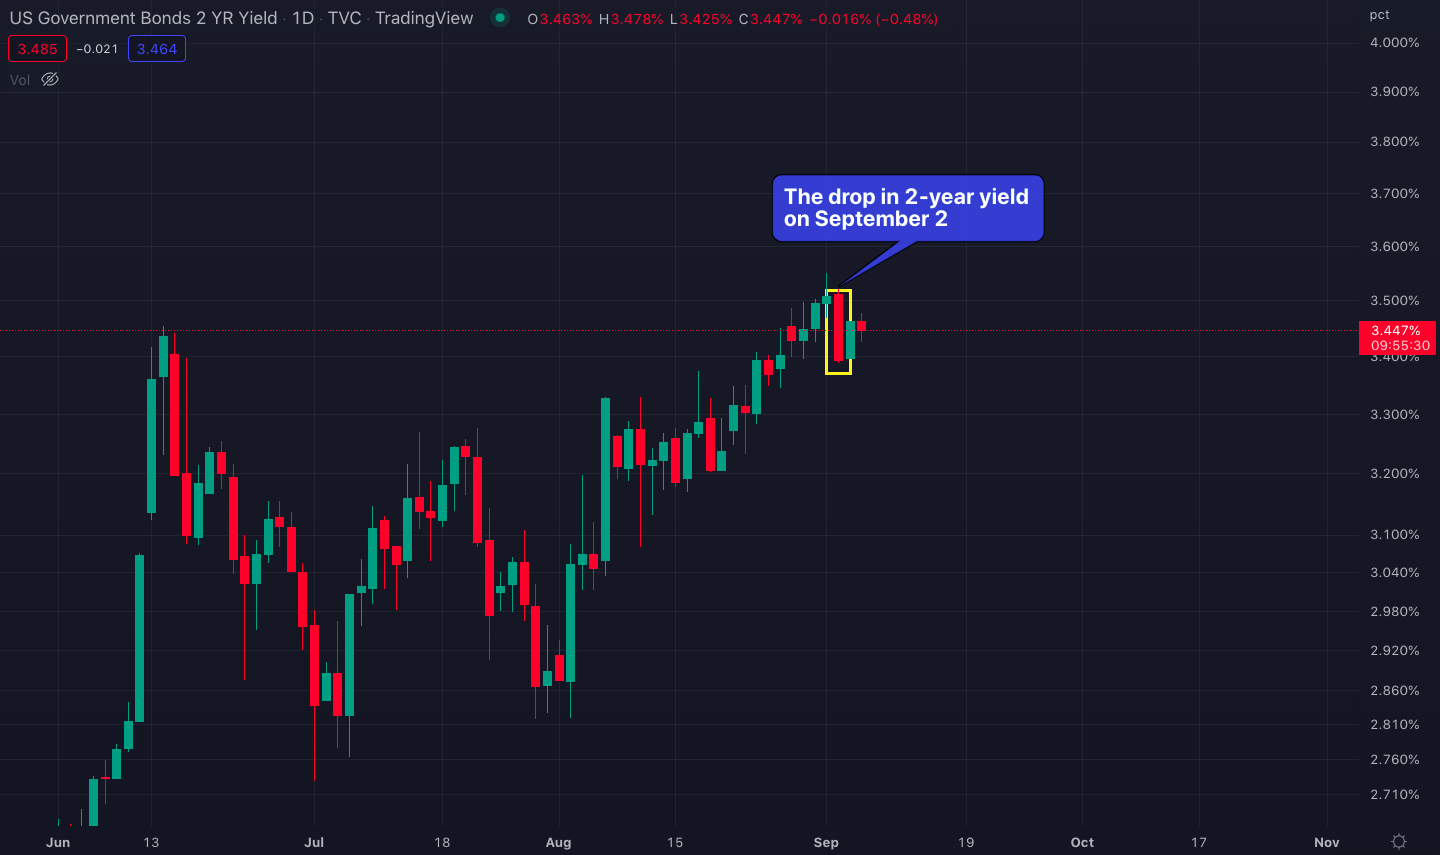
2-year U.S. bond yield chart on the daily time frame.
If the 2-year U.S. bond yield does not exceed the 3.5% top in the short term, it could make things easier for Bitcoin to climb up to its $22,000 resistance.
Bitcoin dominance
Bitcoin dominance is the ratio of Bitcoin’s market capitalization against the total cryptocurrency market value. Thus a higher dominance means a stronger Bitcoin and a weaker altcoin market.
Bitcoin dominance recently hit a very critical support level at 39%. This level is the descending channel support from the 2021 bull market where the dominance bounced off three times during the last 15 months (see the chart below).
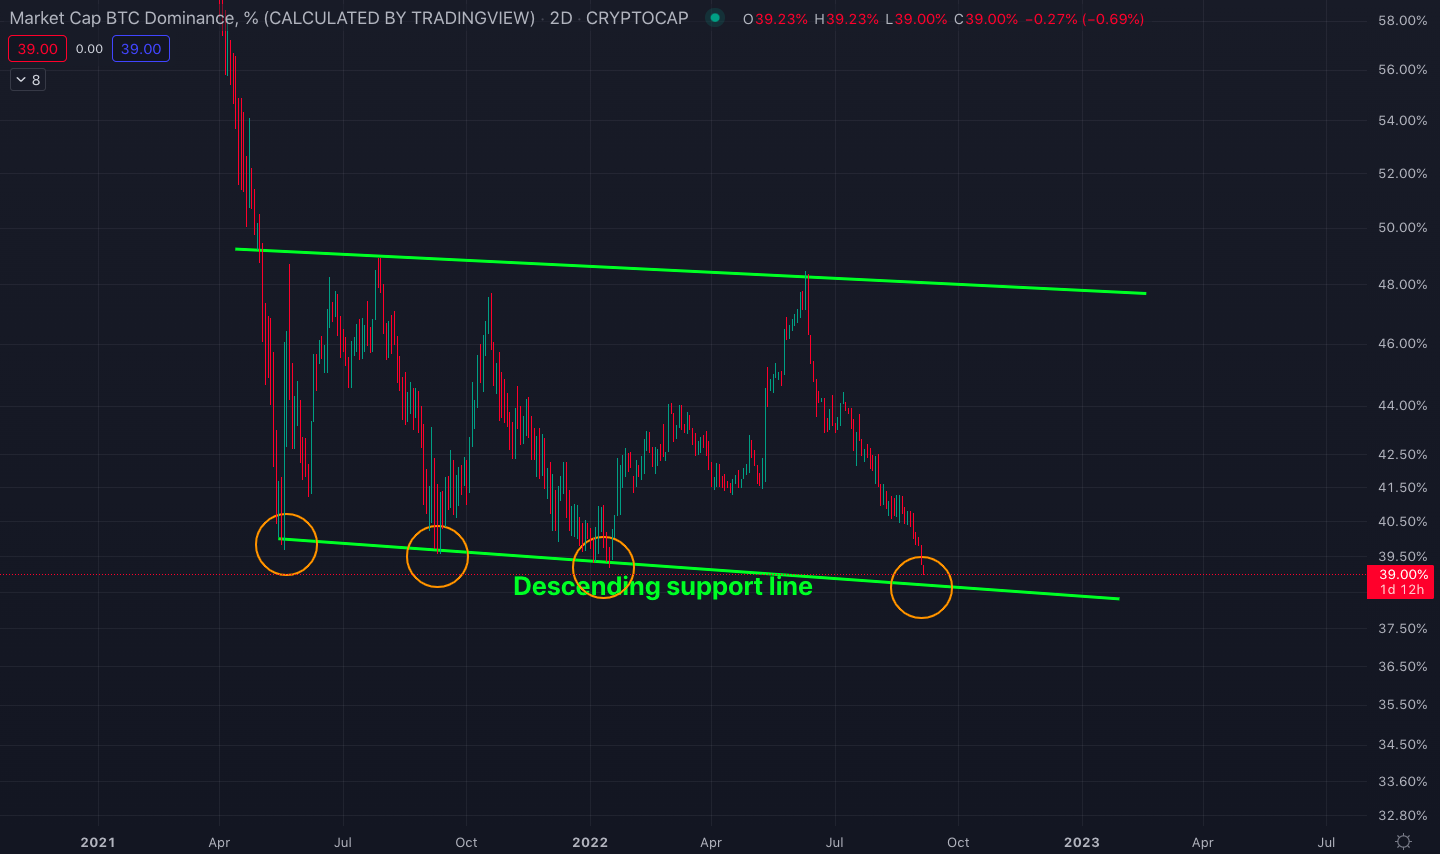
Bitcoin dominance chart with the descending support line and the three bounces off the line.
If the dominance bounces from the support again, a big move could be around the corner for Bitcoin.
If a new uptrend starts at the 38%-39% level, it will be the fourth time that the dominance heads to the channel resistance at 49%. Each time a resistance level is tested, the more likely it could break. Historically speaking, breaking from a long-term resistance could potentially result in a ferocious price movement.
Bitcoin dominance’s largest moves are usually recorded during large Bitcoin rallies or crashes. This pattern adds confluence to our earlier observation that a breakdown from current Bitcoin prices could result in a violent movement to as low as $12,000 or as high as $30,000 levels.
Ethereum miner balance at a four-year high
The Ethereum Merge is scheduled for September 15, moving the Ethereum blockchain from its current proof of work mining consensus to a proof of stake validator consensus.
In anticipation of the Merge, Ethereum miners have been adding to their Ether positions creating a new four-year high (see the chart below).
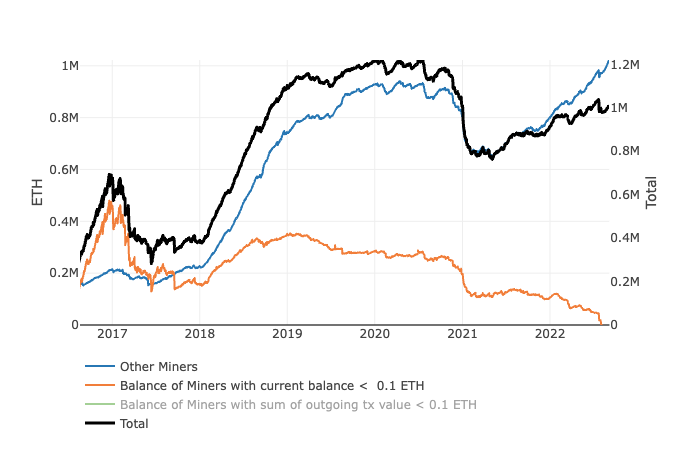
Ethereum miner balance during the last six years. Source: Santiment
There could be multiple reasons for miners to accumulate ETH. The most likely reason is the expectation of a price spike, although the Merge could just be another “buy the rumor, sell the news” event.
Another factor could be the expectation of a hard fork following the Merge. The majority of Ethereum miners are reportedly in favor of a hard fork to keep the current proof of work chain alive and continue mining. If a hard fork takes place, miners holding onto their ETH could receive an airdrop of the forked token which could reward them with additional capital.
Similarly, the open interest for Ether options has reached a new all-time high in anticipation of the Merge. Open interest shows the total number of outstanding options contracts that have not been settled. It is used as an indicator to evaluate the overall interest in a market.
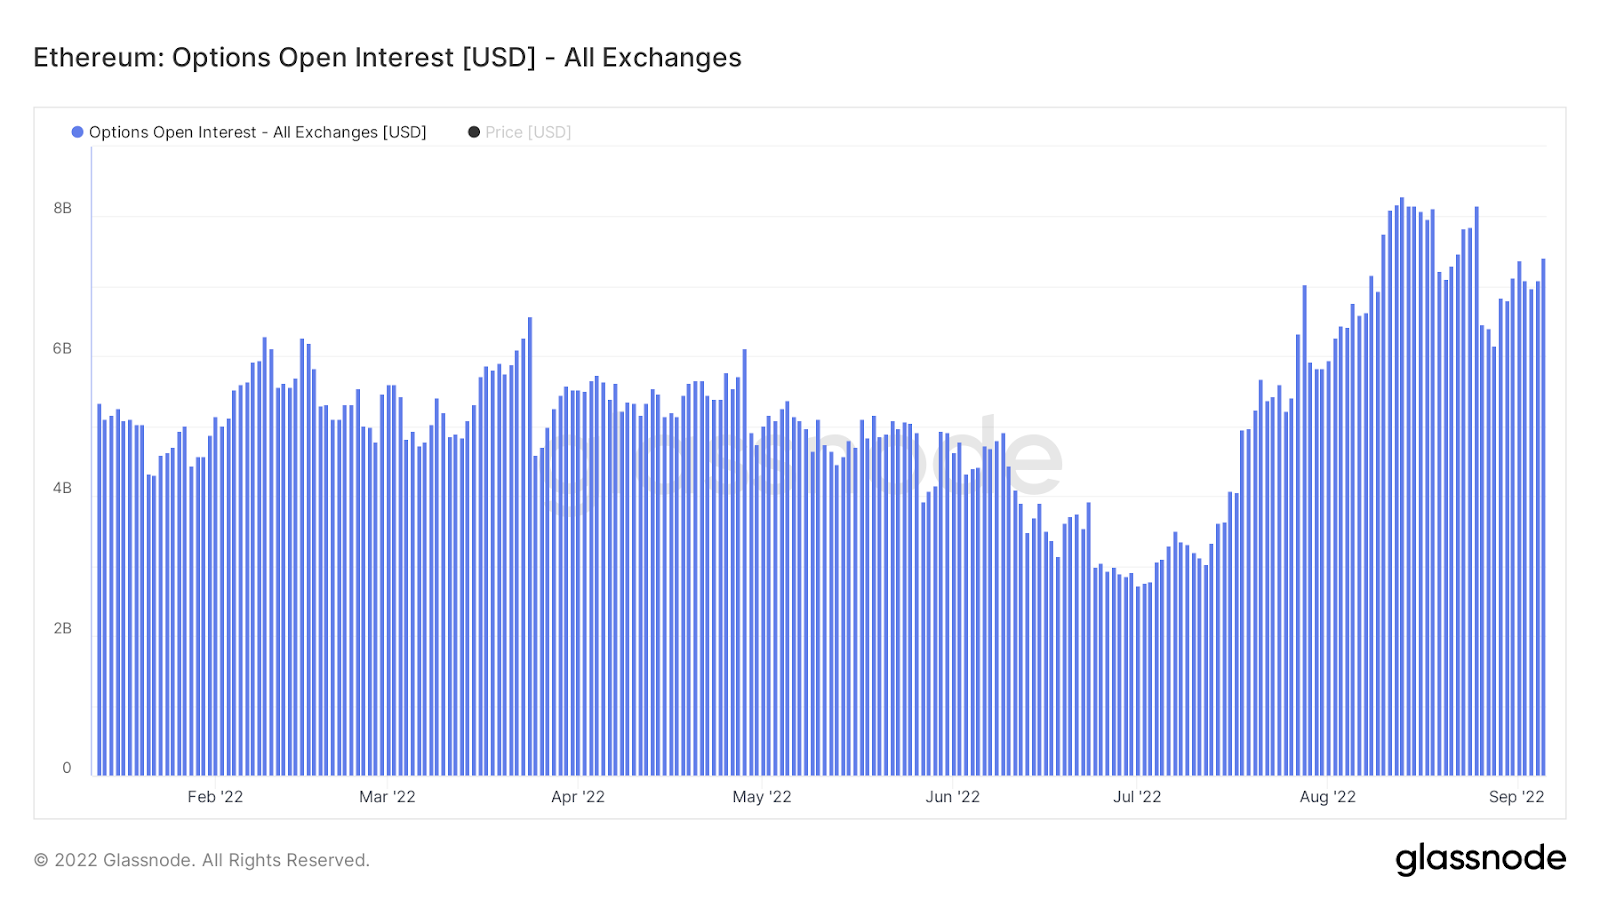
Options open interest chart for Ethereum. Source: Glassnode
On the flip side, although miners are hoarding ETH, their mining revenue is close to a new all-time low (circled in orange in the chart below). The only time it was lower than the current figure was in January 2020 (circled in red).
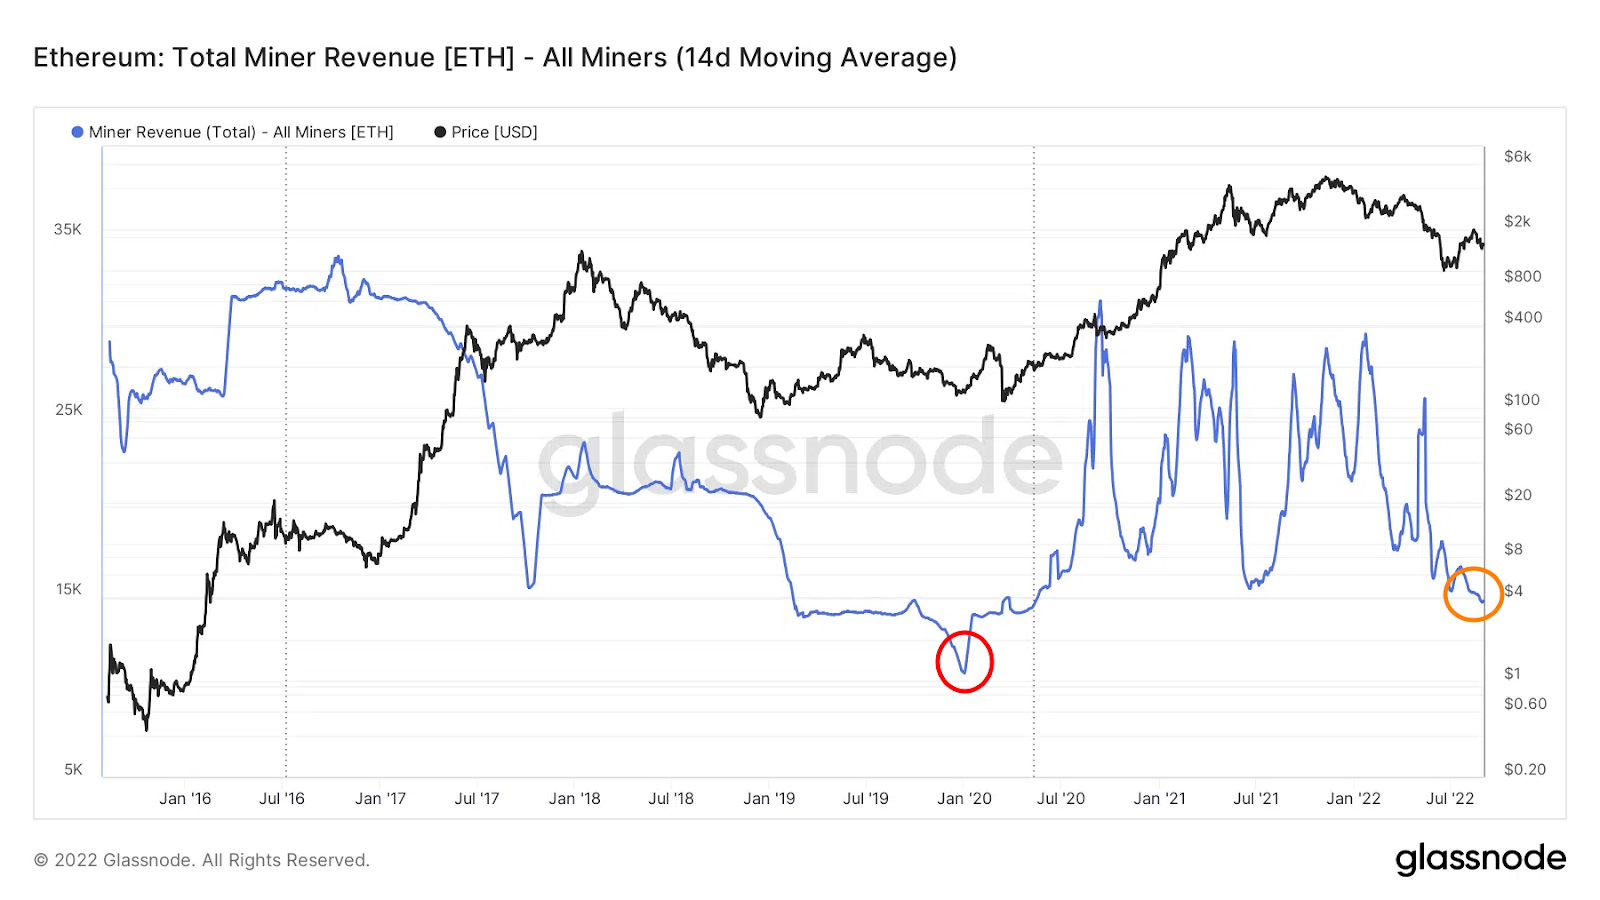
Total miner revenue and the ETH price chart. Source: Glassnode
The four-year-high miner balance despite all-time-low miner revenue shows an extremely strong conviction of Ethereum miners as they keep adding to their ETH balance.
Cardano hard fork confirmed for September 22
The Ethereum Merge may be right around the corner but so is Cardano’s Vasil hard fork.
According to the Cardano developer and operator Input Output Global (IOG), Cardano’s hard fork, Vasil, is scheduled for mainnet on September 22.
In a recent Twitter thread, IOG stated that Vasil will be “the most significant Cardano upgrade to date, bringing increased network capacity and lower cost transactions.”
Cardano was one of the shining stars of the 2021 bull market where its native ADA token surged by an astonishing 2,000% from January 1, 2021, until its all-time high on September 2, 2021.
ADA’s price action has remained notably weak since 2021 with small bounces throughout the year in-between Bitcoin’s relief rallies. The price dropped from $3.10 on September 2, 2021, to a low of $0.40 on June 18, 2022.
Many major cryptocurrencies have recorded dazzling rallies since the June 18 market bottom such as Polygon, Uniswap, and Aave, but Cardano failed to follow suit.
Polygon (MATIC) and Uniswap (UNI) surged by up to 200% while Aave (AAVE) increased by 150%. In the meantime, ADA could only bounce from $0.40 per token to a high of $0.55.
Will the Vasil hard fork turn the tides this time? Considering the apprehension that is currently dominating the crypto markets, it is more likely that Cardano could have to follow Bitcoin’s moves along with the Bitcoin dominance.
Why is Terra Classic pumping?
Terra Classic (LUNC) has been on a tear recently. The price of the token just exploded from $0.000085 on August 20 to a high of $0.00045 on September 6 (+400%).
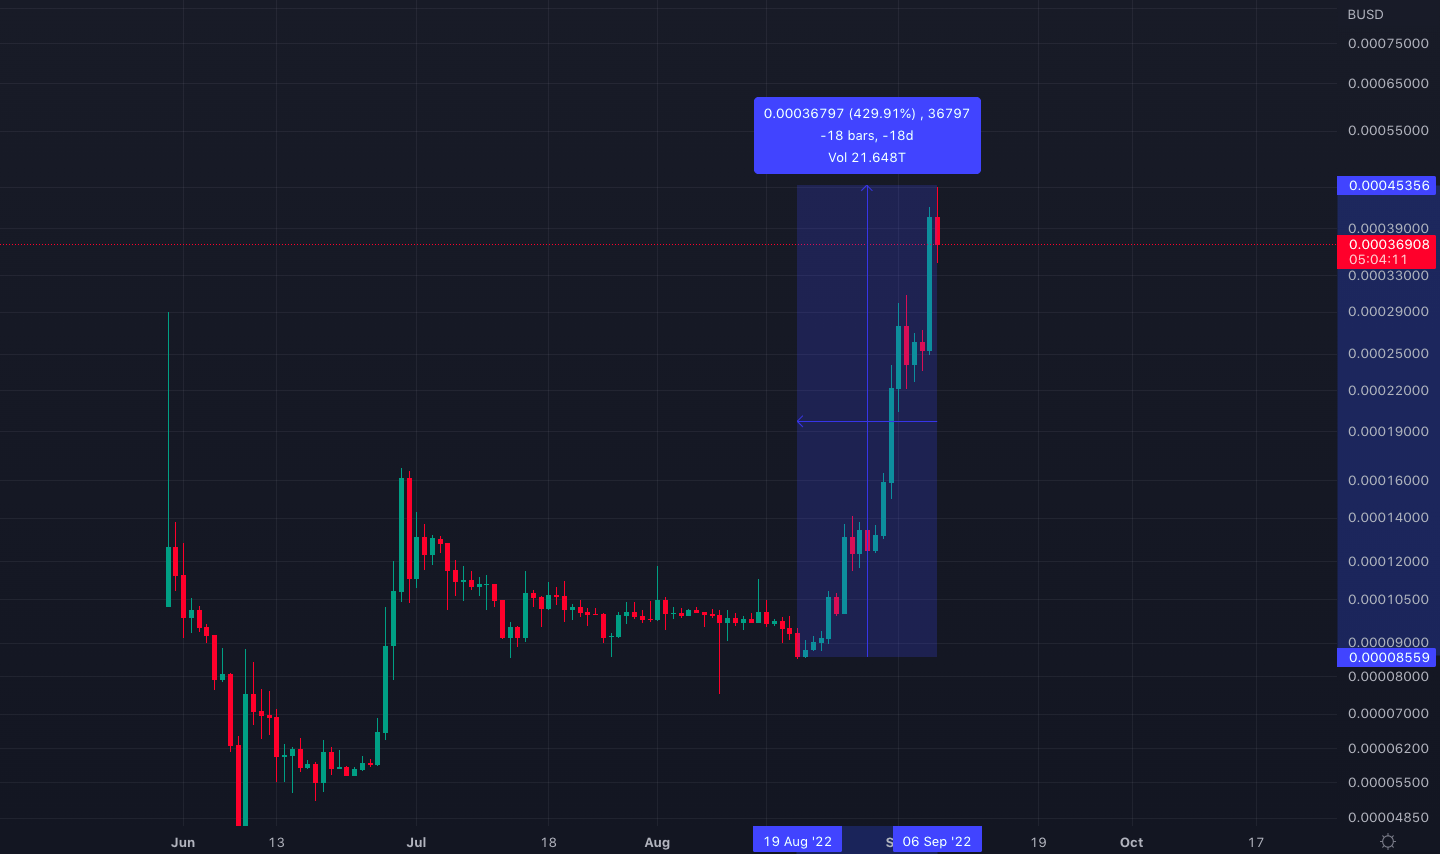
Terra Classic (LUNC) price chart with its over 400% parabolic move
There does not seem to be a single decisive reason for this parabolic price move, although some community-focused validators may have spent a portion of their validating profits to burn LUNC tokens.
If LUNC makes one more advance to the upside, $0.00070 could be the ultimate resistance as that level marked the top of the bounce on May 14 right after Terra’s collapse.
Liquidity headwinds for USD Coin
USD Coin (USDC), the second largest stablecoin after Tether (USDT) is at the risk of losing a major portion of its liquidity because Binance will convert all USDC balances of its customers to its own stablecoin, BUSD, and remove all USDC trading pairs as of September 29.
This decision erects a large obstacle for USDC and could remove a lot of the momentum it had in the race to overtake Tether (USDT) as the largest stablecoin in the market.
Tune in next week, and every week, for CEX.IO’s latest Crypto Ecosystem Update. For more information, head to the Exchange to check current prices, or stop by CEX.IO University, to expand your crypto knowledge.
Disclaimer: Information provided by CEX.IO is not intended to be, nor should it be construed as financial, tax, or legal advice. The risk of loss in trading or holding digital assets can be substantial. You should carefully consider whether interacting with, holding, or trading digital assets is suitable for you in light of the risk involved and your financial condition. You should take into consideration your level of experience and seek independent advice if necessary regarding your specific circumstances. CEX.IO is not engaged in the offer, sale, or trading of securities. Please refer to the Terms of Use for more details.