Bitcoin managed to preserve its $19,000 support level during the U.S. Consumer Price Index (CPI) announcement on July 13. It started its ascent following the announcement and climbed to as high as $22,800 on July 18.
The price got rejected at $22,800, making the $23,000-$23,500 levels very critical to watch. If Bitcoin cannot close above those levels, the current rising channel from the $17,600 bottom may end up as another bear flag. But if Bitcoin breaches the $23,500 resistance on a daily close, it could be clear skies to the 2021 bull market support at $28,000-$30,000.
Bitcoin’s holding of $19,000 as firm support brought some confidence back to the altcoin market, which was severely shaken back in May due to Terra’s collapse. The alpha cryptocurrency’s climbing back above the psychological $20,000 level caused many altcoins to explode in price, including major altcoins like Ethereum, Polygon, Aave, and Uniswap.
The next important date on the agenda is the Fed meeting on July 27. How Bitcoin will behave on that date around the $23,500 resistance level could dictate the direction of its next major move, as well as the direction of altcoins.
On a positive note, the U.S. Dollar Index (DXY) hit a major historical resistance on July 14 so the Index could take some time to cool off and accumulate if it is going to resume its strong bull trend in the upcoming months. US bond yields are also at key resistances and charts appear on the weaker side.
Bitcoin price analysis
Bitcoin has been moving inside a parallel rising channel since hitting the $17,600 bottom on June 18. Parallel rising channels are very tricky because they often end up as bear flags, which has been the case during both Bitcoin’s crash from $48,000 to $27,000 in May and the crash from $30,000 to $17,600 in June.
However, three little clues on the Bitcoin price chart suggest that things may play out differently this time.
- Adam and Eve reversal pattern
An Adam and Eve chart pattern is a reversal pattern that consists of two bottoms placed next to each other – a narrow, V-shaped bottom that is most likely a single-day downward spike (a possible bear trap) and a second bottom that is significantly wider and more rounded than the first V-shaped bottom.
The narrow, V-shaped bottom is the Adam bottom, while the longer, more rounded bottom is the Eve bottom. Although the depths of the two bottoms are similar, an Adam bottom resembles a cone and an Eve bottom resembles a cup.
In addition, technically speaking, trading volume on the Adam bottom has to be higher than the volume on the Eve bottom.
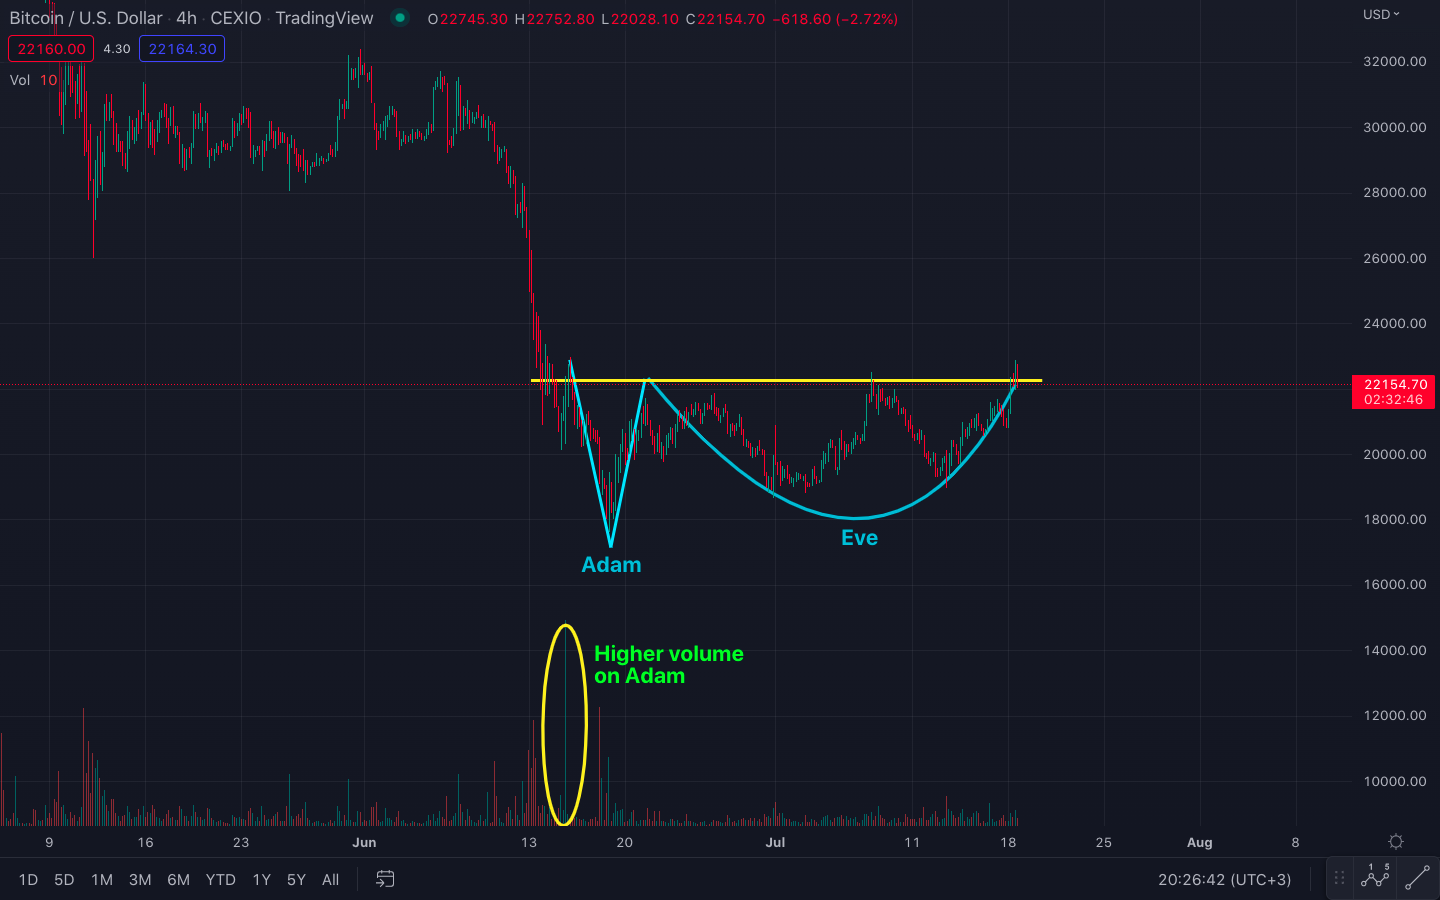
Bitcoin/U.S. Dollar price chart with the Adam and Eve pattern formation. Source: Tradingview
As you can see in the chart above, Bitcoin’s recent price action has been following a textbook-perfect Adam and Eve reversal pattern. If Bitcoin can continue to stay above the $22,000 horizontal neckline, it could then advance to the diagonal resistance at $23,500.
- Parallel rising channel
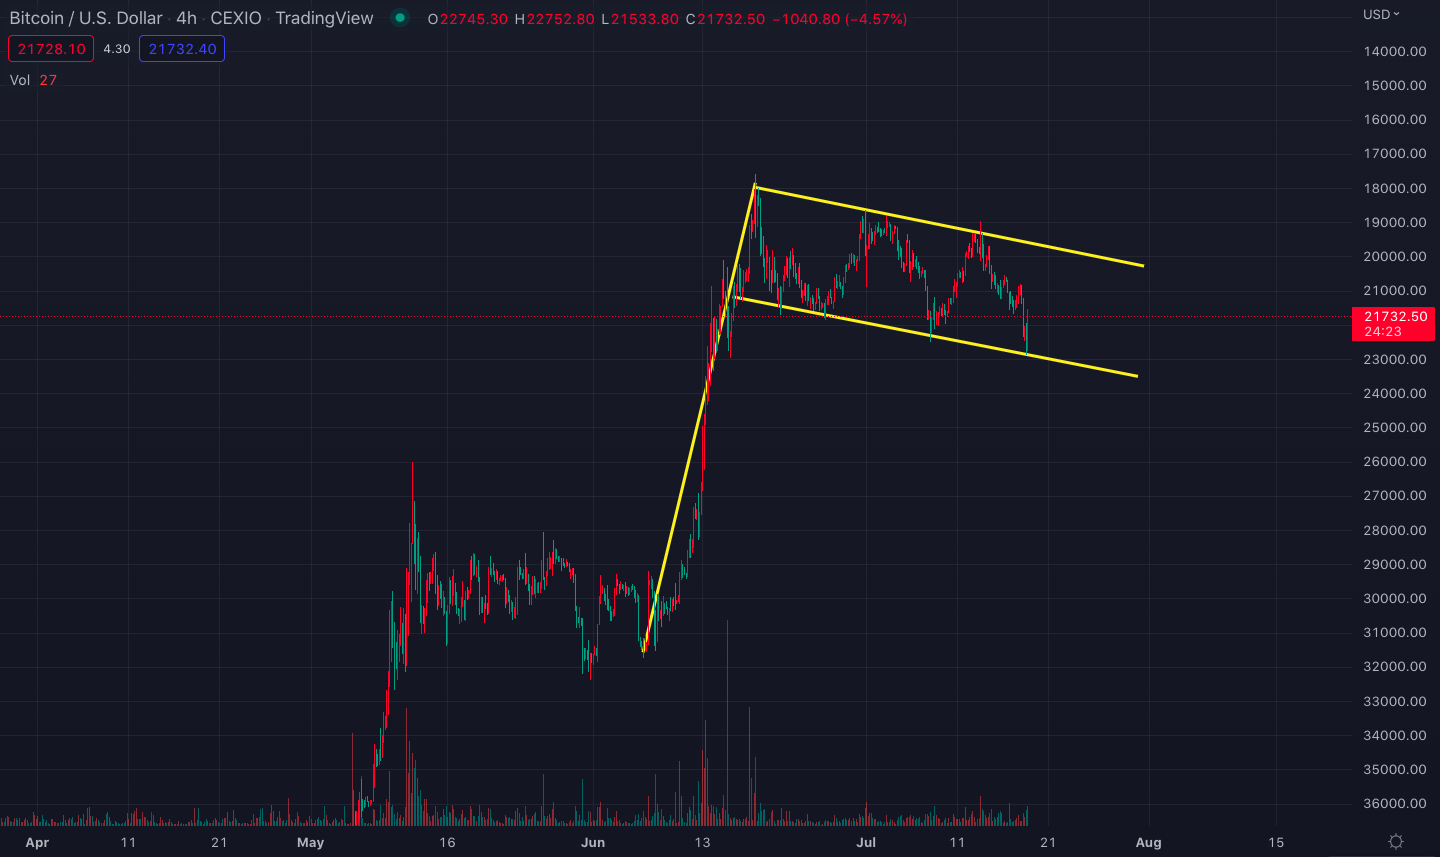
Below is the parallel rising channel that Bitcoin has been following since the $17,600 bottom.
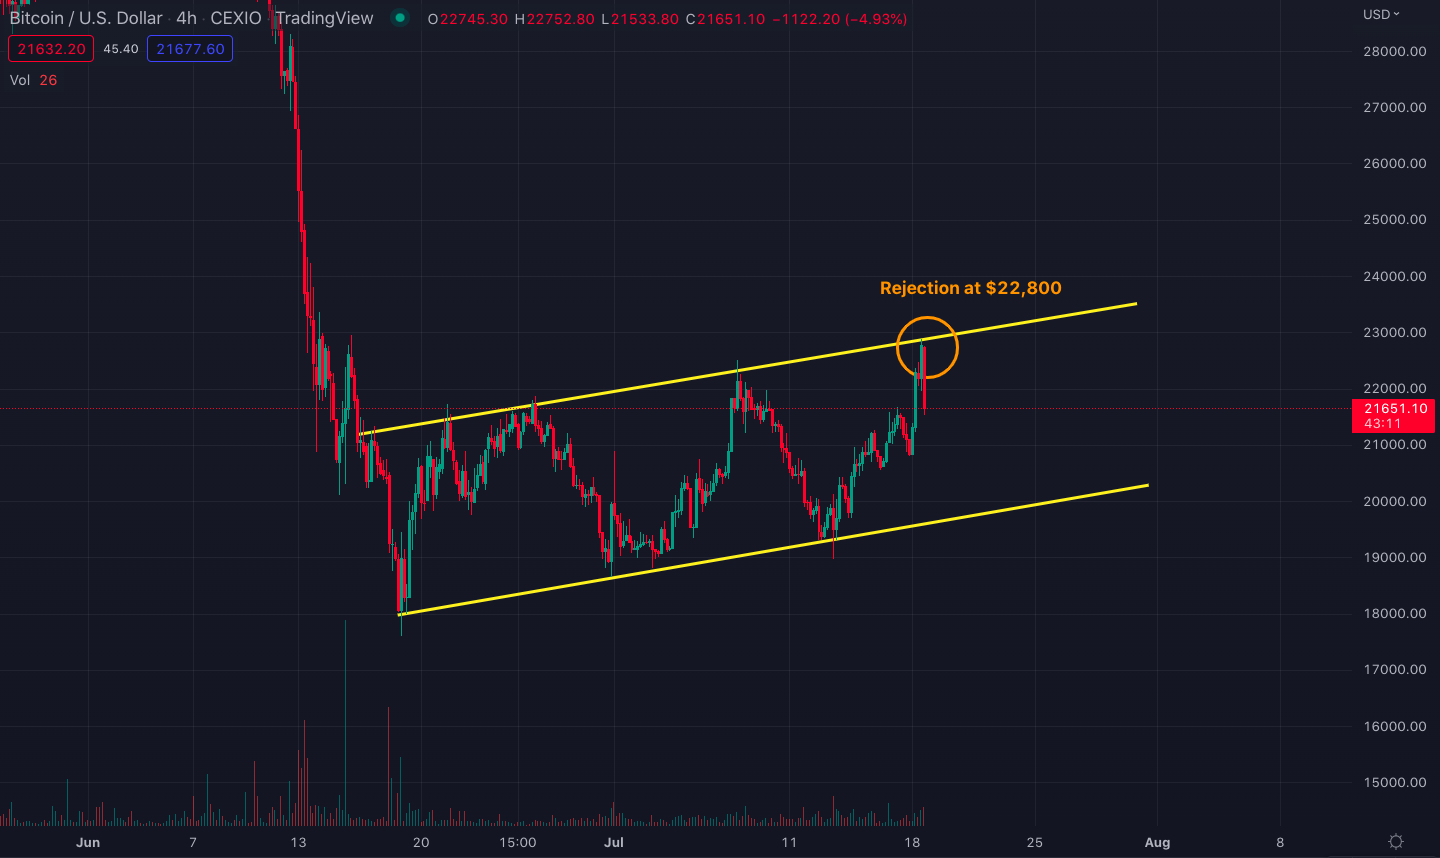
Bitcoin’s parallel rising channel getting rejected at $22,800 on July 18
If Bitcoin retraces further and fails to hold the bottom yellow support line at $20,000, the parallel rising channel may turn to a bear flag.
When you invert the Bitcoin/U.S. Dollar chart to get a clearer view of the possible flag structure, you can see an intact bull flag (see the chart below). However, note that the flag is getting too long as of now. When flags get too long, in other words, when the price spends too much time inside a channel, it can become more likely that the flag will fail.
Inverted Bitcoin/U.S. Dollar chart with the bull flag structure
So if Bitcoin can manage to spend more time inside the channel, it could become more likely that the current bear flag will fail and Bitcoin could instead surge upwards to the $30,000 resistance.
- Bounces off the first candle’s daily closing
A small detail worth noting is that on the daily price chart, bounces from retracements (following the $17,600 bottom) happened at exactly the same price level as June 18’s closing. These are specifically the bounces between June 30 and July 4, and the bounce on July 13.
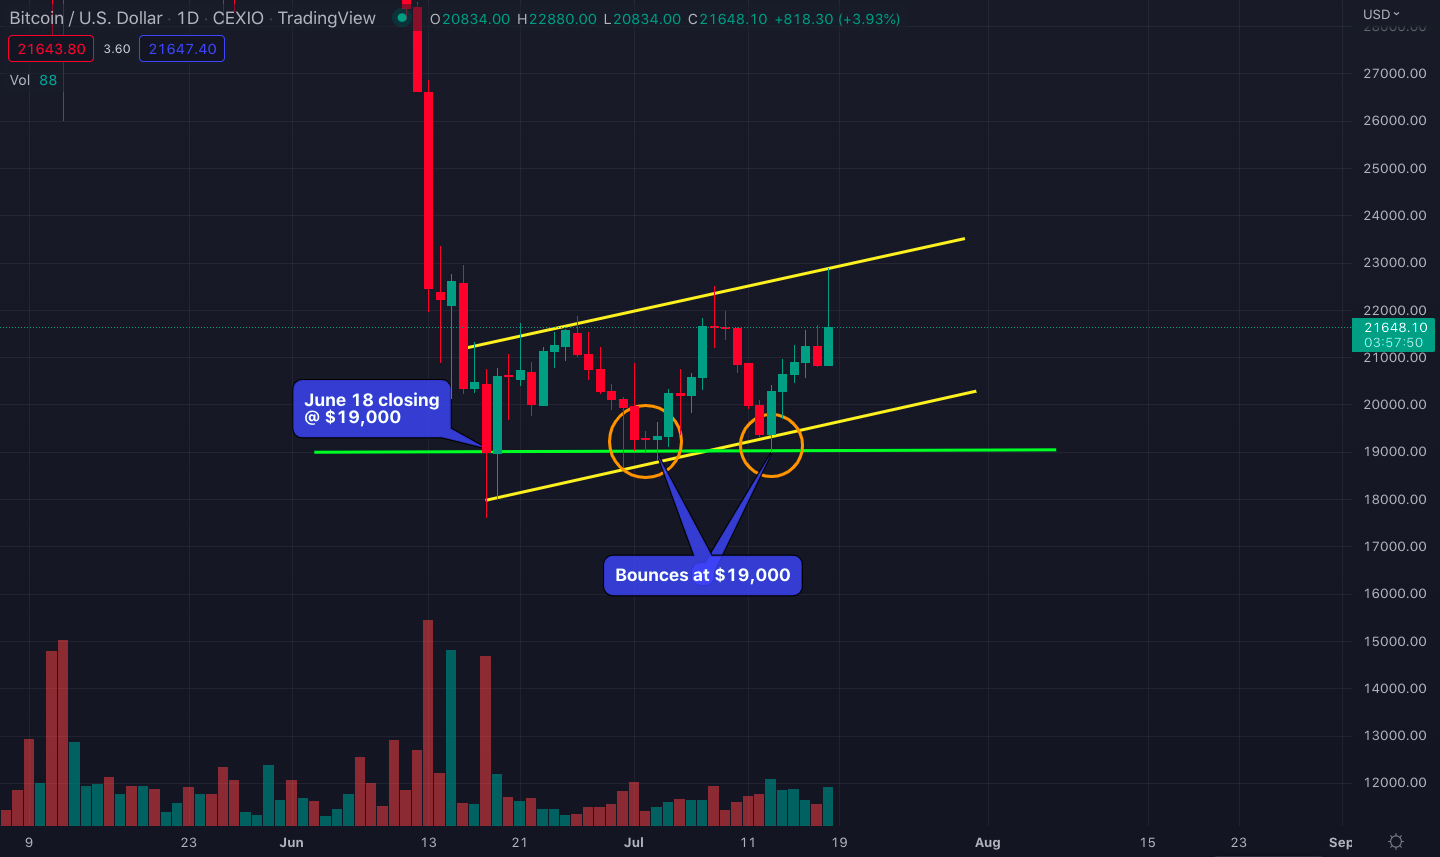
Daily closings above the $19,000 horizontal support instead of the lower diagonal support
Normally, in a bear flag, retracements that happen after the local bottom tend to close on or near the lower diagonal line and make higher lows. In the current case, bounces from June 18’s horizontal support instead of lower diagonal support are more promising for the bear flag to not play out.
The 50-day moving average is key resistance
Another key resistance to keep watching for Bitcoin is the 50-day simple moving average (SMA), which also passes through $23,000 as of July 19 (the yellow line on the chart below). It will be very critical for Bitcoin to pass this resistance level to potentially continue its uptrend.
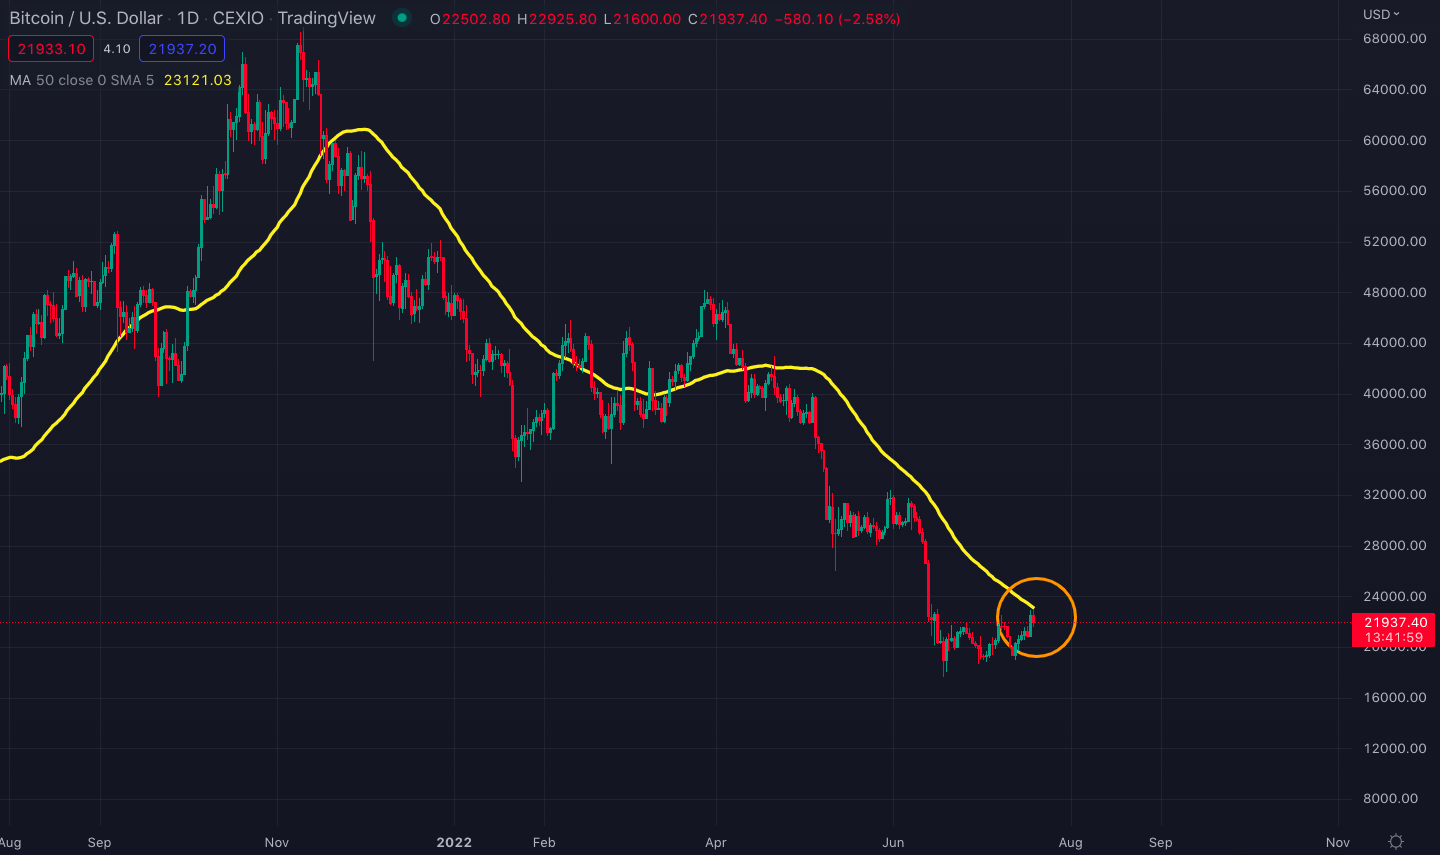
Daily Bitcoin chart with the 50-day SMA acting as resistance (yellow line)
Relative strength index (RSI)
The relative strength index (RSI) measures the speed and magnitude of an asset’s recent price change to evaluate whether the asset is overvalued or undervalued. It is usually considered a precursor to price action.
On the daily RSI, 50 acts as a key level for Bitcoin. In the past, breaking and closing above 50 brought significant price rallies, as you can observe in the chart below. And the key thing is there has been a lag between the RSI’s moving into overvalued territory and the accompanying price action. The RSI moves above 50 first and then can follow an explosive price move.
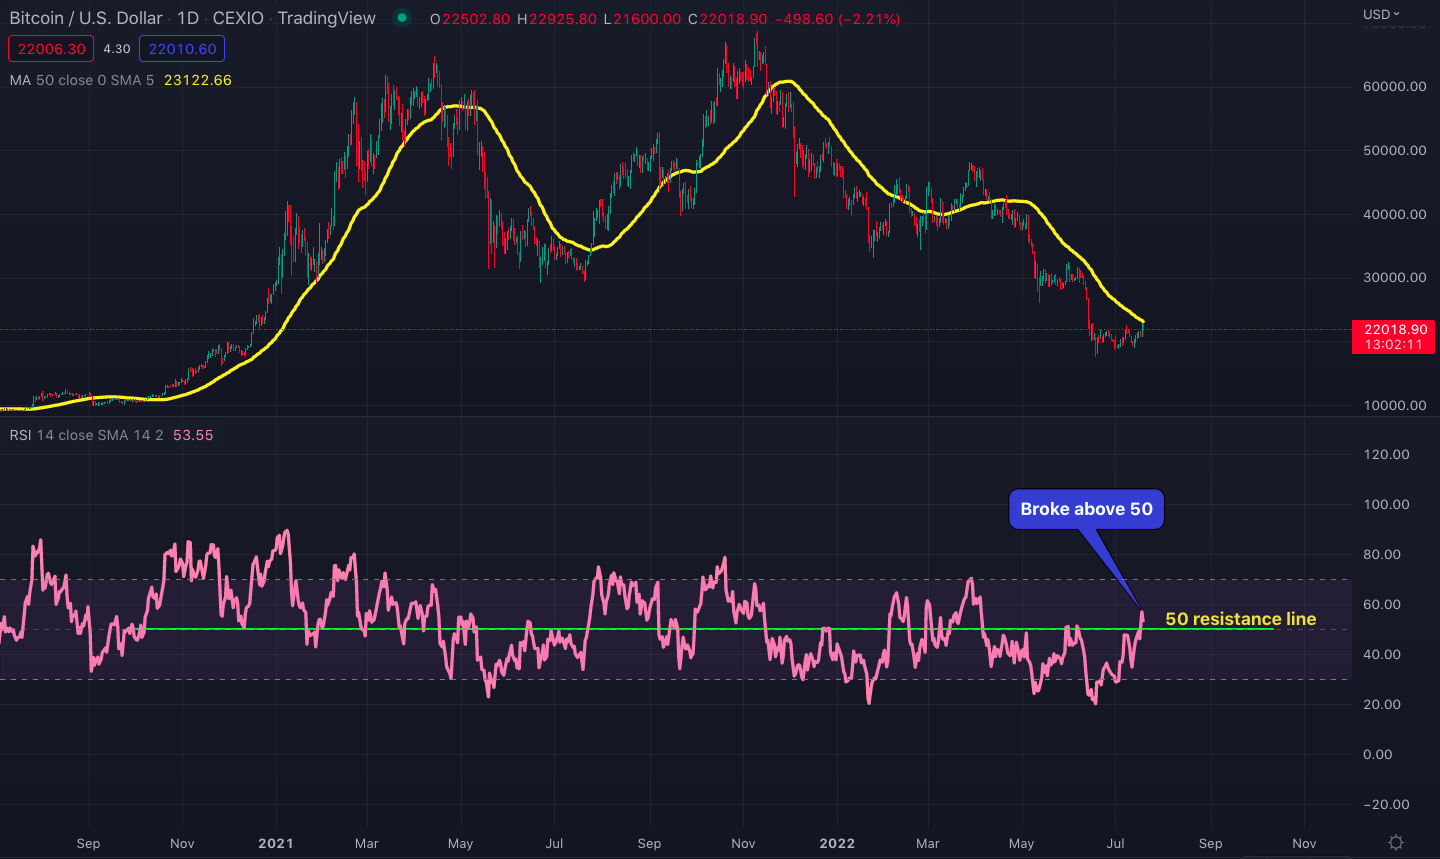
Bitcoin price chart with the daily RSI breaking above 50
If Bitcoin’s RSI can stay above 50 in the next few days, the price may be able to break above the $23,500 resistance.
In terms of the 3-day RSI, Bitcoin still has substantial room until it hits the major descending resistance line from January 2021:
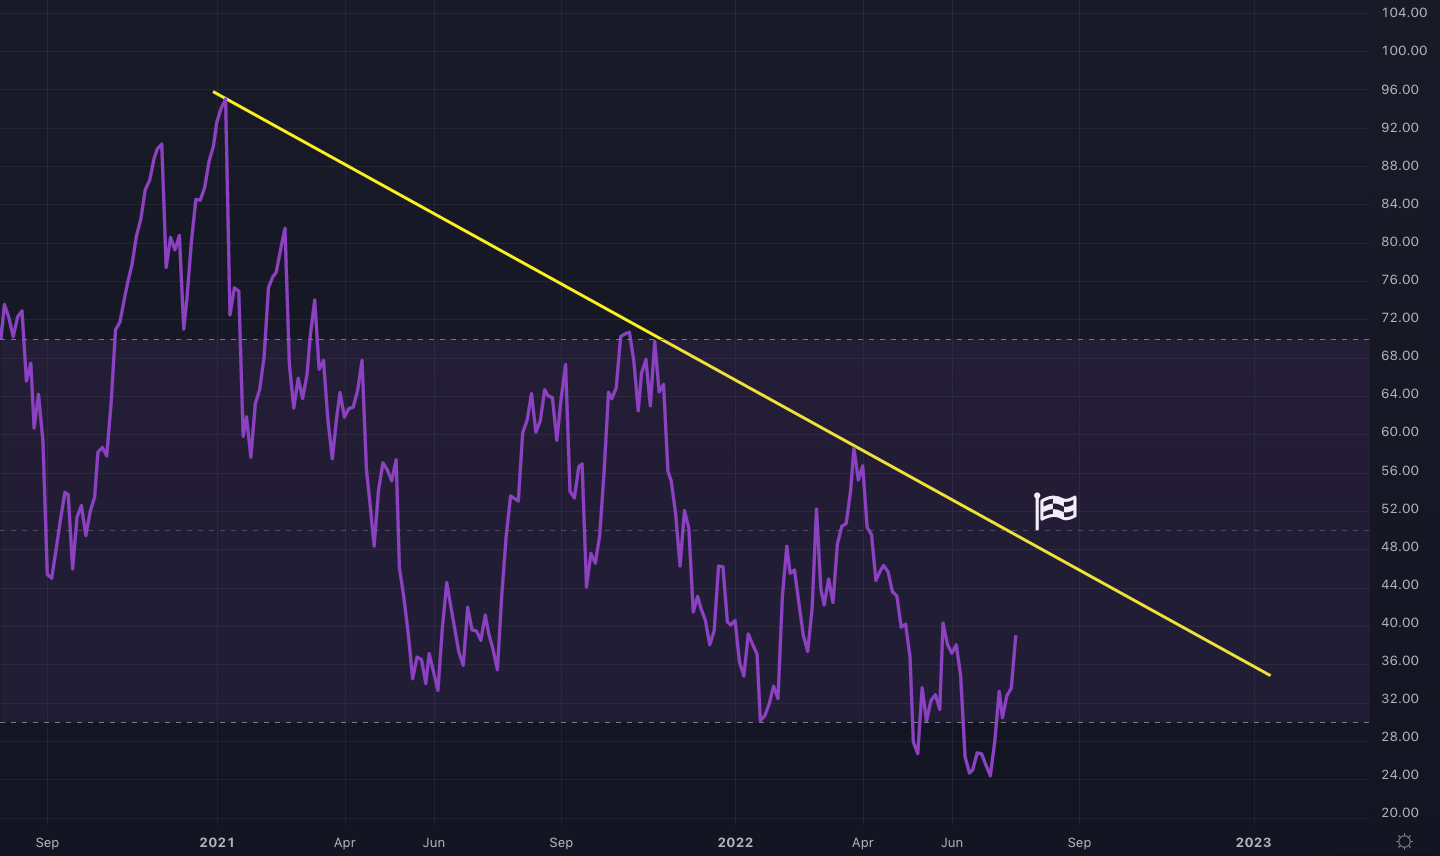
3-day RSI chart for Bitcoin
Stochastic RSI has room for growth
On the other hand, Bitcoin’s longer time frame (3-day and weekly) stochastic RSI values still have a significant margin left for the price to climb further.
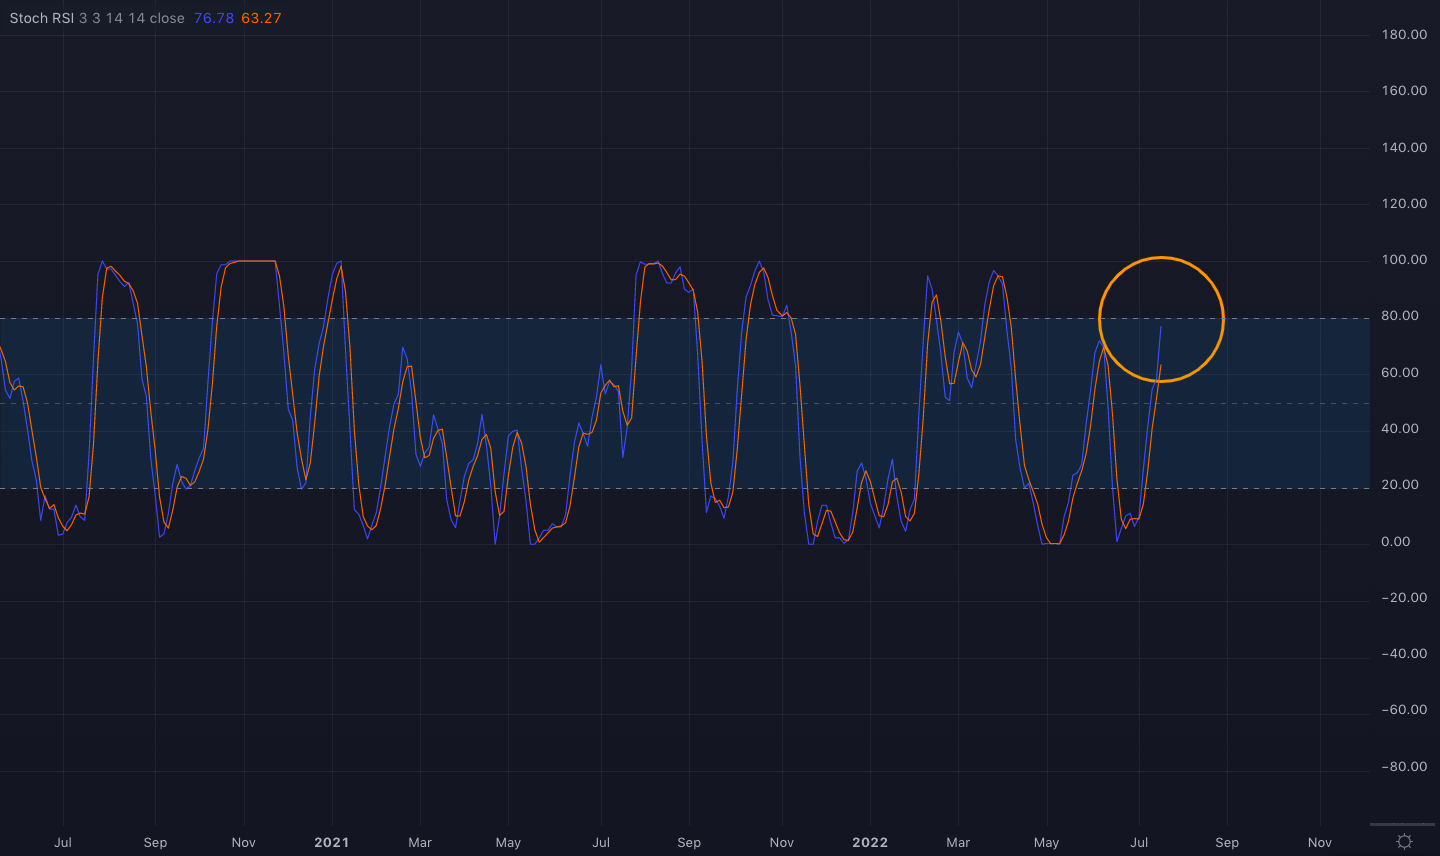
Bitcoin’s stochastic RSI on a 3-day time frame
It will be critical for Bitcoin to break above the 80 resistance on the 3-day stochastic RSI chart so, in addition to watching the daily charts and the $23,500 resistance, it might be necessary to keep an eye on that 80 level on the 3-day stochastic RSI chart.
On the weekly stochastic RSI chart, Bitcoin is trying to break above 20. Twenty has been a very critical level for Bitcoin’s stochastic RSI on weekly and monthly time frames. A decisive weekly close above 20 could bring an explosive move towards the 2021 bull market support levels.
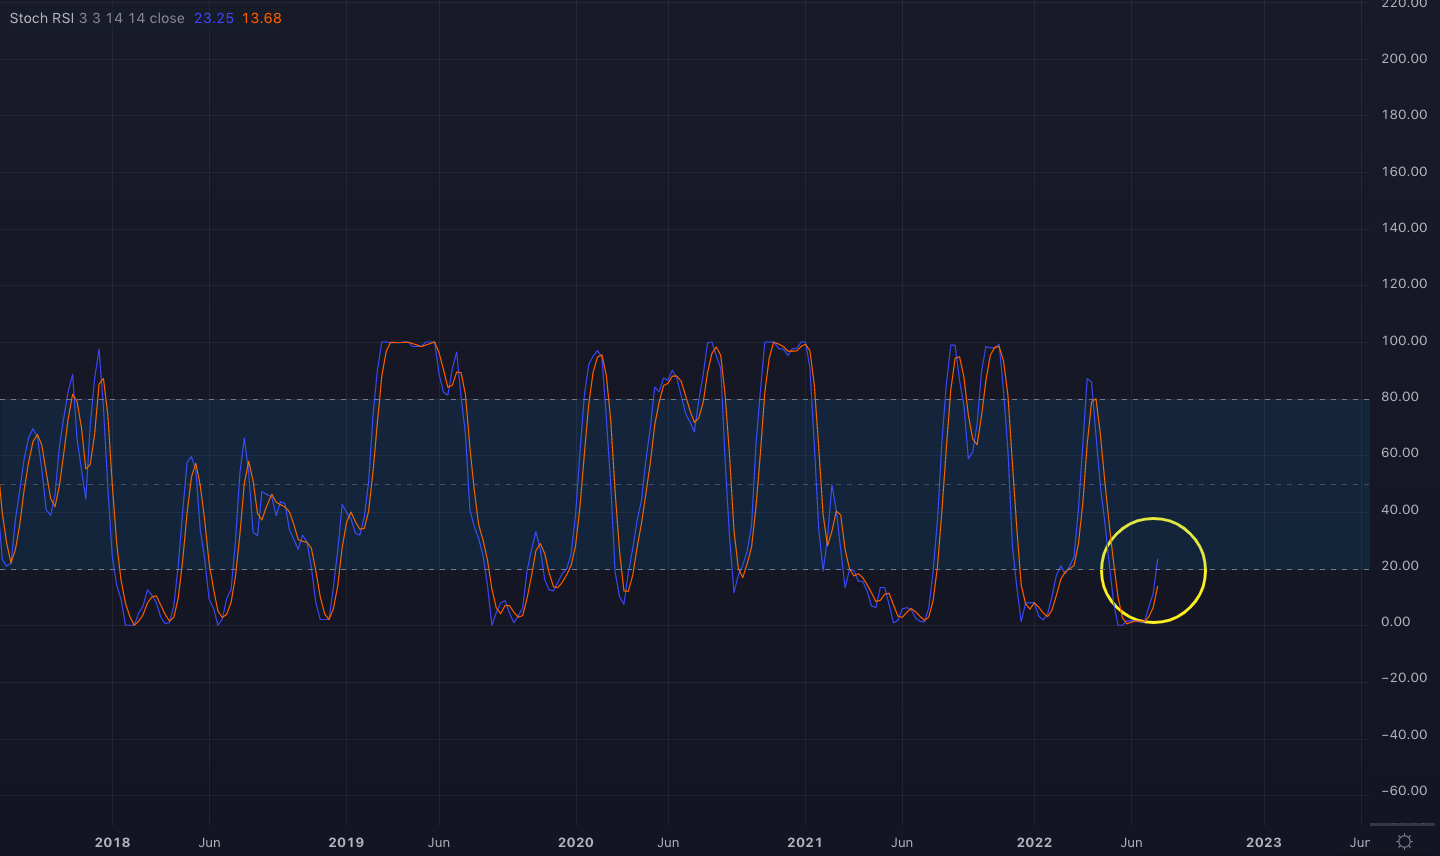
Bitcoin’s stochastic RSI on the weekly time frame
U.S. Dollar Index at major resistance
The U.S. Dollar Index (DXY) hit major historical resistance at 110. Considering the speed of the move from 90 (July 2021) to 110 (July 2022), it could take some time for the index to break above the descending yellow resistance line (see the chart below) if it is ever to cross above that line.
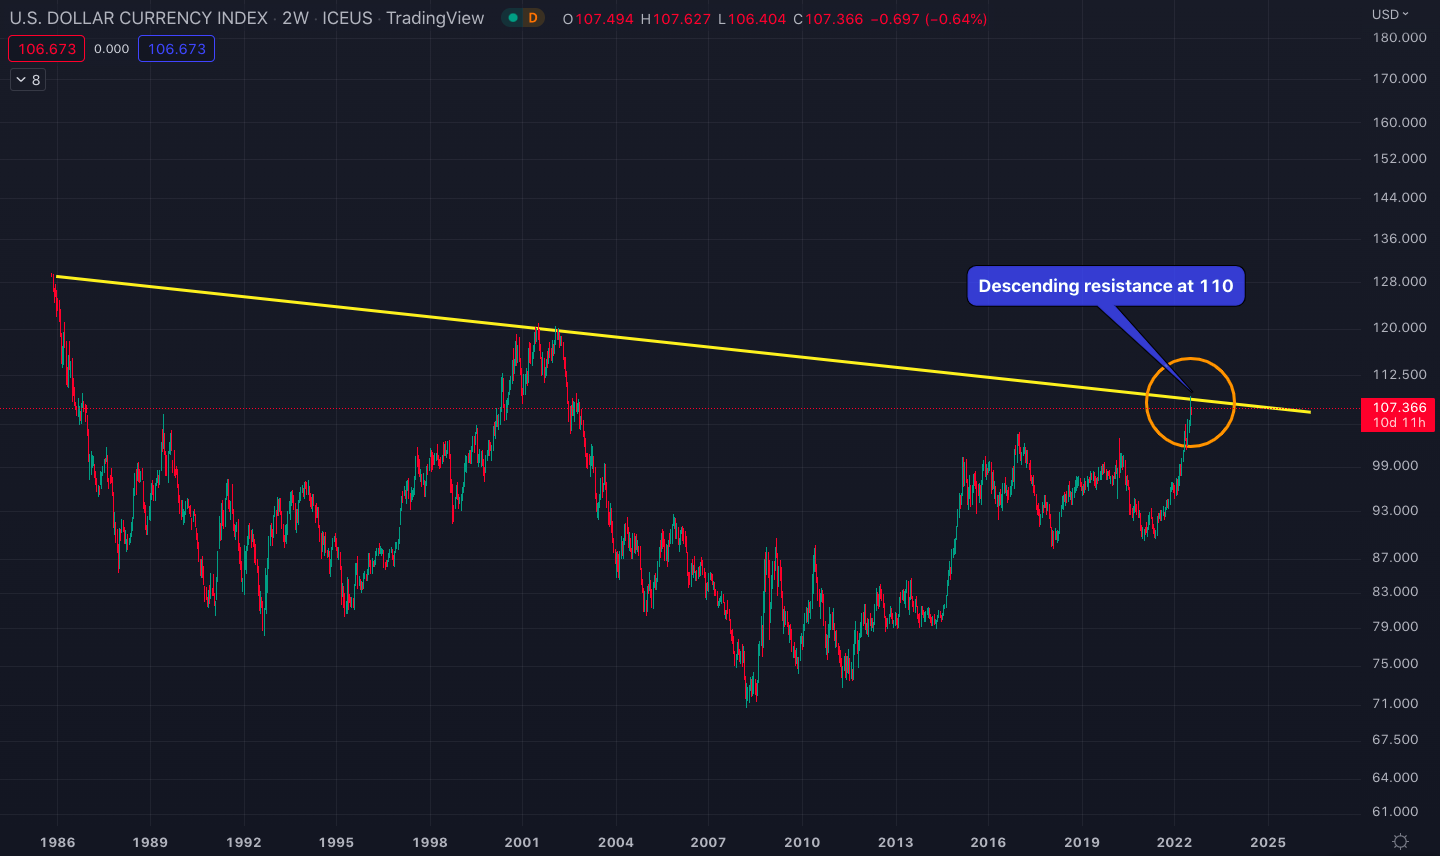
Biweekly chart for the U.S. Dollar Index (DXY)
The yellow descending line in the chart above constitutes a 36-year-old resistance, so DXY may not be able to break above the line upon the first try, which could give Bitcoin the breathing room it needs to climb to the $28,000-$30,000 levels.
Ethereum price analysis
Ethereum has increased significantly more than Bitcoin since the June 18 bottom. This may be a consequence of Ethereum’s ongoing Merge event and its new blockchain’s consistently successful performance tests conducted on different testnets. Ethereum’s moving to a new proof of stake blockchain (Beacon Chain) is expected to dramatically improve its scalability issues.
In addition, according to Glassnode, the amount of ETH staked on Ethereum’s new Beacon Chain reached an all-time high level at 12.8 million in early July. This corresponds to about 11% of Ethereum’s total circulating supply. The drop in Ethereum’s circulating supply may have also contributed to the superior price performance since the June 18 bottom.
Ethereum surged to $1,630 per coin as of July 19 from its $900 bottom on June 18, recording an increase of over 80%. During the same period, Bitcoin could climb by only 30% (from $17,600 to $22,800).
As you can see in the chart below, unlike Bitcoin, Ethereum has already blown past its 50-day moving average resistance.
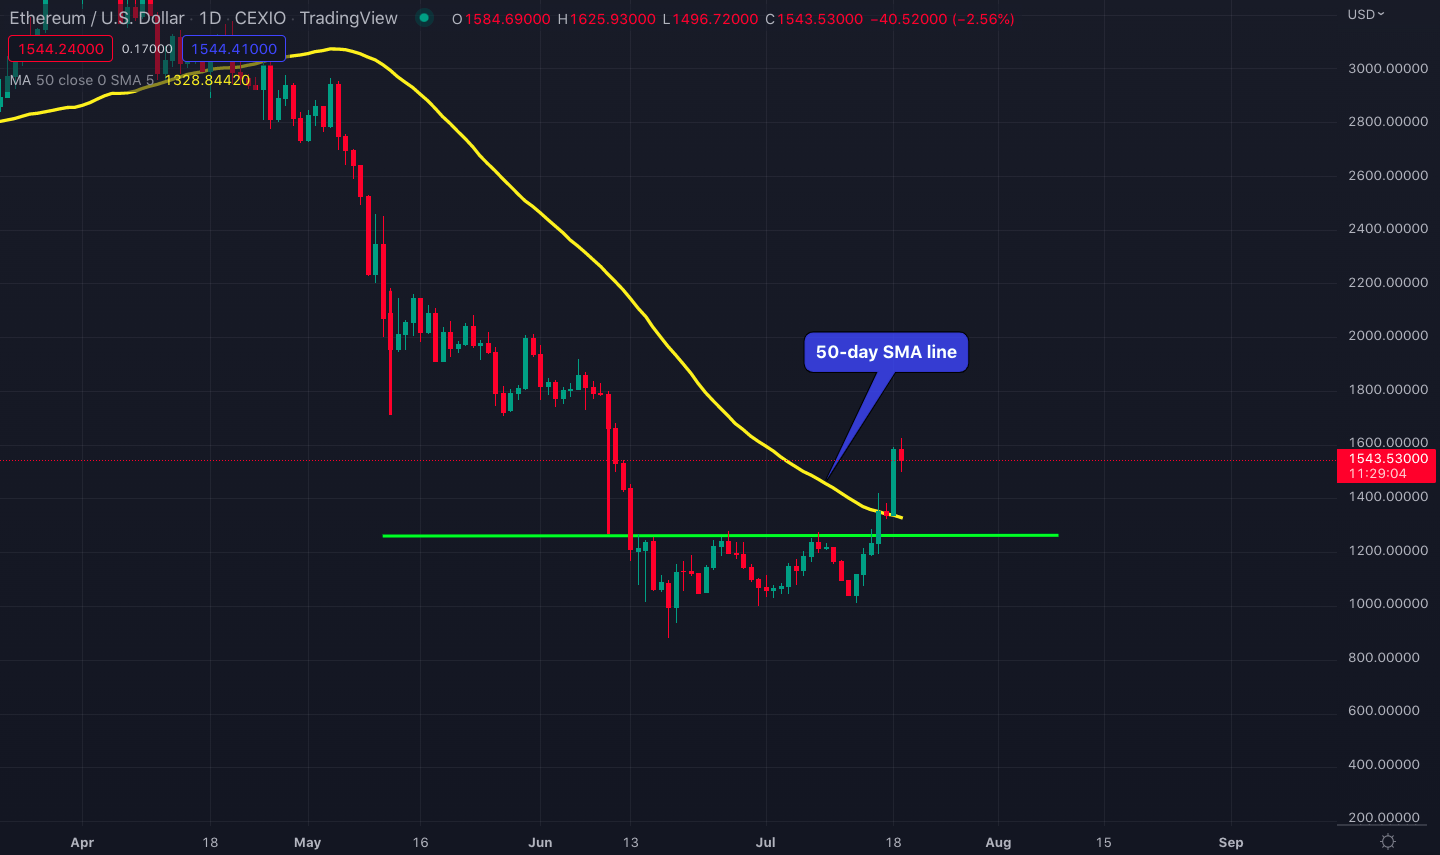
Ethereum/U.S. Dollar daily price chart with the 50-day SMA line
Ethereum/Bitcoin parity
Ethereum’s superior price performance reflects itself on the Ethereum/Bitcoin parity chart. After breaking down from its parallel rising channel in late May, the parity fell to a low of 0.05 on June 13. With the recent price action, the price parity just exploded from 0.053 on July 13 to 0.07 on July 19.
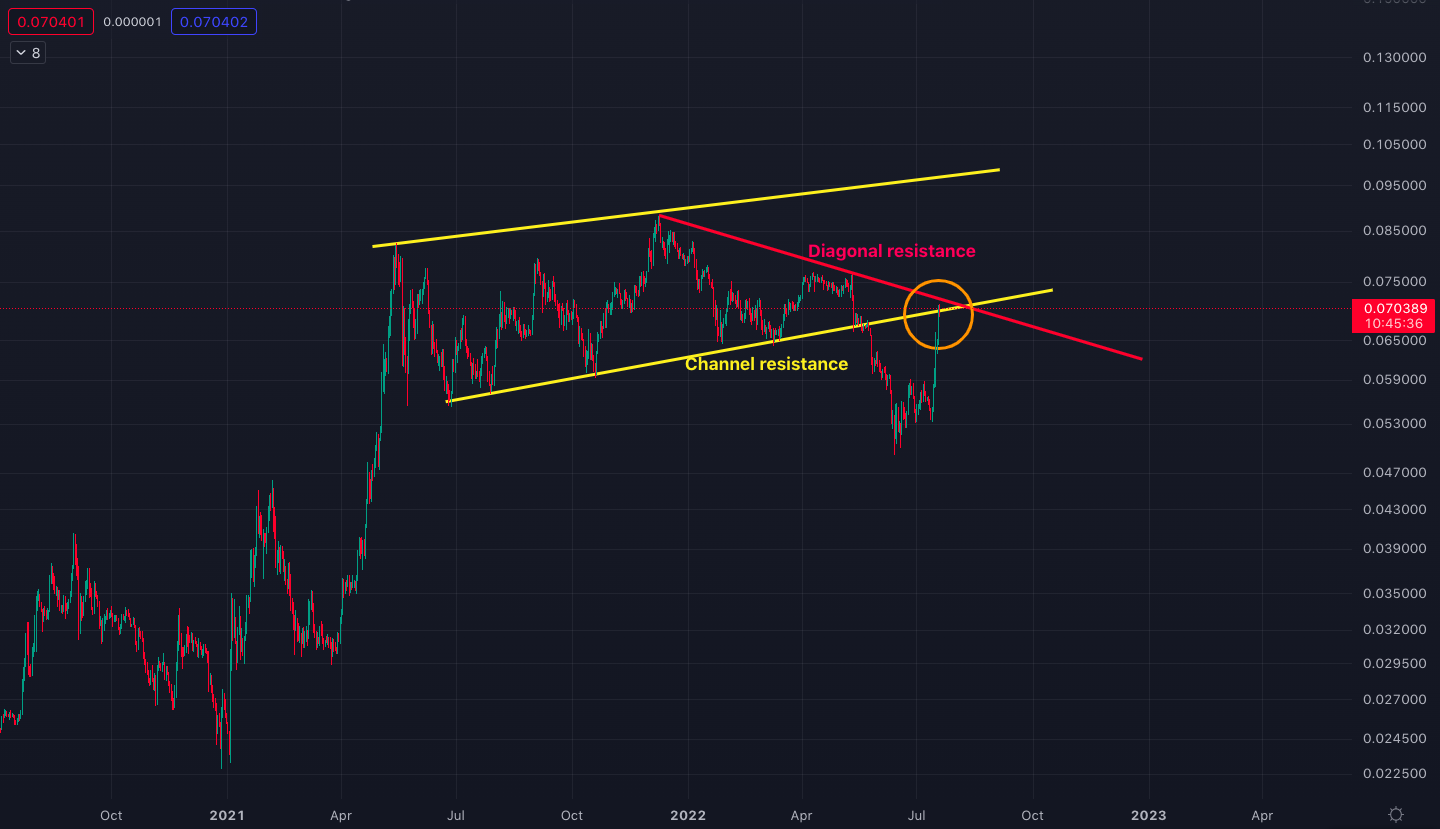
Ethereum/Bitcoin parity chart with the two major resistance lines
At 0.07, the parity hit a very major resistance that is made up of not one, but two major resistance lines. There is the rising channel resistance line from 2021 (the lower yellow line on the chart above) and the diagonal resistance line from the November 2021 top (the red descending line).
Considering such heavy resistance, it may be time to be cautious for Ethereum, at least in the Bitcoin parity. Bitcoin could surge above its $23,000 resistance, but if Ethereum cannot pass the 0.07 resistance, it may end up increasing less than Bitcoin in the coming days.
Daily RSI at major resistance
In terms of the daily RSI, Ethereum leads Bitcoin, hitting both the critical 70 horizontal resistance and the diagonal resistance from August 2021. Considering that, Bitcoin’s move may accelerate in the coming days if it continues its uptrend.
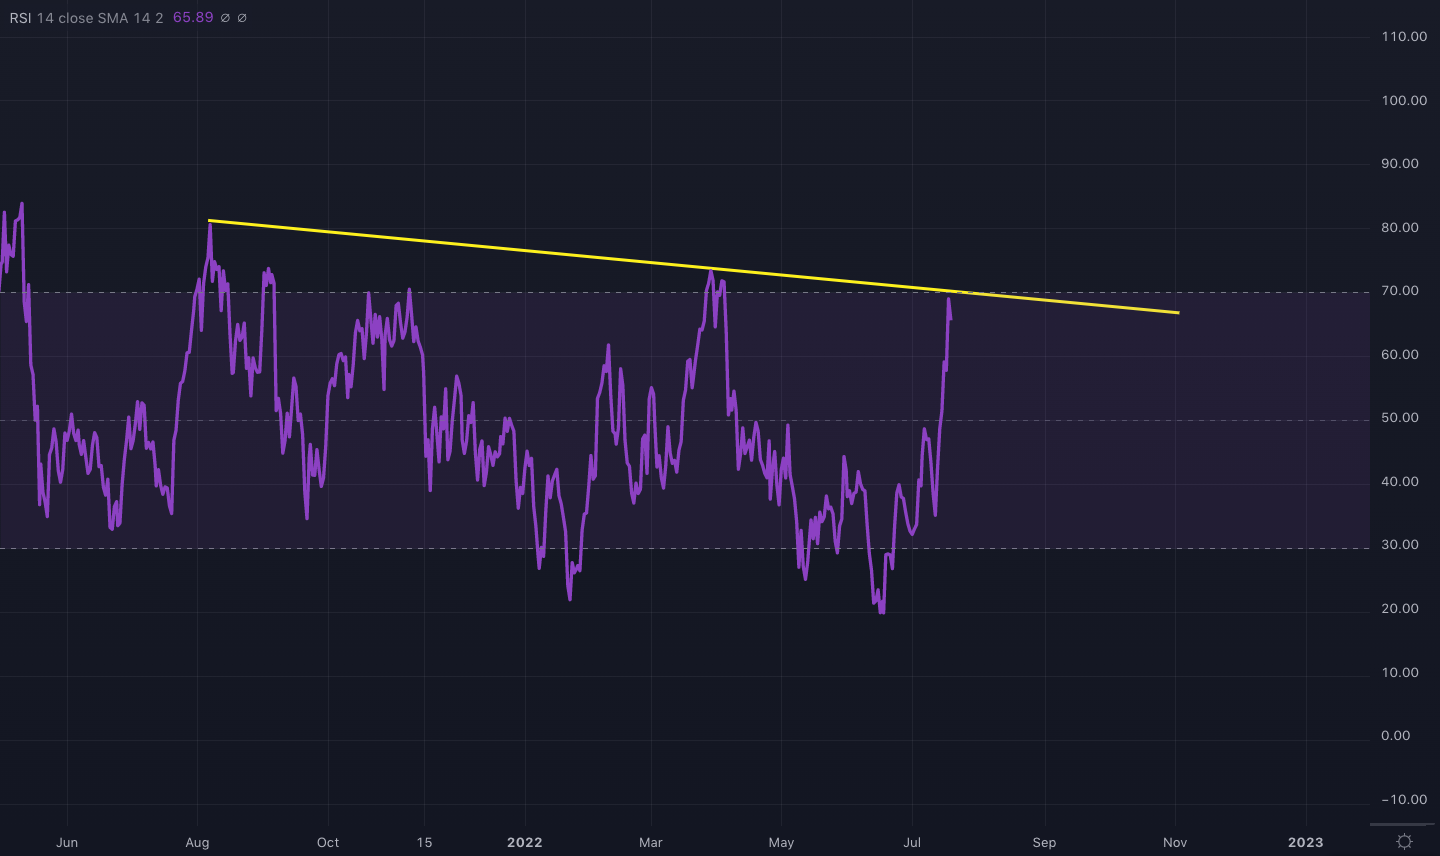
Ethereum RSI chart on the daily time frame
Altcoins
Some major altcoins made very significant moves following the June 18 market bottom. Polygon (MATIC) leads the gains among major altcoins, followed by Aave (AAVE) and Uniswap (UNI).
Polygon (MATIC)
MATIC’s price has increased by 200% (3x) in only one month since its $0.32 bottom. This gigantic price move was primarily motivated by the migration of dApps on the Terra platform to the Polygon platform.
An estimated 50 companies, including important names like OnePlanet, an NFT marketplace, and Derby Stars, a metaverse game, have migrated to the Polygon network during June and July following the collapse of the Terra network.
The mass migration caused Polygon’s network activity to spike which in return spiked network fees and thus the unit price of the network’s native currency, MATIC.
Following the 200% price advance, MATIC hit the descending diagonal resistance on the logarithmic price chart (already above that resistance on the linear chart). This is major resistance because it is a resistance exerted by MATIC’s all-time high price from December 2021.
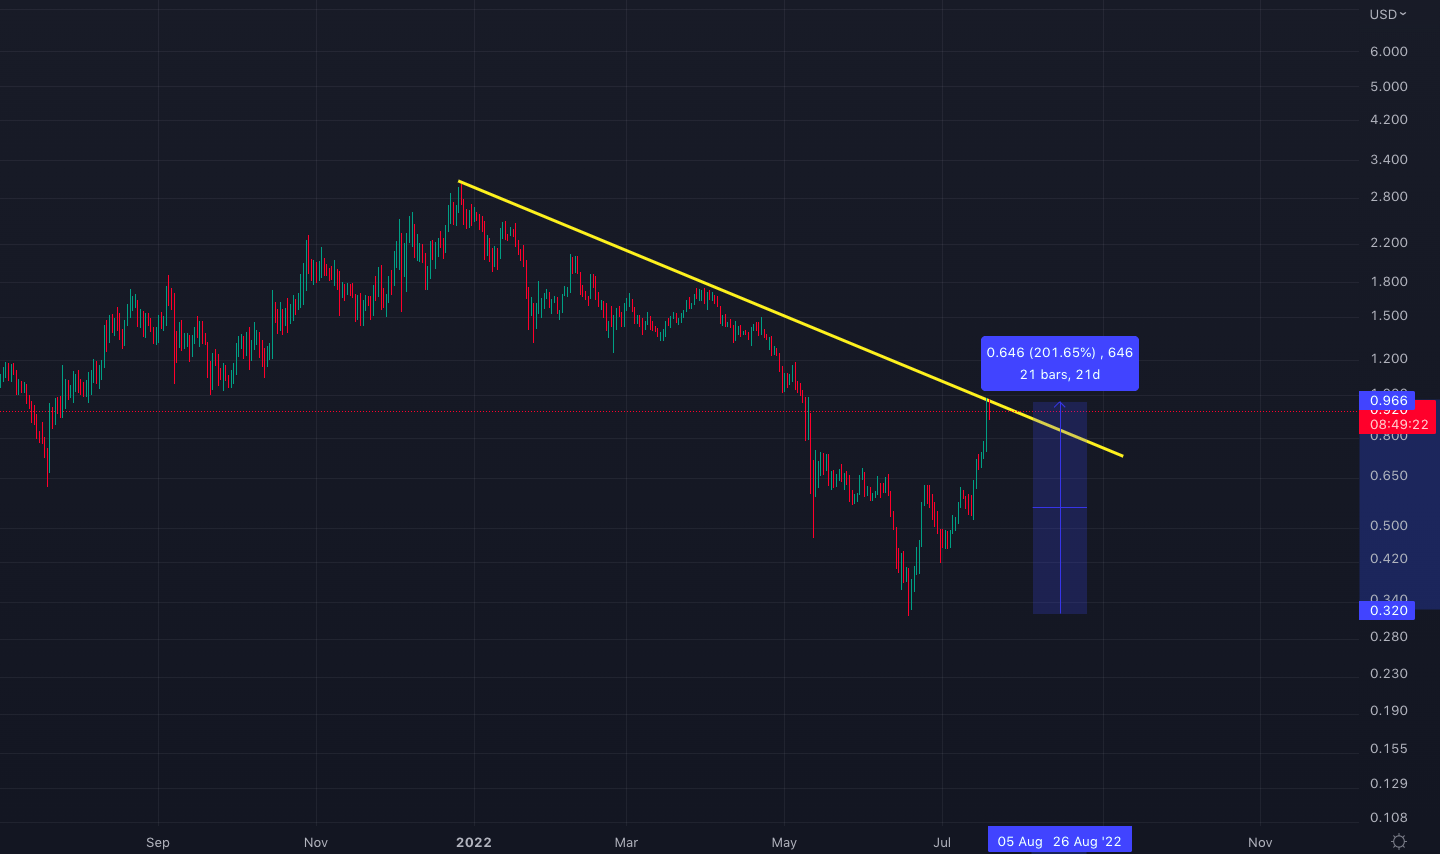
MATIC/U.S. Dollar logarithmic price chart on the daily time frame
Hitting such a major resistance after making a 200% price advance in less than a month could require caution with MATIC going forward. At least a cool-down period may be in the works for this popular cryptocurrency.
Aave (AAVE)
Aave has been following a perfect bull flag structure since topping at $700 per coin on May 18, 2021. Aave was the best performer of the previous bull market. It started its record-breaking surge in September 2019, way earlier than all other coins, and made an incredible 2,000x advance in less than 20 months.
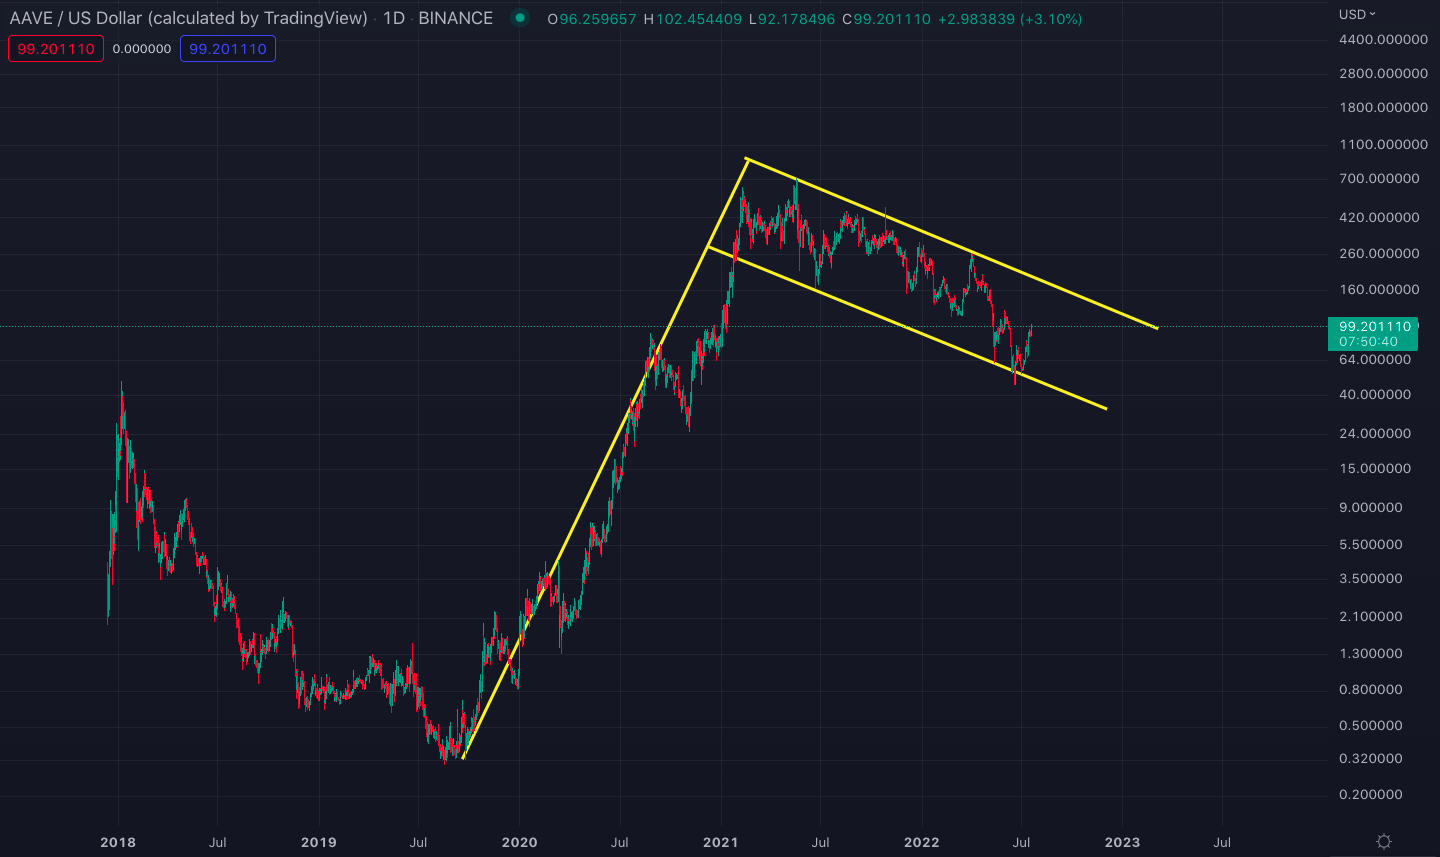
AAVE/U.S. Dollar logarithmic price chart on the daily time frame
AAVE bounced off from exactly the lower support line of the bull flag during the June 18 market bottom. Since then, it has managed to increase by more than 100%, from $46 to $100 per coin, and can be considered the second highest rising coin among the major altcoins.
The main motivator behind this market-leading move was the revealing of Aave’s plans to launch a U.S. Dollar-pegged stablecoin, called GHO.
The purpose of the stablecoin is to increase revenue on the Aave network and make borrowing on the DeFi protocol more competitive. According to the proposal, all interest payments accrued by minters of GHO (in return for bringing collateral) would be transferred to the AaveDAO Treasury.
Aave founder, Stani Kulechov, stated that the development of the GHO stablecoin has been complete and the first audit will take place on the week of July 11. Regardless of the coin’s performance, the proposal has to be approved by the Aave community with a snapshot vote before it can be deployed on the Ethereum mainnet.
What caused excitement about this new stablecoin, amidst the increasingly negative sentiment for stablecoins (due to the UST collapse), is that GHO will be overcollateralized by assets that continue to earn yield. This traditional approach is welcomed as being safer compared to the more innovative but riskier alternatives, like algorithmic stablecoins.
In the future, the market’s demand for GHO (if it gets launched) can continue to make an impact on AAVE’S price action. If the new stablecoin gains a lot of traction, it could bring substantial fee revenue to the AAVE protocol, which could in return enable the protocol’s governance token to advance to the upper resistance line of the bull flag.
Uniswap (UNI)
Uniswap was one of the earlier movers following the June market bottom, triggered by the protocol’s acquisition of Genie, one of the leading NFT marketplace aggregators on June 20.
Uniswap sought to regain traction for its platform and increase transaction volume by integrating an NFT marketplace as NFTs have comparatively been more successful in gaining mainstream adoption compared to DeFi applications.
This move was received with much enthusiasm and sent Uniswap’s governance token, UNI from $3.5 on June 18 to over $6 within only a week.
Following that, on July 13, the Uniswap v3 protocol was deployed on Celo, which continued Uniswap’s expansion to blockchains beyond Ethereum. Celo is a blockchain focused on mobile-friendly decentralized finance applications. An interesting aspect of the Uniswap deployment on Celo is that Celo will provide liquidity for “carbon credit tokens”.
Finally, the UNI governance token has recently been listed on Robinhood, which can significantly increase the token’s exposure to a much more mainstream audience.
These two developments were able to push the price of UNI from $5 to $7.5, assisted by Bitcoin’s climbing back above $20,000 and then to the $23,000 resistance.
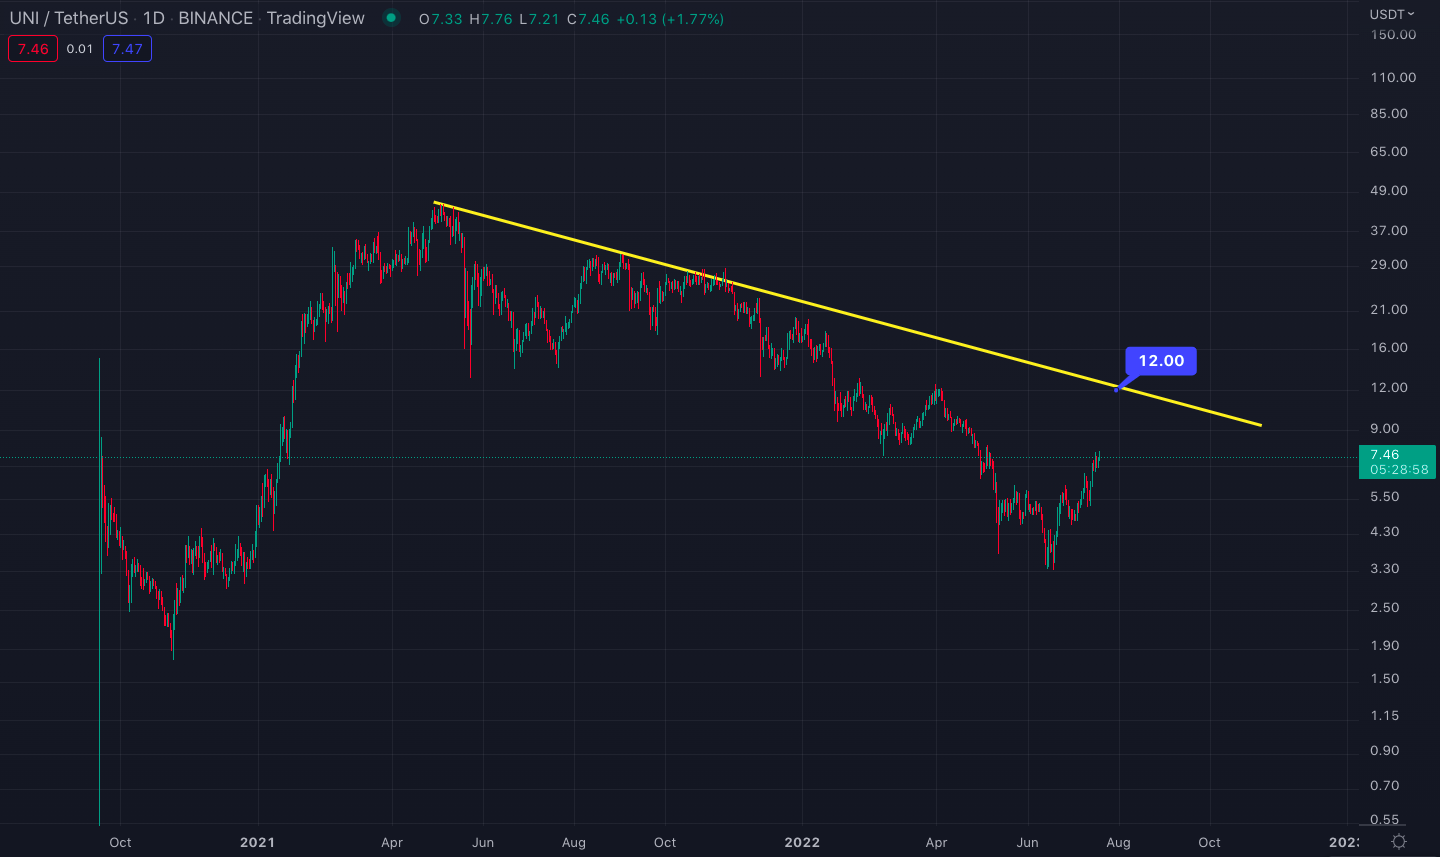
Uniswap/U.S. Dollar price chart with the major descending resistance at $12
As you can observe in the chart above, UNI still has substantial room to hit its major cycle resistance at $12. However, it is also worth noting that the token increased by more than 100% in one month.
Lagging altcoins
Some major altcoins have been weak compared to the moves of the coins we discussed, including Ethereum and Bitcoin. These lagging altcoins include Cardano (ADA), Polkadot (DOT), Chainlink (LINK), and Dogecoin (DOGE).
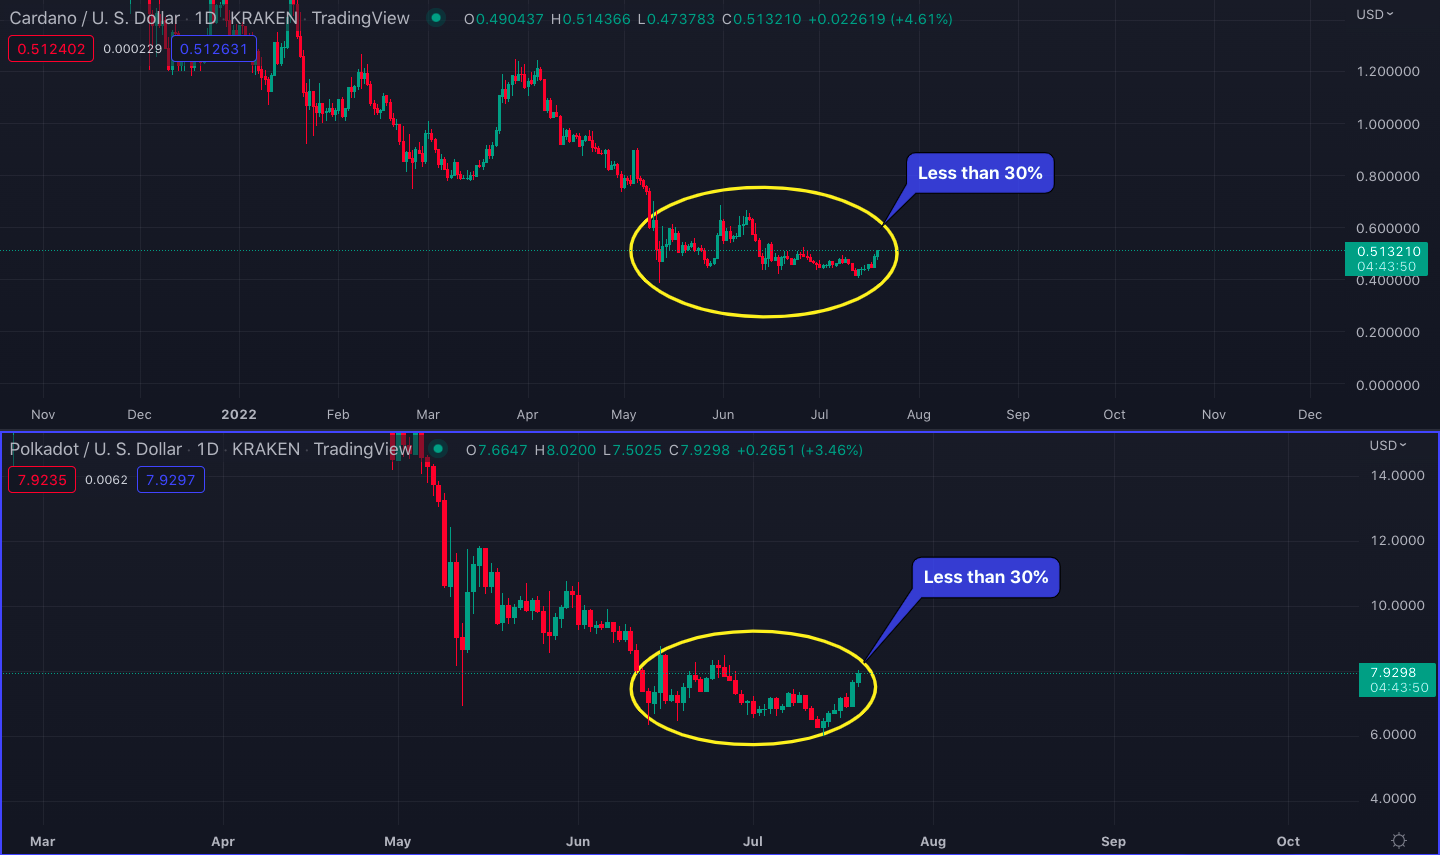
Price charts for Cardano/USD and Polkadot/USD on the daily time frame
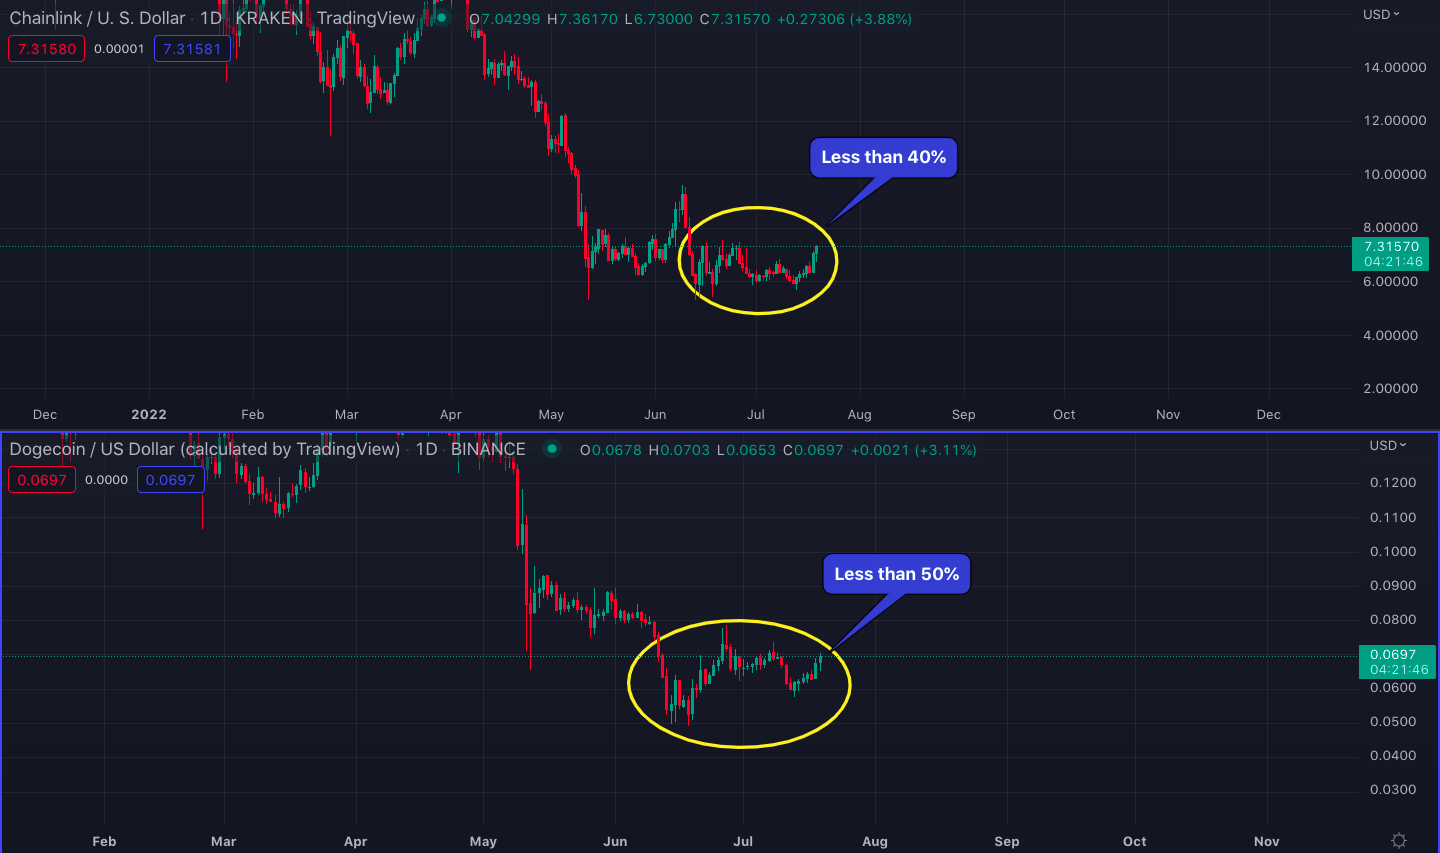
Price charts for Chainlink/USD and Dogecoin/USD on the daily time frame
It may sound like a good idea to scale into altcoins that have not yet made their strong, explosive moves. However, not every altcoin makes a huge leap at every cryptocurrency rally. It may do so if it is a full-blown, mega bull run that typically follows a new Bitcoin all-time high.
Historically speaking, altcoins have been able to run as long as Bitcoin could run. Once Bitcoin cannot go any further (making a cycle or local top), those lagging, weaker altcoins typically end up crashing from where they are, dropping to even lower prices than the beginning of the rally.
So buying a basket of cryptocurrencies just because they are the only ones left behind may not be the wisest idea. If you are interested in buying lagging coins, you should at least try to identify obvious chart patterns like bull flags, ascending triangles, falling wedges, etc., and look for solid developments to complement the charts before you decide to make any purchases.
And above all else, you should follow the Bitcoin price chart, as well as S&P 500, DXY, and U.S. bond yield charts.
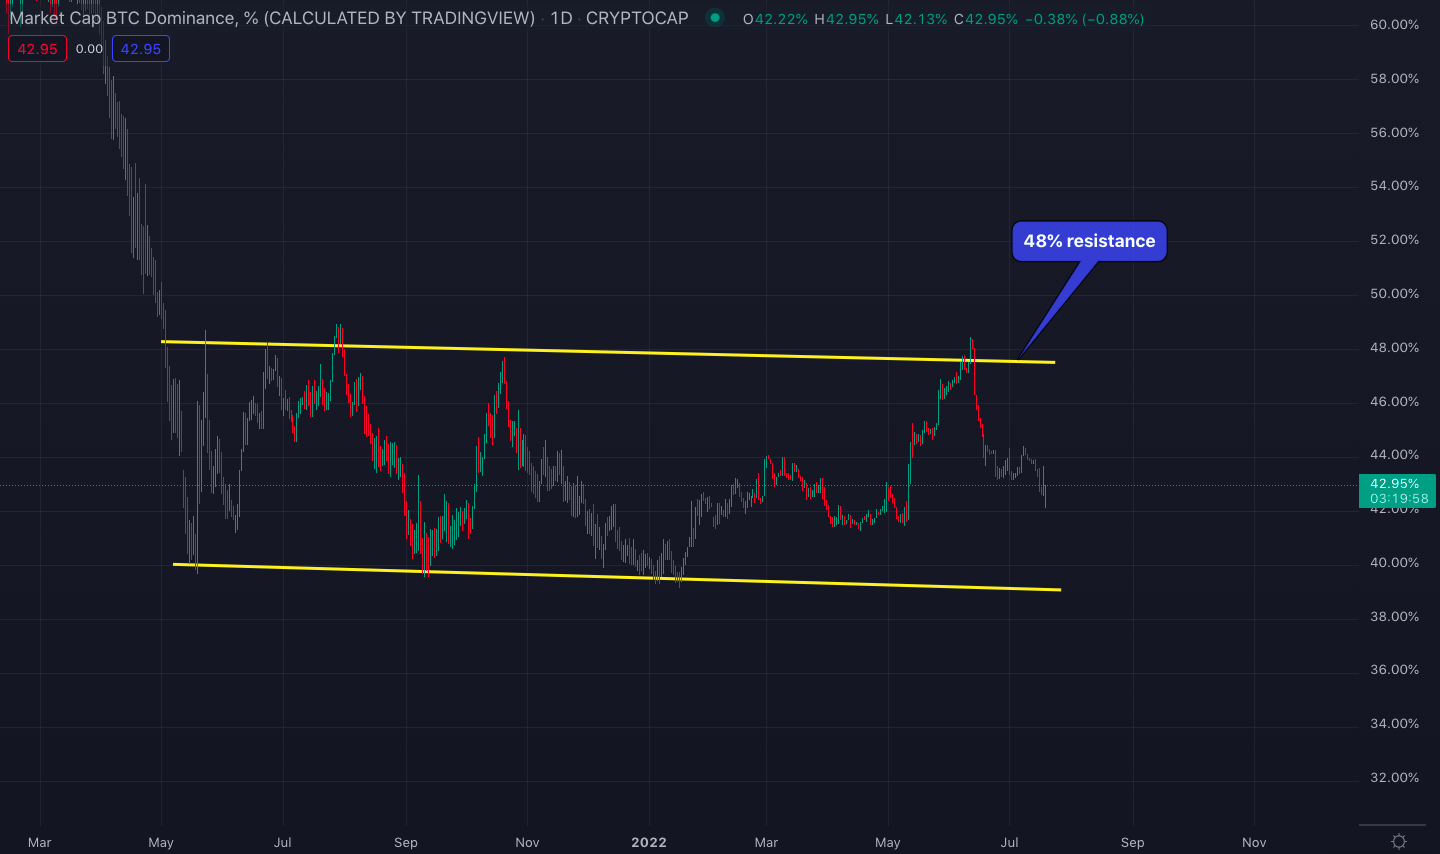
Bitcoin dominance
A key metric to follow for altcoin trading is Bitcoin dominance. Bitcoin dominance is the ratio of Bitcoin’s market capitalization against the total cryptocurrency market value, thus a higher Bitcoin dominance means a weaker altcoin market.
Bitcoin dominance started surging in May 2022 following the Terra/UST debacle, increasing from 41% to 48%. However, Ethereum’s recent intense price action as well as the increase in some other major coins and tokens pushed Bitcoin dominance back below the 48% resistance. It dropped to as low as 42% on the day that the Ethereum/Bitcoin parity hit the 0.07 resistance.
With Bitcoin spiking from $21,500 to $23,500 on July 19, the dominance turned from a very critical level.
Bitcoin’s breaking above $23,500 can likely create a lot of FOMO in the market because it will mean the failure of the bear flag that everybody has been fearing. There is also barely any resistance until the $28,000-$30,000 level so price action can highly accelerate if Bitcoin closes above $23,500.
When Bitcoin makes an accelerated move, FOMO forces money to flow from altcoins to Bitcoin. If that happens, dominance can break the 48% resistance this time. The next major resistance comes at 57%, which would correspond to an Ethereum/Bitcoin parity price of approximately 0.04.