This weekly piece of cryptocurrency price analysis and thought leadership is brought to you by the expert team at CEX.IO, your crypto guide since 2013. At CEX.IO, we’re committed to providing our users with the latest price updates and continuously analyzing what could be next with crypto prices.
In this week’s update, we take a peek at the current euphoria surrounding Dogecoin.
In our last Crypto Ecosystem Update, we predicted that Dogecoin could rally to $0.15 if it could turn $0.09 to support in the coming weeks. However, things have escalated quickly following Elon Musk’s eccentric entrance to the Twitter headquarters, which saw the original meme cryptocurrency erupt to $0.15 just 48 hours following our analysis.
Looking at the coin’s meteoric rise from $0.06 to $0.15, Musk acquiring Twitter seems to have convinced a large number of players that crypto is going to be a focus on the platform, with Dogecoin potentially at the center of its ecosystem.
In this 37th edition of the Crypto Ecosystem Update, we will examine how Dogecoin rallies have historically paved the way for altcoin seasons. In that light, we will also look at Ethereum, the largest altcoin, complemented with brief reviews of Chainlink, Aave, and Chiliz.
Read along for in-depth breakdowns and enjoy reviews of correlated markets to help you make the most informed decisions along your crypto journey.
Dogecoin on fire
It appeared Dogecoin ($DOGE) had been forgotten following its 2021 glory days when it rewarded its holders with a 10,000% profit.
However, whales have been silently accumulating the flagship meme cryptocurrency in recent months. According to IntoTheBlock, over 450,000 addresses purchased 58.81 billion DOGE between $0.06 and $0.09. This is why DOGE has been pacing inside this price range for the last four months before finally exploding out of it last week when it was announced that Musk had acquired Twitter.
The hype around Dogecoin started on October 5 when Elon Musk announced his renewed intentions to finalize the Twitter deal. On the week of the deal’s closing, DOGE saw a 150% price gain in a matter of four days (see the chart below).
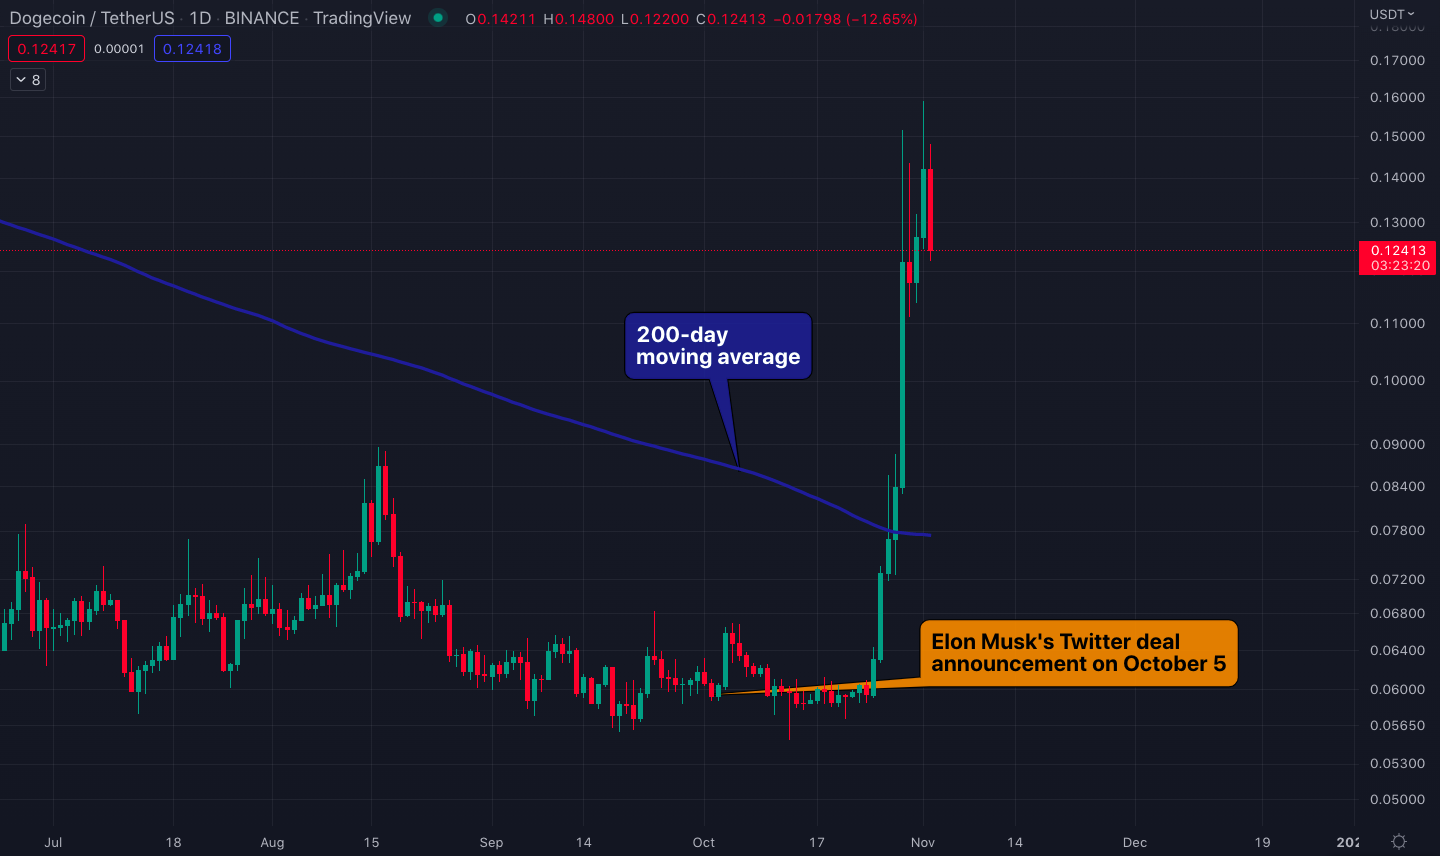
Dogecoin/U.S. dollar chart with the 200-day simple moving average. Source: Tradingview.
The 200-day simple moving average (SMA) has been a key support or resistance for cryptocurrencies. In that sense, how the price behaves at the 200-day SMA level could determine the strength of a trend. If, for example, the price is below the 200-SMA but can penetrate it effortlessly on a daily close, an explosive move past that resistance could follow next.
Flipping the 200-day SMA to support has been the exact case with Dogecoin. DOGE was able to close above this resistance on Friday, October 28 at $0.08 per coin and then exploded to $0.15 the very next day.
Bitcoin’s reversal from the $19,000 bottom on October 23 and rallying to $21,000 by October 26 was certainly a booster in DOGE’s breathtaking rally.
A slew of other dog-themed tokens enjoyed similarly astronomical rises last week with Dogechain generating the most remarkable returns. Dogechain is a layer 2 (L2) bridge solution for Dogecoin, which increased by a whopping 1,000% last week.
Can the DOGE rally start an altseason?
In the past, Dogecoin rallies were the precedents for altcoin seasons. The first one was in January 2014 when DOGE first debuted. The original meme currency rallied from $0.0002 to $0.0022 (1,000%) which was followed by a drop in Bitcoin dominance next month from 99.5% to 97% (see the charts below).
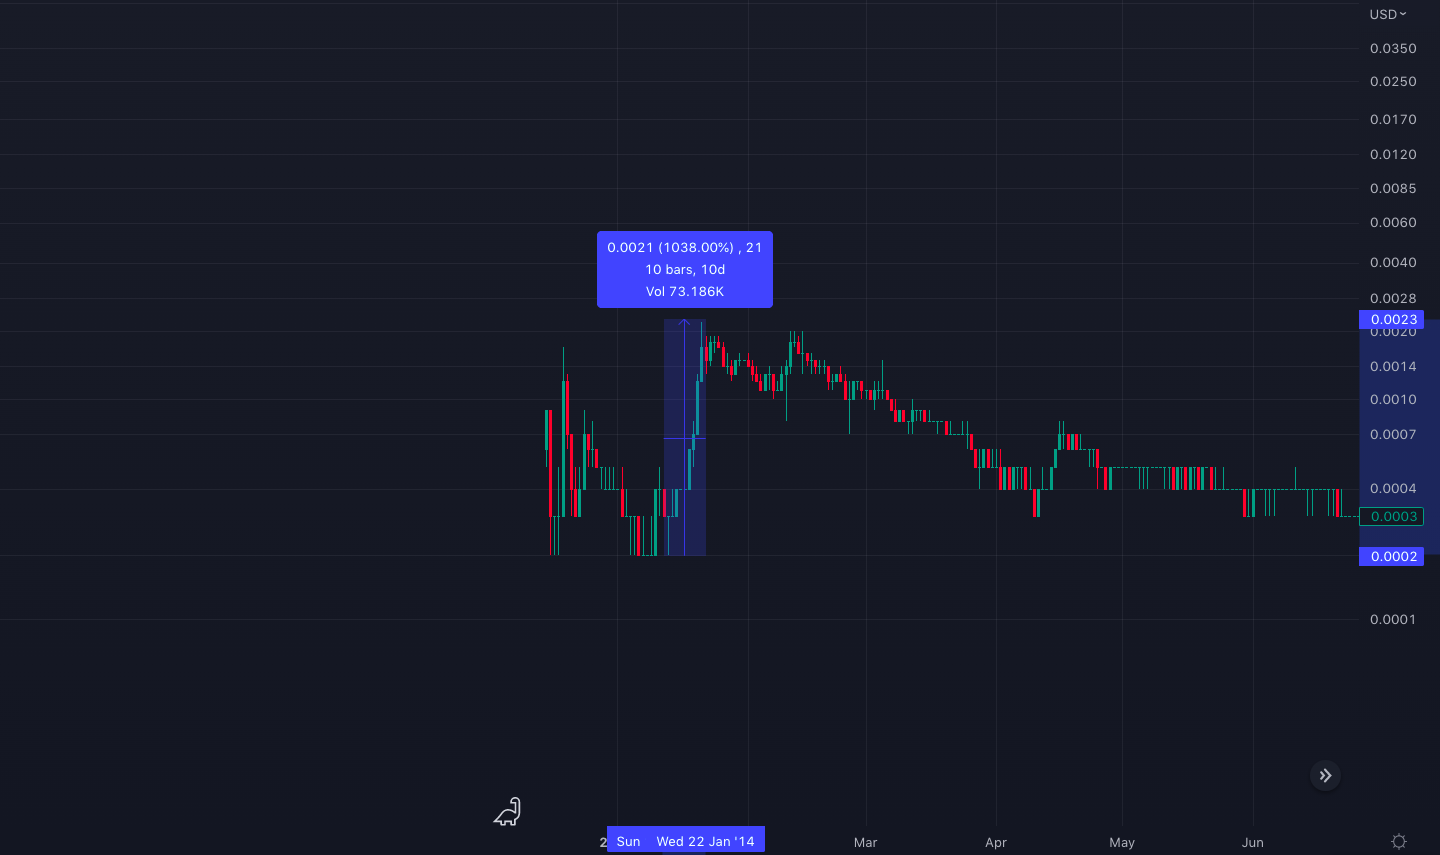
DOGE/U.S. dollar price chart with the 1,000% rise in January 2014.
Bitcoin dominance is the ratio of Bitcoin’s market capitalization against the total cryptocurrency market value. Thus, a lower Bitcoin dominance means a stronger altcoin market. Considering that there were only a handful of tiny altcoins back in 2014, the drop in dominance from 99.5% to 97% meant a legitimate altcoin season.
The drop in Bitcoin dominance from 99.5% to 97.5% in 2014.
In 2017, the same pattern repeated for Bitcoin dominance albeit at an exponentially larger rate. Dogecoin recorded a new 10x rally from $0.0004 in April 2017 to $0.004 in May 2017, which was followed by a gigantic drop in Bitcoin dominance in July 2017 from 75% to 49% (see the charts below).
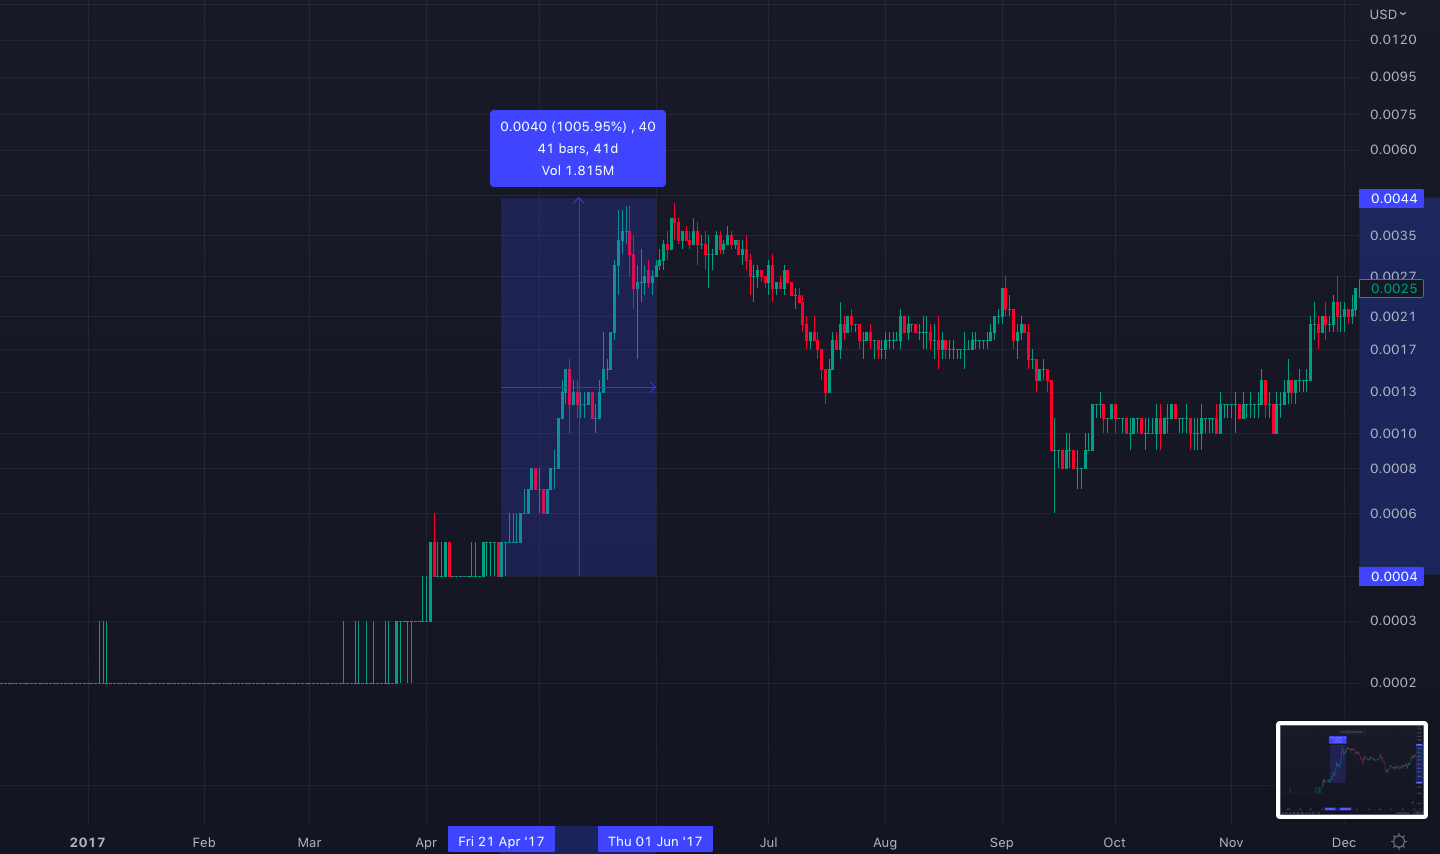
Dogecoin rally from $0.0004 to $0.004 in April and May 2017.
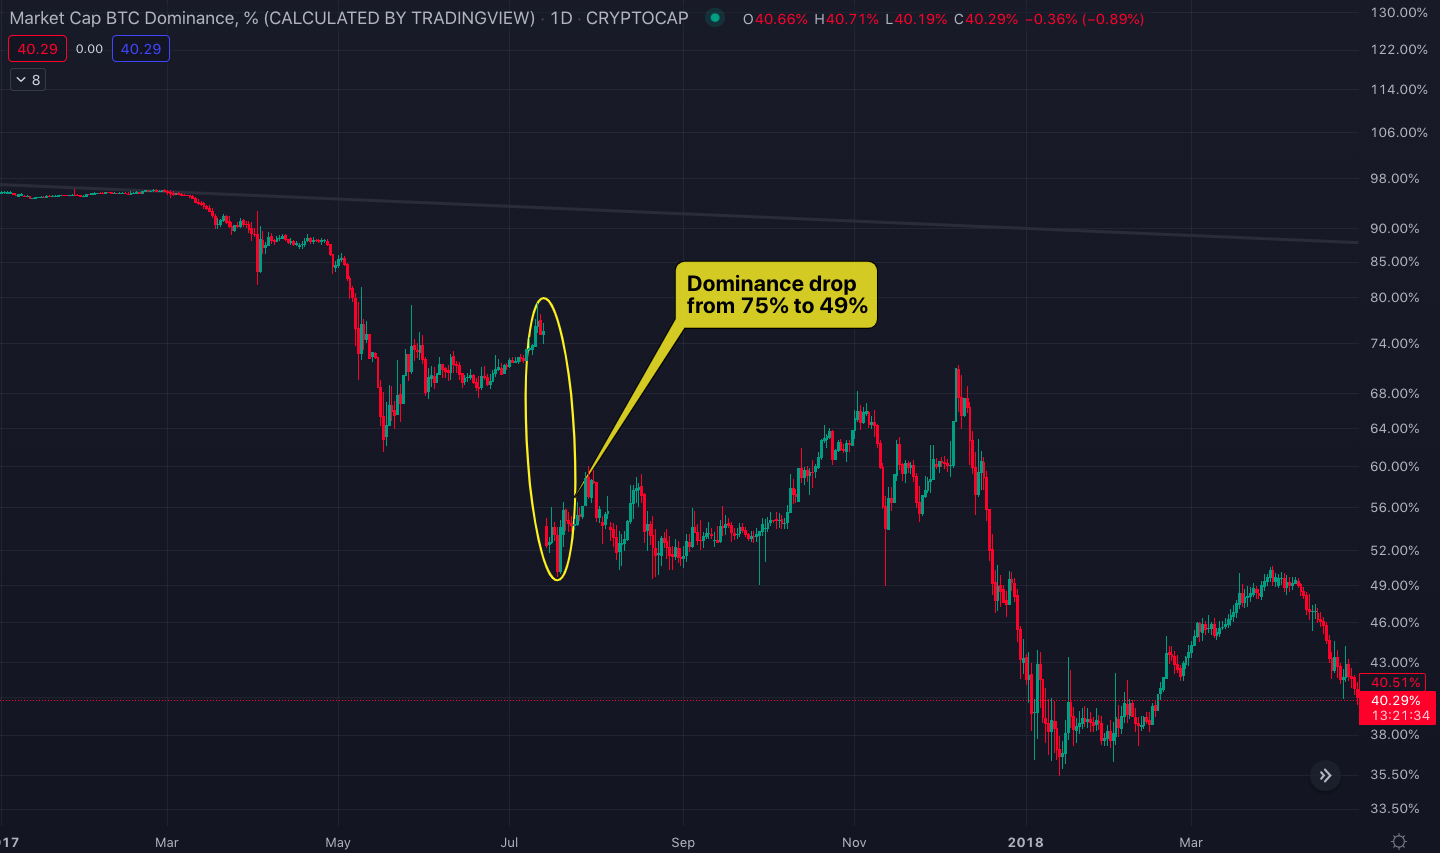
Bitcoin dominance dropped from 75% to 49% in July 2017.
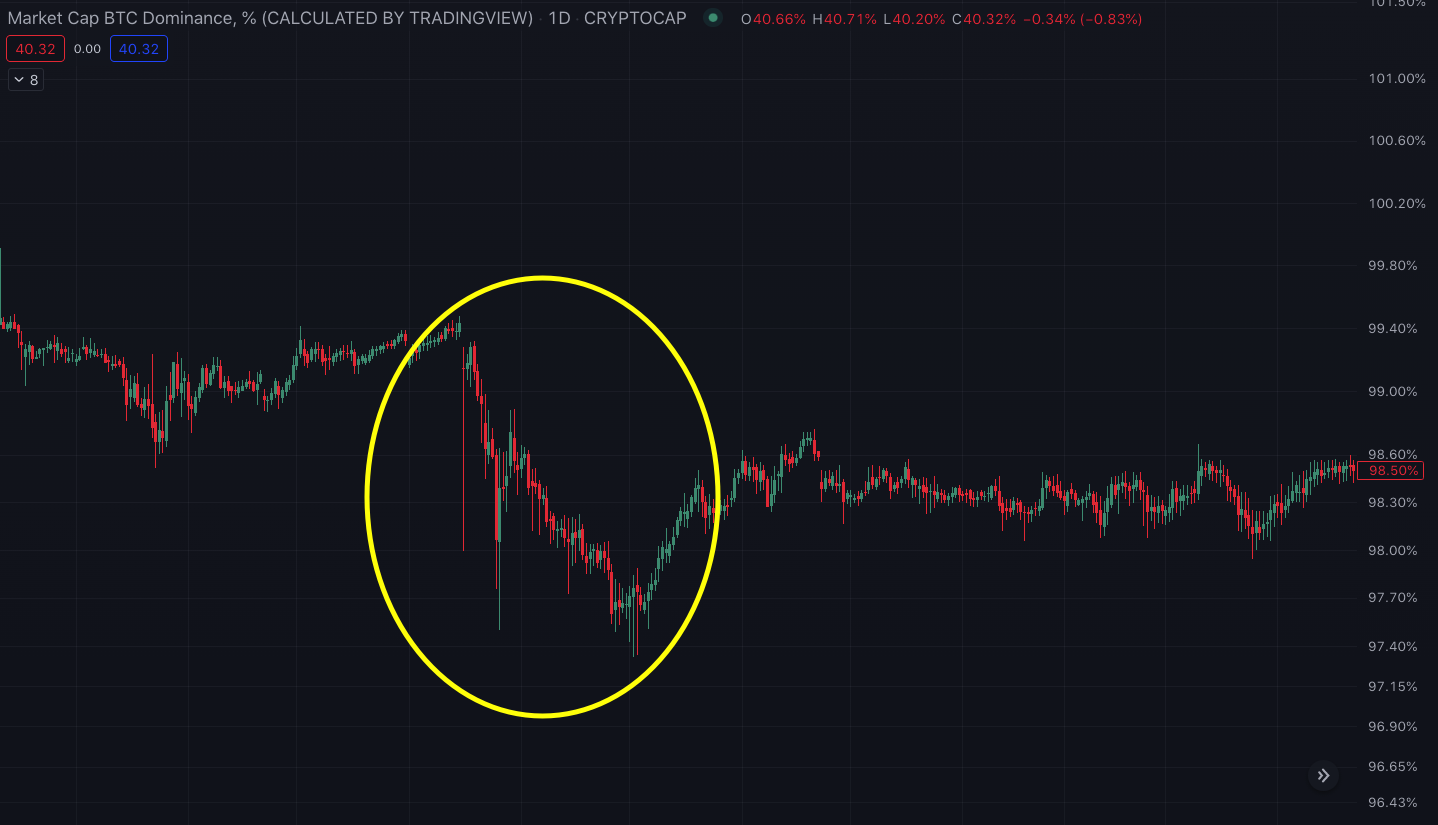
The last incident was in the first half of 2021 when Dogecoin made an eye-watering 200x rally, thanks to Elon Musk’s promotional tweets (circled in yellow in the chart below). In the meantime, Bitcoin dominance simultaneously dropped from 73% to a low of 40% in May 2021.
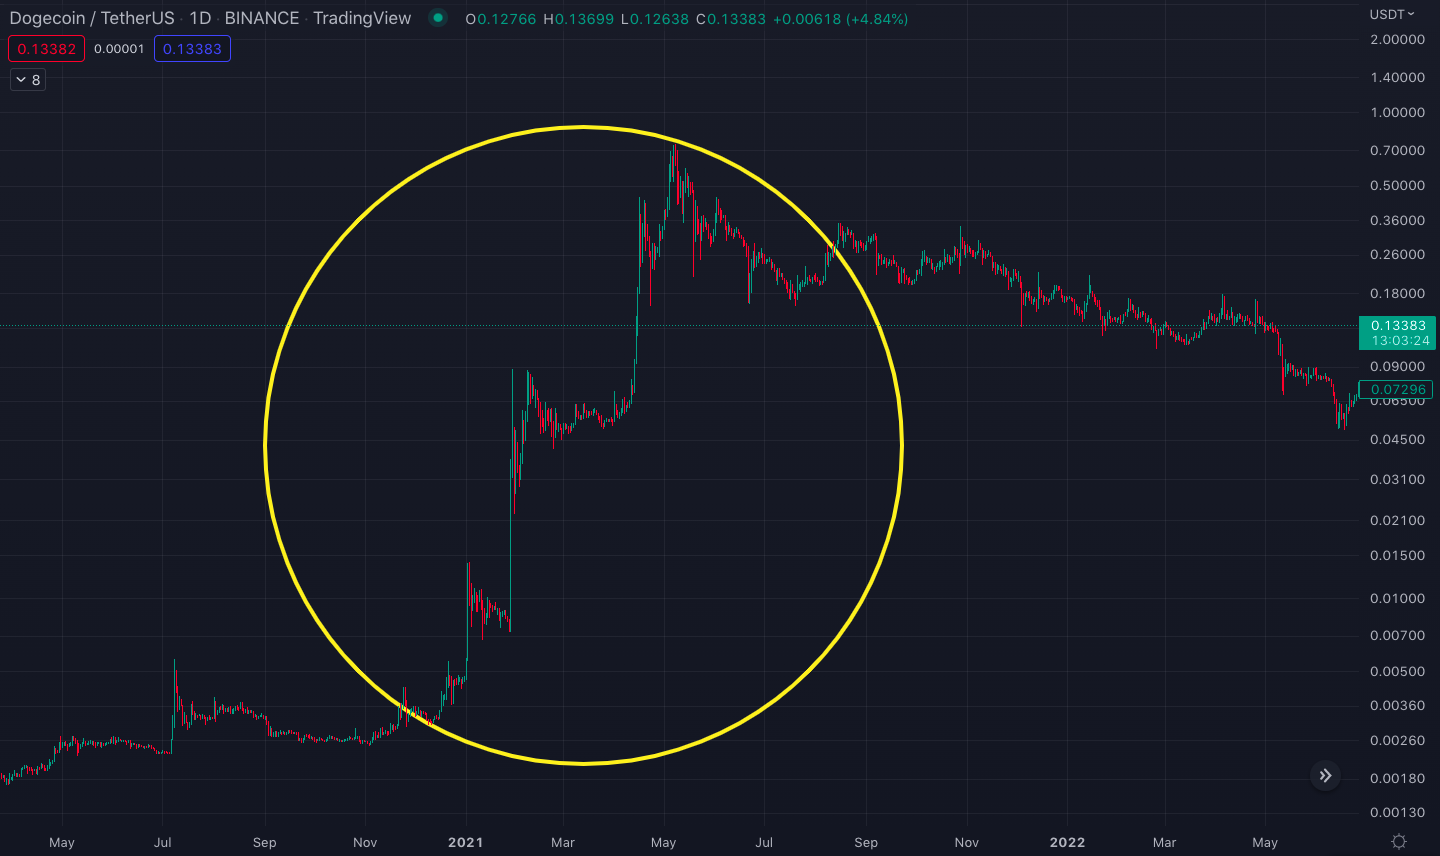
Dogecoin’s 200x rally from $0.00350 in January 2021 to $0.70 in May 2021.
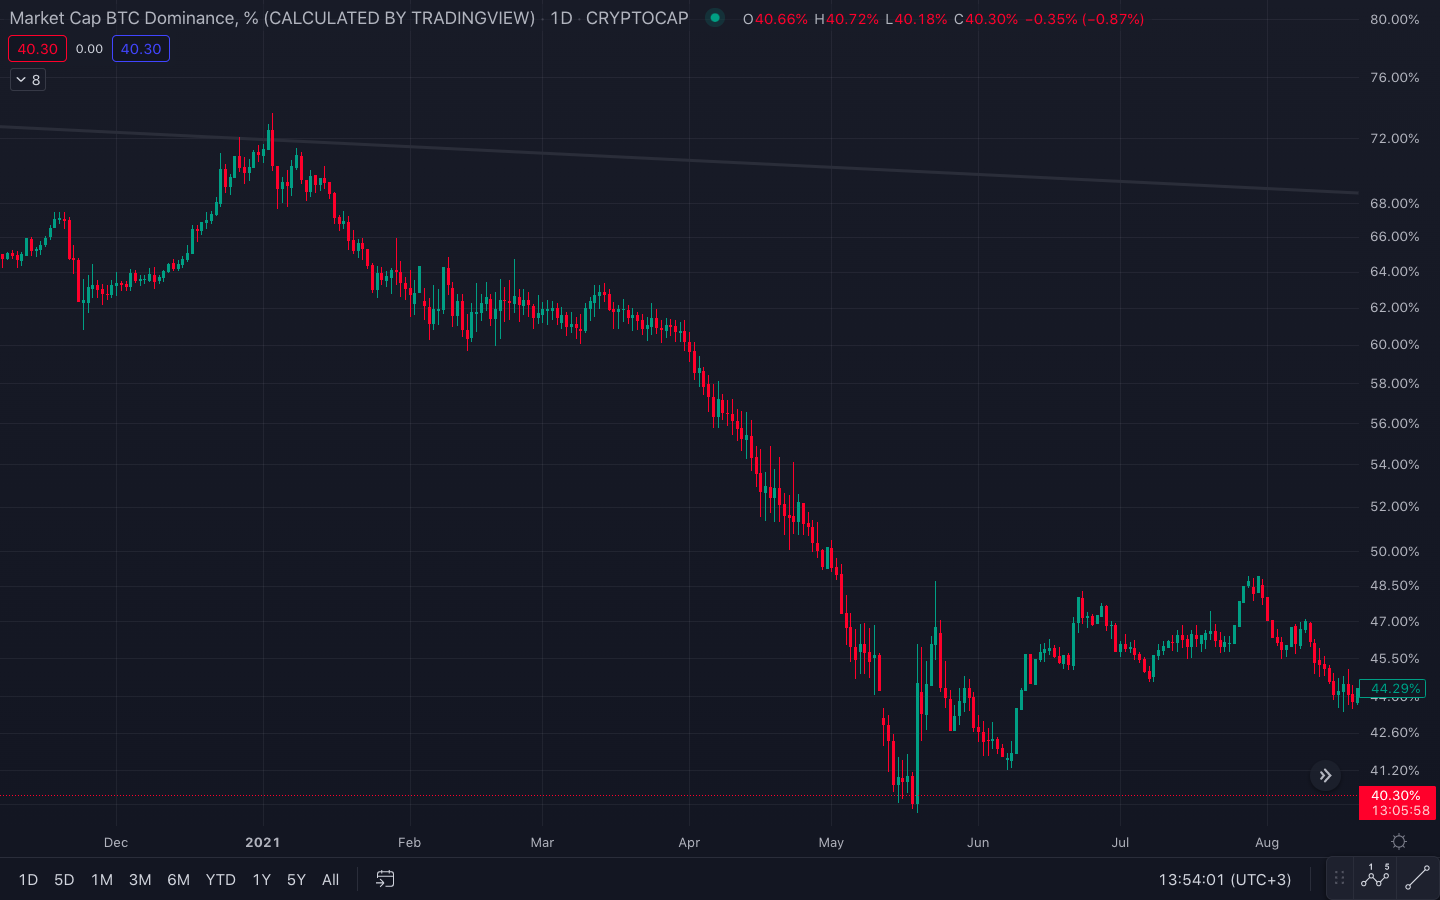
Bitcoin dominance dropped from 73% to 40% in 2021, in tandem with the DOGE rally.
That being said, could a new altcoin season be on the horizon considering the current hype around Dogecoin? Well, first of all, Bitcoin would need to protect the $20,000 level in order to not spoil the party and break above the key 100-day SMA resistance.
Key resistance to break for Bitcoin
With last week’s rally from $19,000 to $21,000, Bitcoin touched the 100-day SMA resistance line for the third time since August. The first two attempts were met with rejection but each time, the $18,200 bottom held as support (see the chart below).
With the last attempt, the bandwidth narrowed between the 100-day SMA resistance and the $18,200 support, which could indicate Bitcoin’s poised to break either below or above these two levels with ferocity, considering its current all-time low volatility.
With the squeeze between the $18,200 support and the 100-day SMA resistance, the price chart of Bitcoin has evolved into a textbook descending triangle structure. Statistically speaking, descending triangles tend to break to the downside during macro downtrends, and Bitcoin has indeed been in one since the $69,000 all-time high.
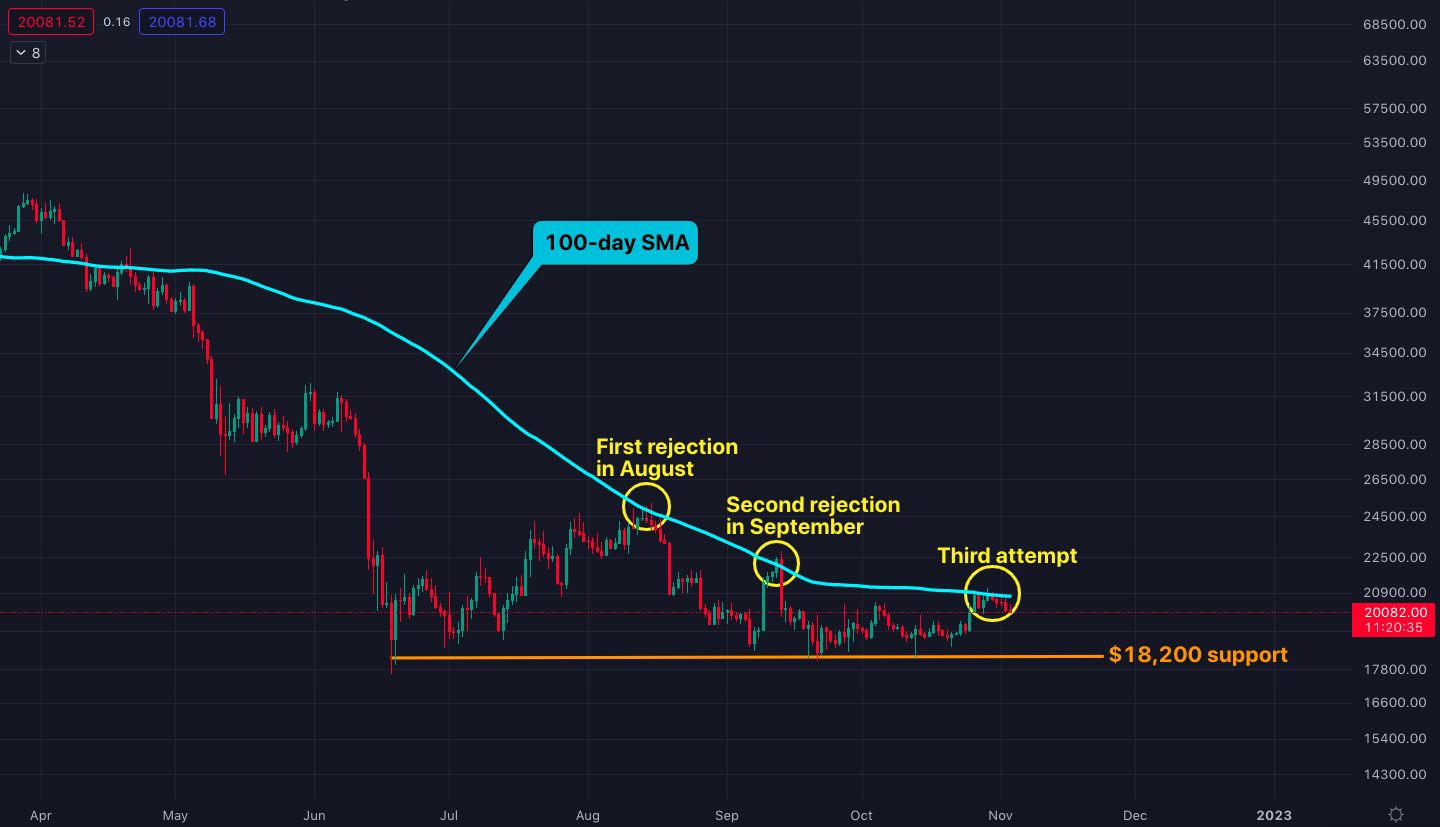
Daily Bitcoin/U.S. dollar chart with the 100-day SMA resistance and the $18,200 support.
However, the opposite could also happen if Bitcoin breaks the triangle to the upside. For Bitcoin to break above the 100-day SMA, the S&P 500 stock index would need to hold its foot as it continues struggling along last summer’s rising channel resistance (see the chart below).
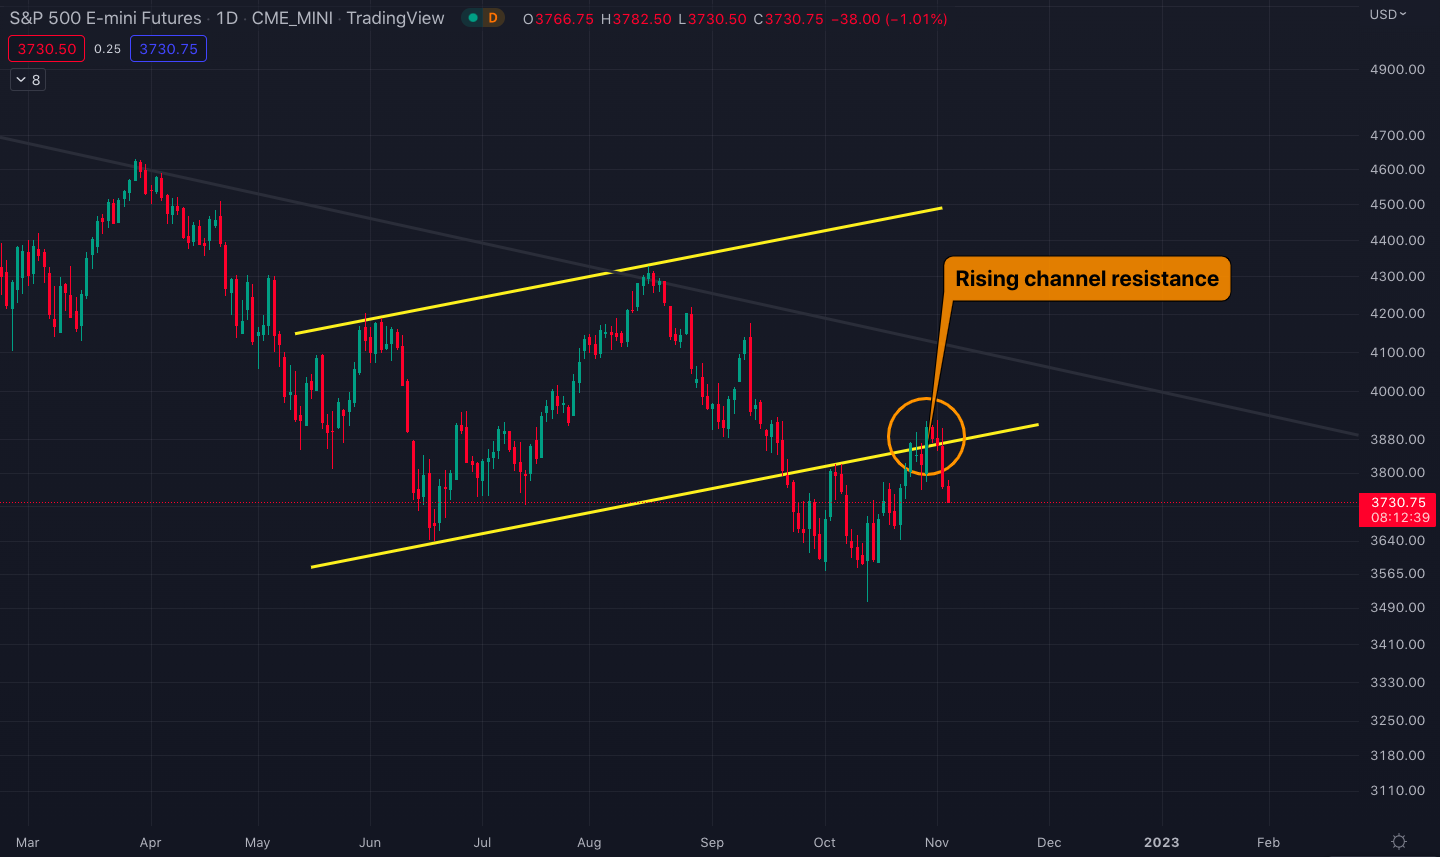
S&P 500 index price chart with the current rising channel resistance.
If the S&P does not break down from the rising channel resistance and the price of Bitcoin finally penetrates above the 100-day SMA resistance, the 200-day SMA could be the obvious short-term target for Bitcoin at $24,000, which also corresponds to the peak of last summer’s rally (see the chart below).
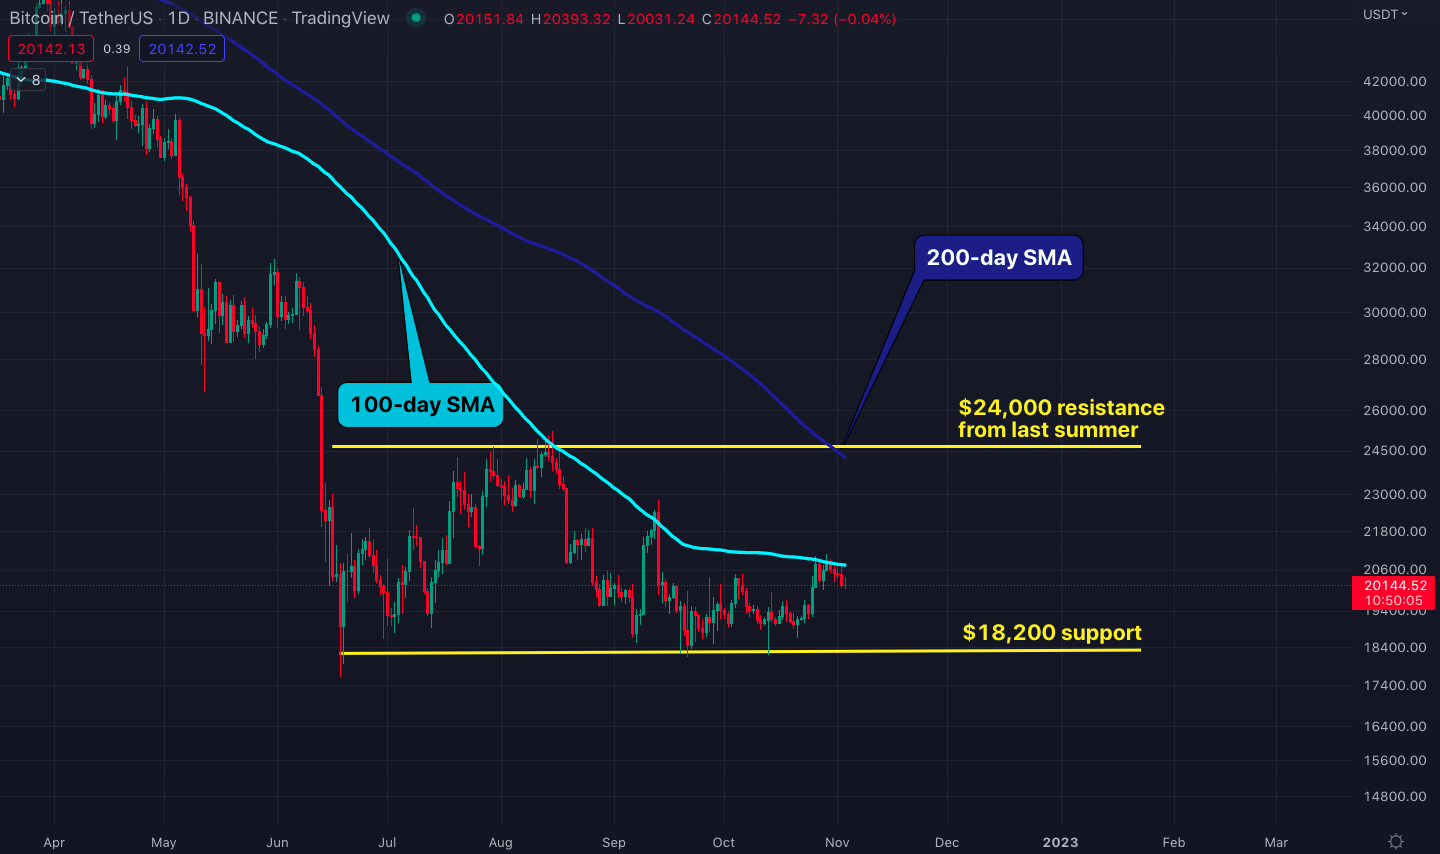
Bitcoin price chart with key support and resistance levels.
As 200-day SMAs typically define bear and bull markets for cryptocurrencies, how Bitcoin will behave at that level could also determine the fate of a long-awaited altcoin season.
In terms of Bitcoin dominance, it is at the critical 40% support now which it’s been holding since May 2021 (see the chart below). The quadruple bottom last month following the May 2021, September 2021, and January 2022 bottoms was received as the ultimate reversal sign. In turn, the market was generally convinced that Bitcoin could take the reins back from there by starting a new uptrend.
However, the bounce from last month’s bottom has proved quite weak as of yet, which may suggest the dominance could be unable to march toward the high end of the horizontal channel at 48%. If that happens, Bitcoin’s breaking above the 100-day SMA could give altcoins much further room to rally higher.
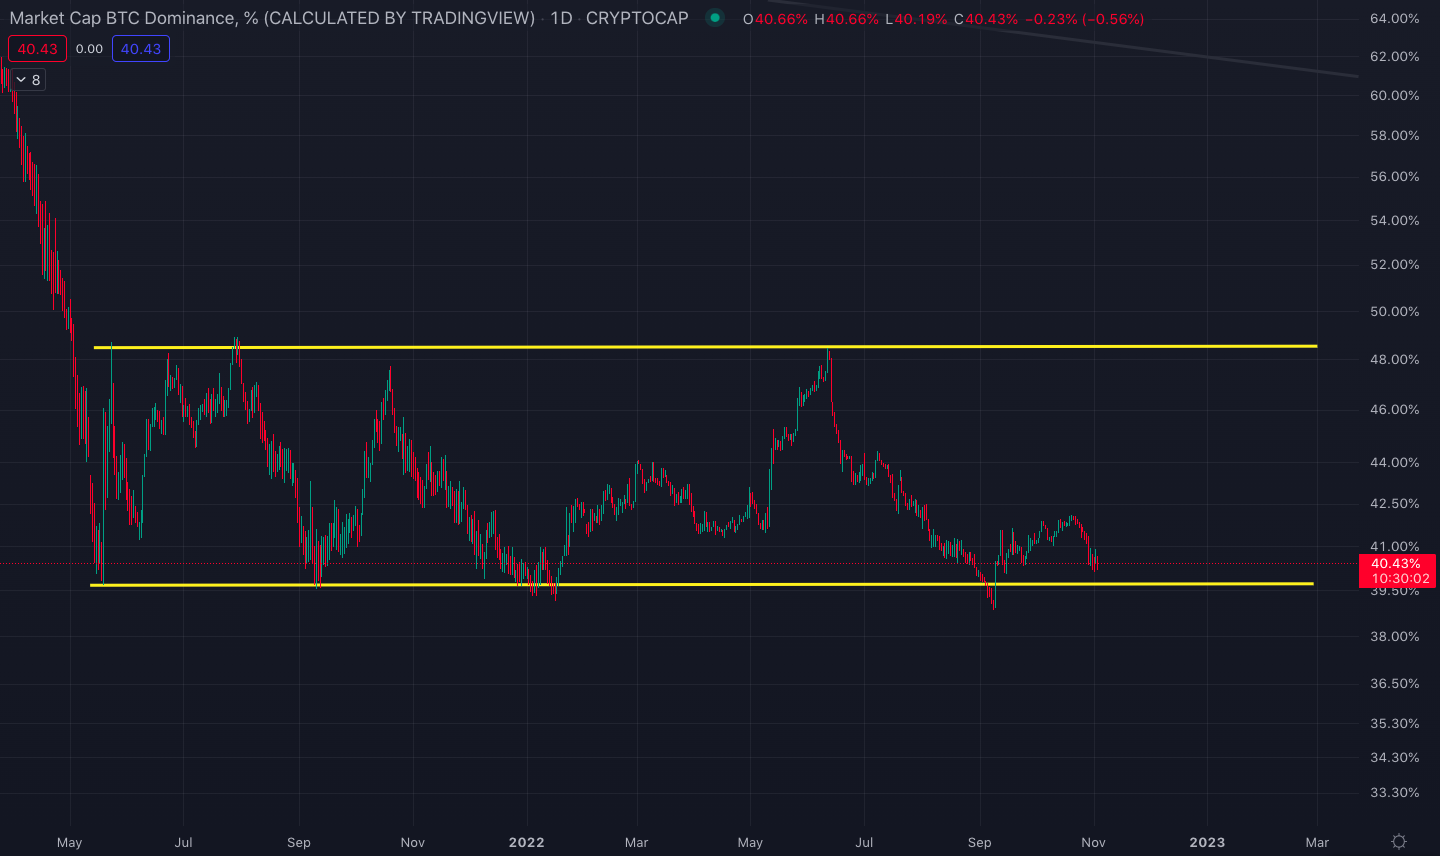
Bitcoin dominance chart with 40% support and 48% resistance.
Ethereum at a critical crossroads
After respecting the $1,200-$1,300 support line for over a month, Ethereum finally took off last week with the Bitcoin rally and hit a high of $1,665.
Going forward, the Ethereum/Bitcoin trading pair could play a key role in determining Ethereum’s next large move.
After holding the 0.066 support for over a month, just like the $1,300 base in the U.S. dollar parity, the ETH/BTC pair marched to a high of 0.079 last week (see the chart below).
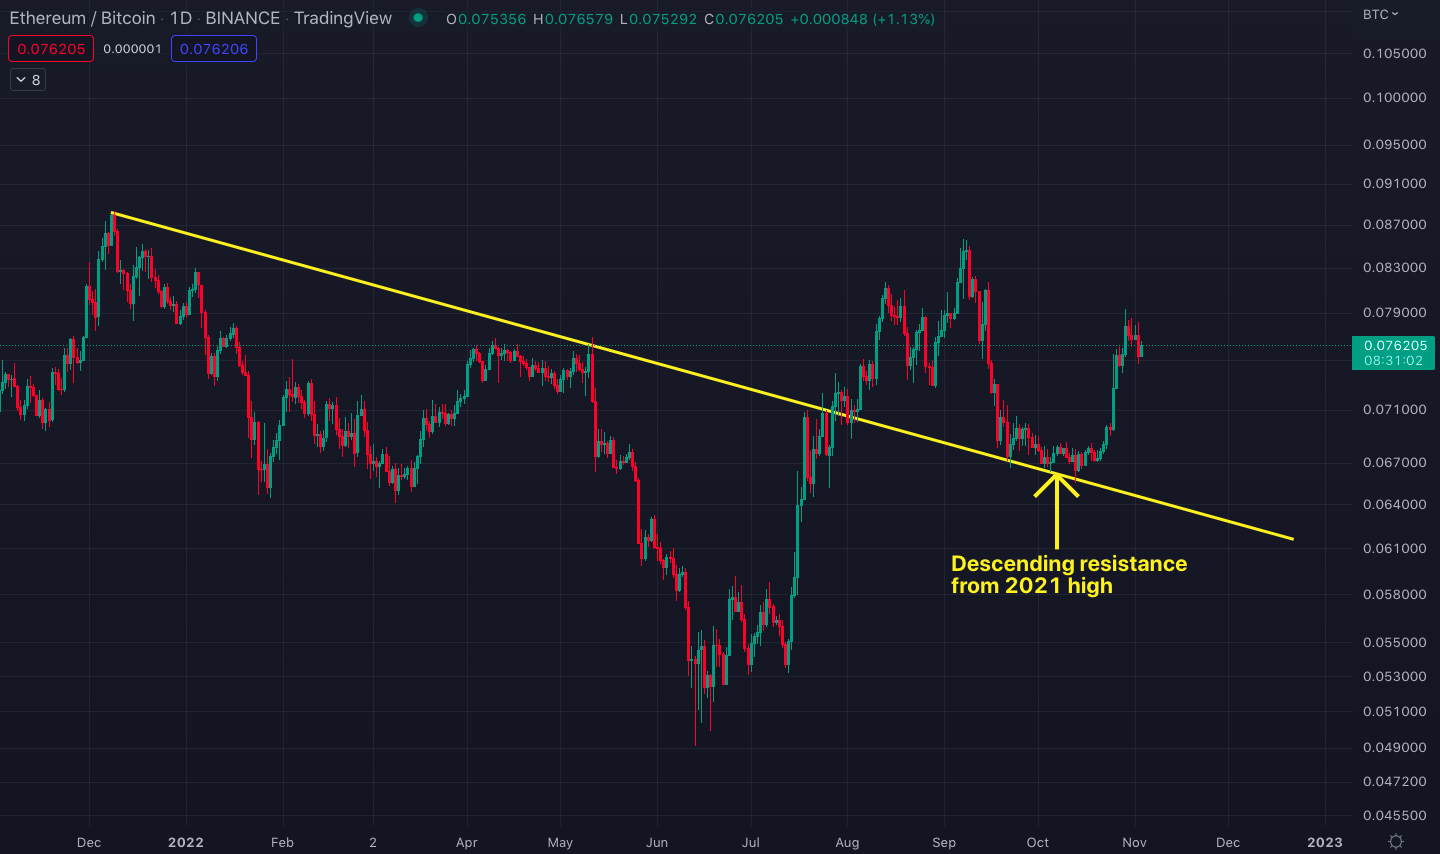
ETH/BTC chart with the former descending resistance line acting as support at 0.66.
If the parity can climb above 0.085 and turn it into support upon a weekly or monthly close, Ethereum could be off to the races and spur a new altcoin season.
The 0.085 level is critical because we saw strong resistance during both the 2017 and 2021 bull markets (see the chart below). Therefore, penetrating above 0.085 could bring a new all-time high price for ETH/BTC and potentially a new all-time low for Bitcoin dominance.
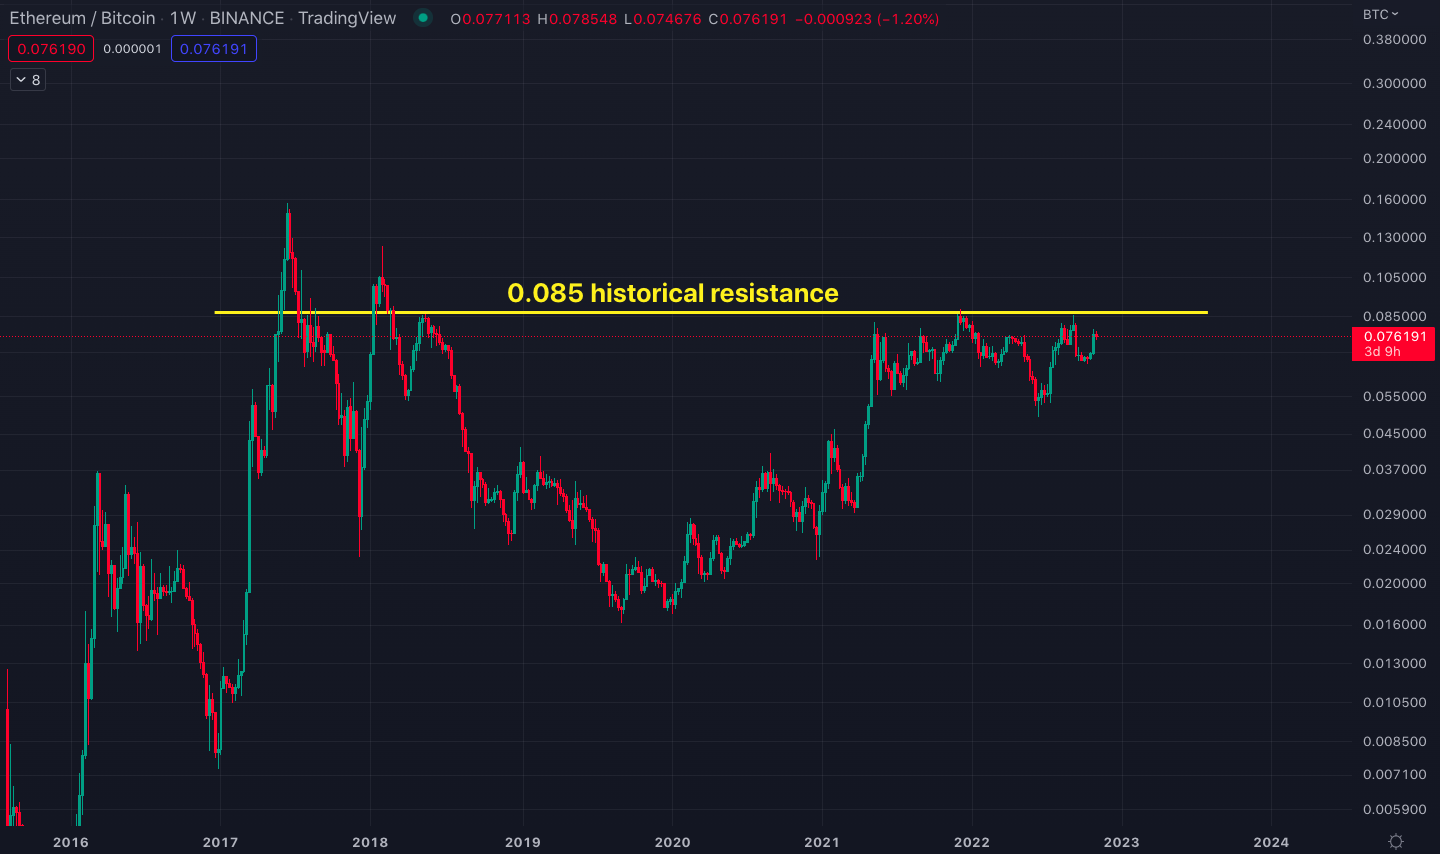
ETH/BTC chart on a weekly time frame with the 0.085 historical resistance.
If the Ethereum/Bitcoin pair marches further, a run to $2,200 could be possible in the USD trading pair, which is the current price level of the descending resistance line initiated by last year’s all-time high.
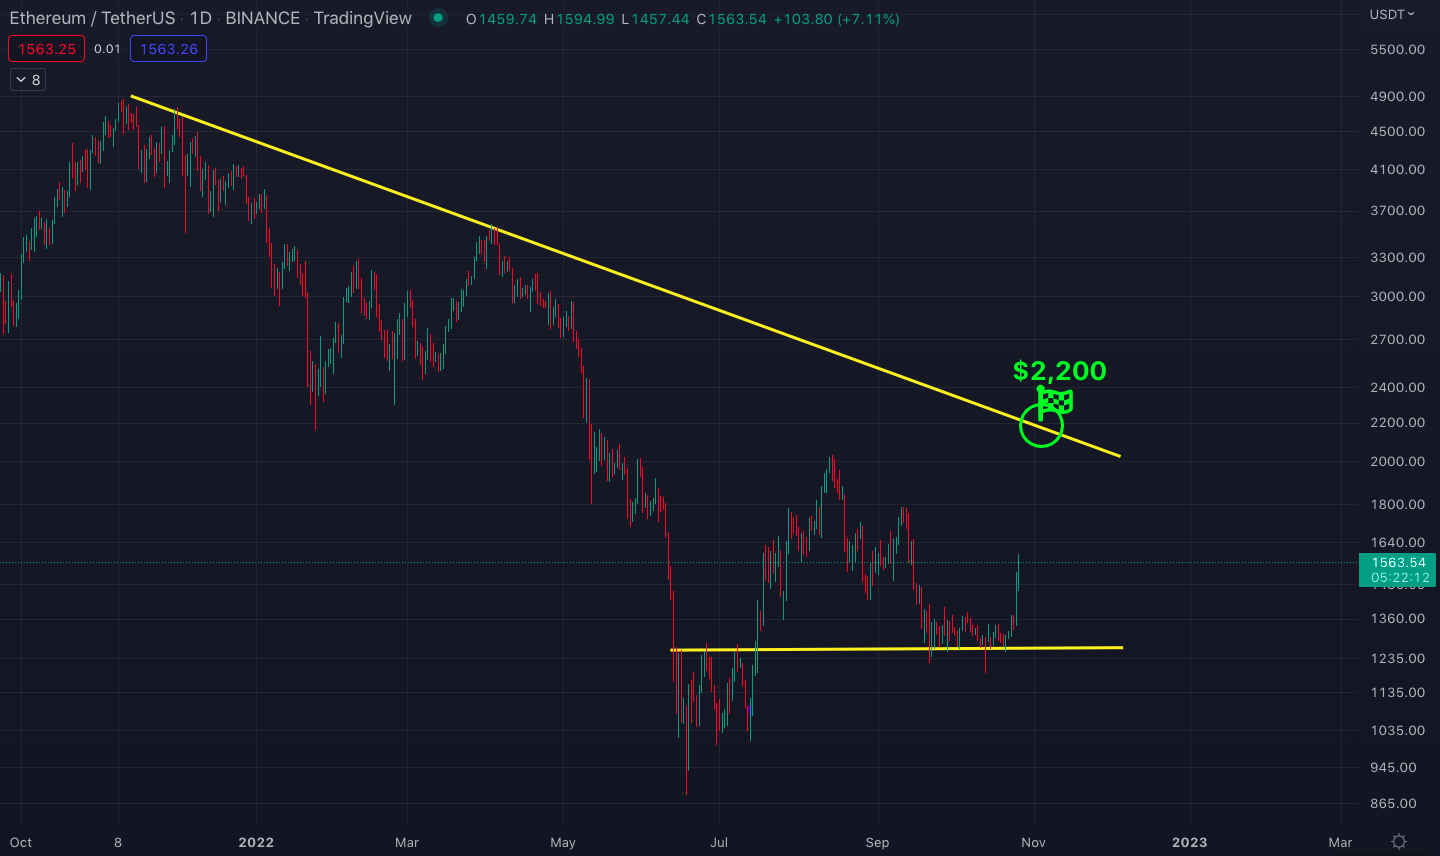
Ethereum/U.S. dollar price chart with the $2,200 descending resistance target.
Will Chainlink and Aave start the party again?
In the previous growth cycle from 2019 to 2021, Chainlink and Aave ignited a bull market long before both the Dogecoin and Ethereum rallies.
The reason these two cryptos could act as catalysts was that they were seen as the founders of the decentralized finance (DeFi) category, which has proved the largest use case in the crypto ecosystem to date. In that sense, the previous bull market was born on the DeFi narrative.
Chainlink ($LINK) is a data oracle network that connects smart contracts with off-chain data. This enables users to create smart contracts that can automatically settle real-life applications such as sports betting, logistics operations, and trade financing. This use case has enabled Chainlink to become one of the most widely-adopted blockchain projects in the crypto ecosystem.
Aave ($AAVE), on the other hand, is the first popularly adopted decentralized lending and borrowing platform.
Chainlink was the first mover following the December 2018 bear market bottom, which saw the price of LINK increase by 25x in 2019 while most of the market was still in the red (see the chart below).
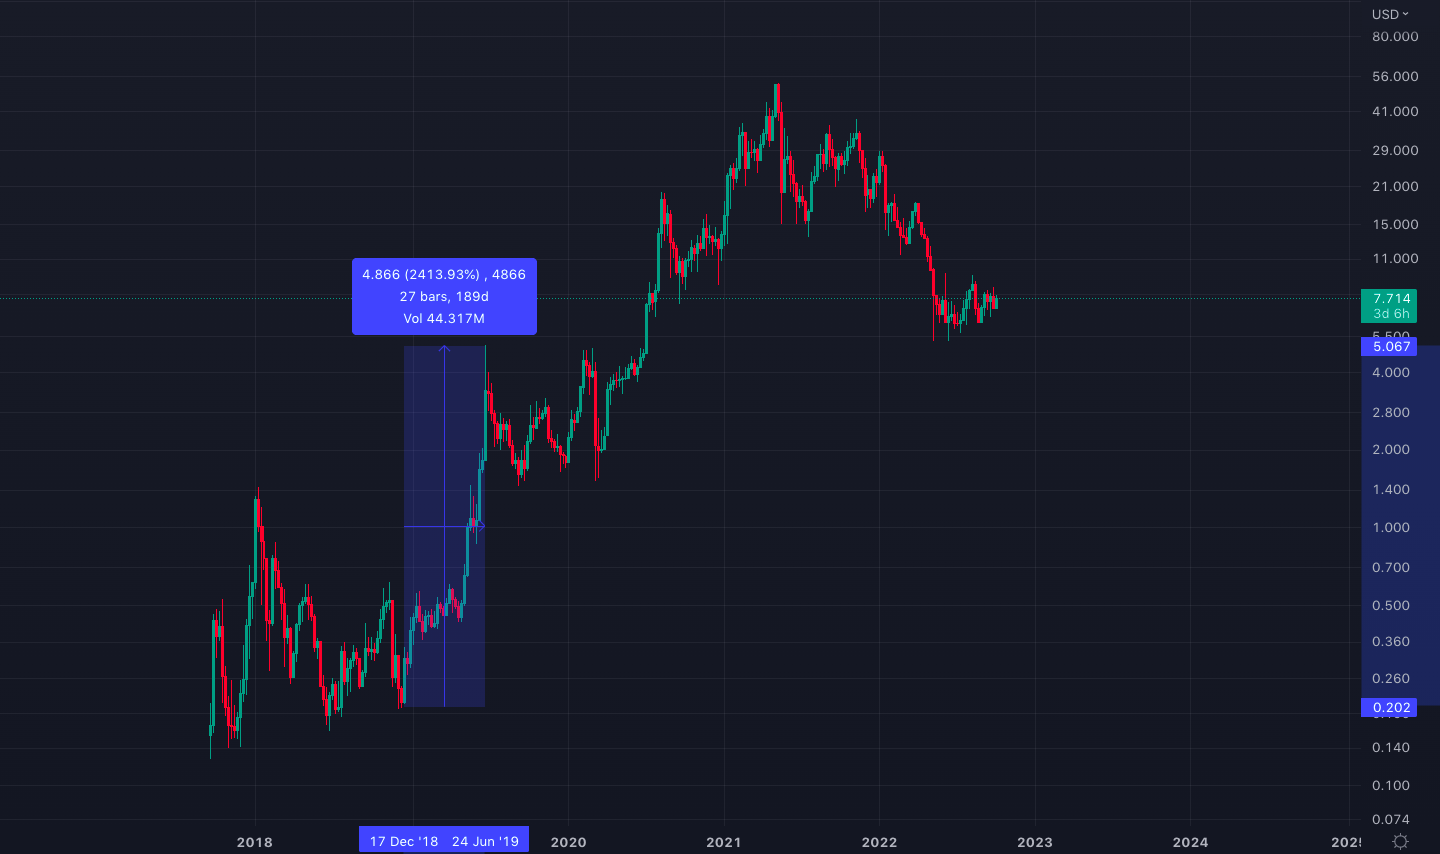
Chainlink/U.S. dollar price chart on the weekly time frame.
AAVE followed suit with a nine-month lag to LINK and was the best performer of the previous bull cycle with an unbelievable 2,000x price advance from $0.40 to $700 in less than 20 months (see the chart below).
The price of AAVE has been following a perfect bull flag structure demonstrated by its bounce off the lower support line during the June market bottom.
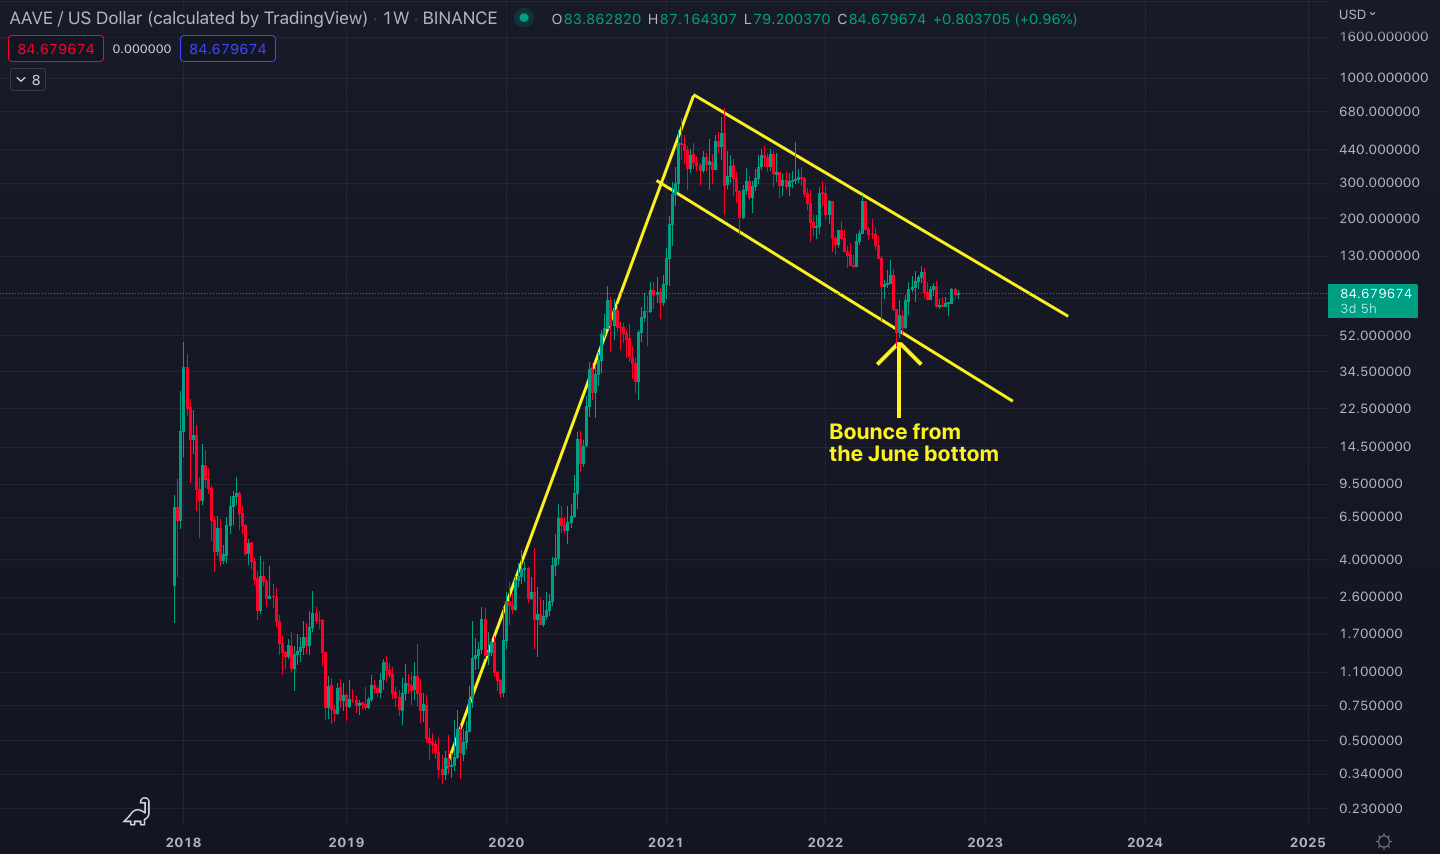
Aave/U.S. dollar price chart with the ongoing bull flag structure.
If the above bull flag plays out, AAVE could trigger its second bull market as the target price of that long-term flag would be an unfathomably high $20,000 per coin. Target prices for bull flags are typically estimated by extrapolating the length of the pole from a possible breakout point on the flag, which in that case would be around $20,000 for AAVE.
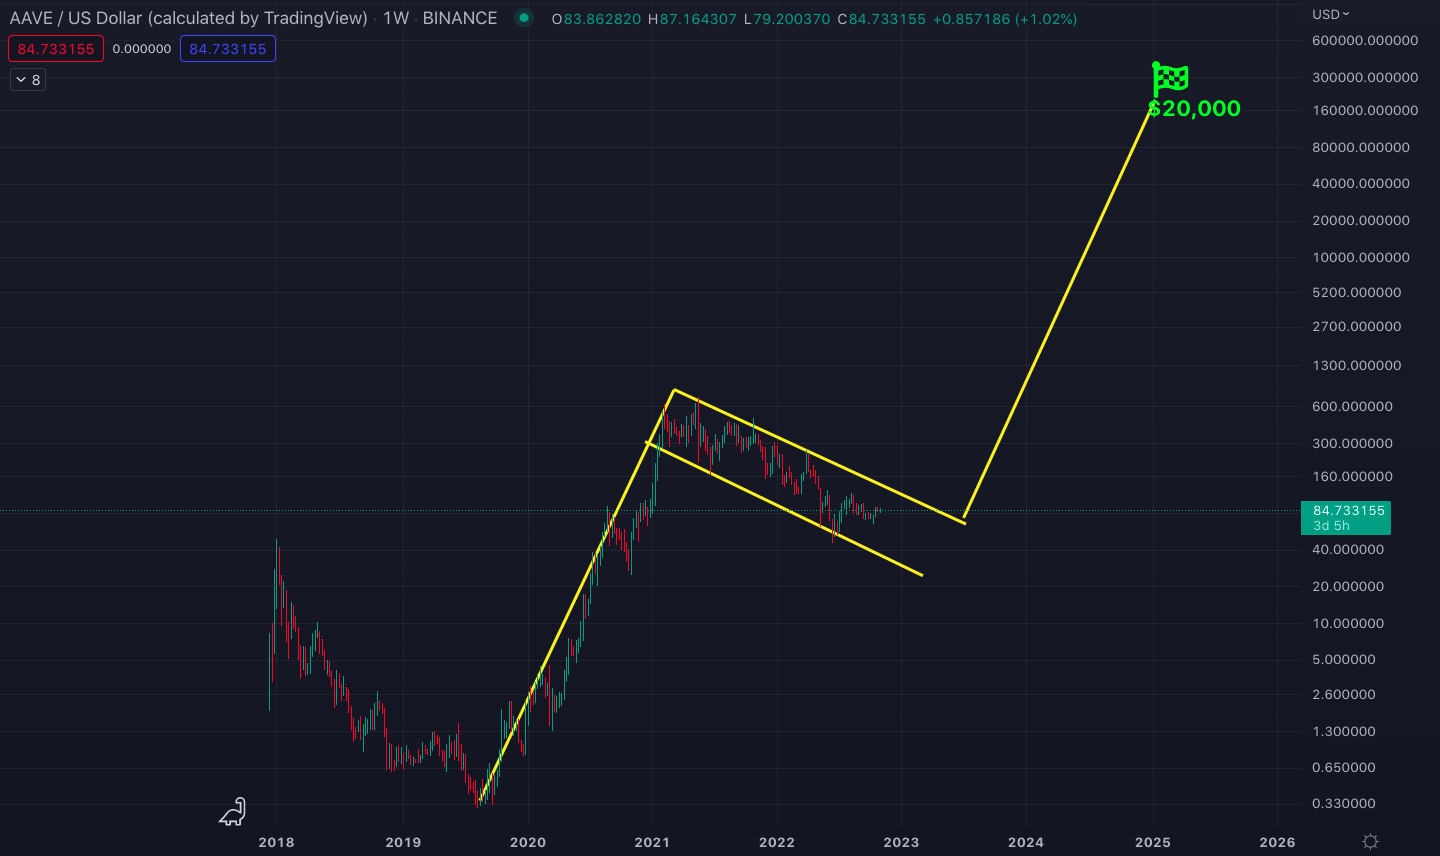
Aave/U.S. dollar price chart with the potential bull flag target.
In terms of Chainlink, LINK has been following an ascending triangle since the June market bottom (see the chart below). If the price can decisively break above this triangle in the coming weeks (in other words, above $9.5), history could repeat, and Chainlink could start its second bull market, together with Aave.
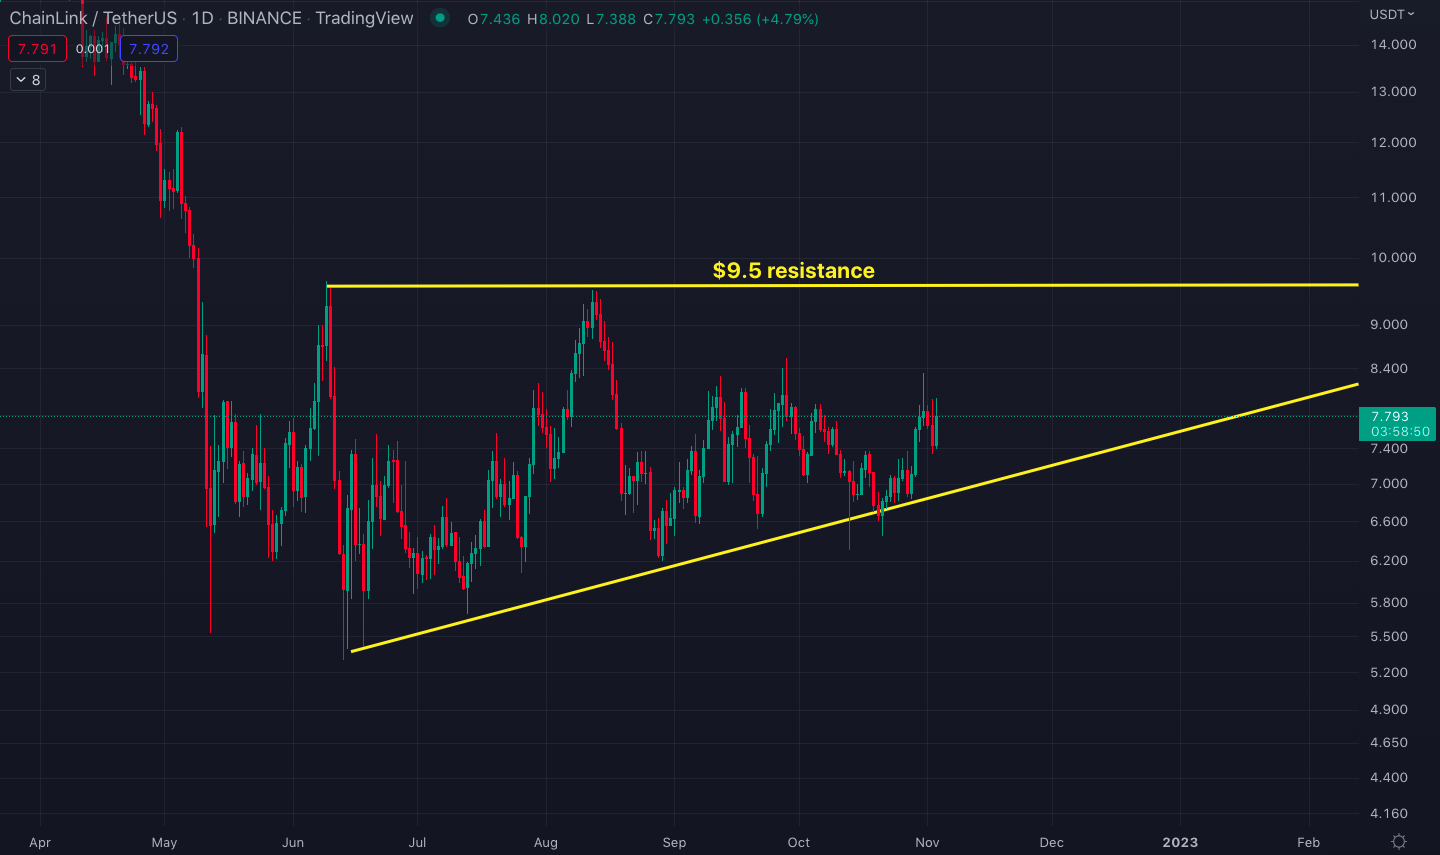
Chainlink/U.S. dollar price chart with the ascending triangle and the $9.5 resistance.
Chiliz decoupled from the market
Chiliz ($CHZ), the popular sports and entertainment token platform by Socios.com, has been one of the strongest runners since the June market bottom, fueled by the migration to its own chain and positive expectations surrounding the new sports seasons.
This has generally been the case with sports club stocks as well, which tend to rally before the onset of new seasons.
The Chiliz platform is used to create fan tokens which are used for participating in various sports events and club decisions as well as campaigns, rewards, and airdrops.
With the positive catalysts, CHZ was able to rally from the $0.08 low in June to a high of $0.24 by the end of August (see the chart below).
Although most altcoins have retraced significantly since their August highs, Chiliz quickly recovered its losses by climbing to a high of $0.25 this week, largely decoupling from the rest of the crypto market. This could likely be due to the potential upcoming events for the FIFA World Cup this month.
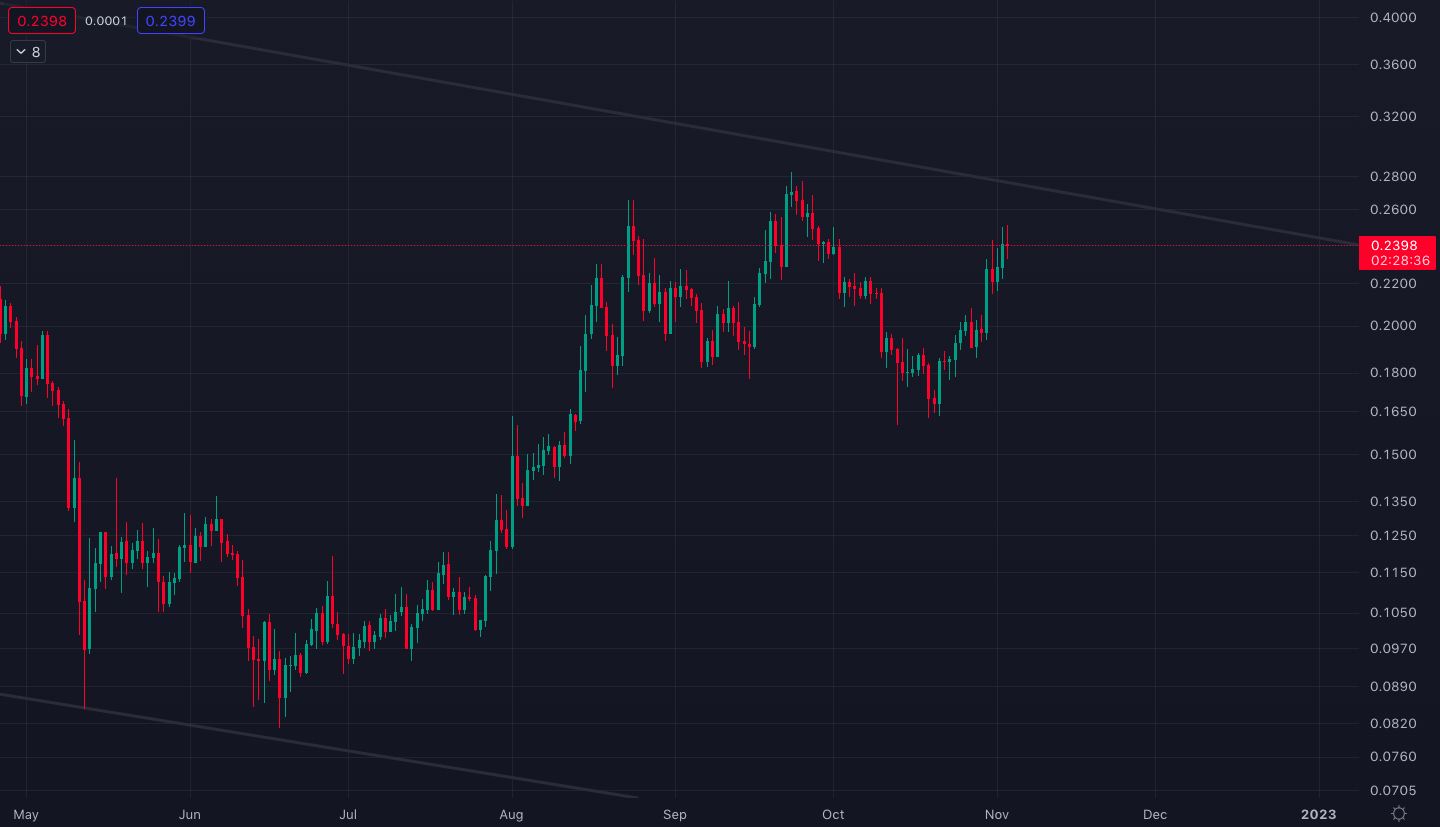
Chiliz/U.S. dollar price chart since the June market bottom.
Chiliz has also been following a long-term bull flag, and with this week’s rally, the price of CHZ is fast approaching the resistance line of the flag (see the chart below). If CHZ’s bull flag decisively breaks to the upside on a monthly close, Chiliz’s recent decoupling from the market could magnify dramatically and encourage the popular sports platform to potentially start its own bull market like Aave did back in late 2019.
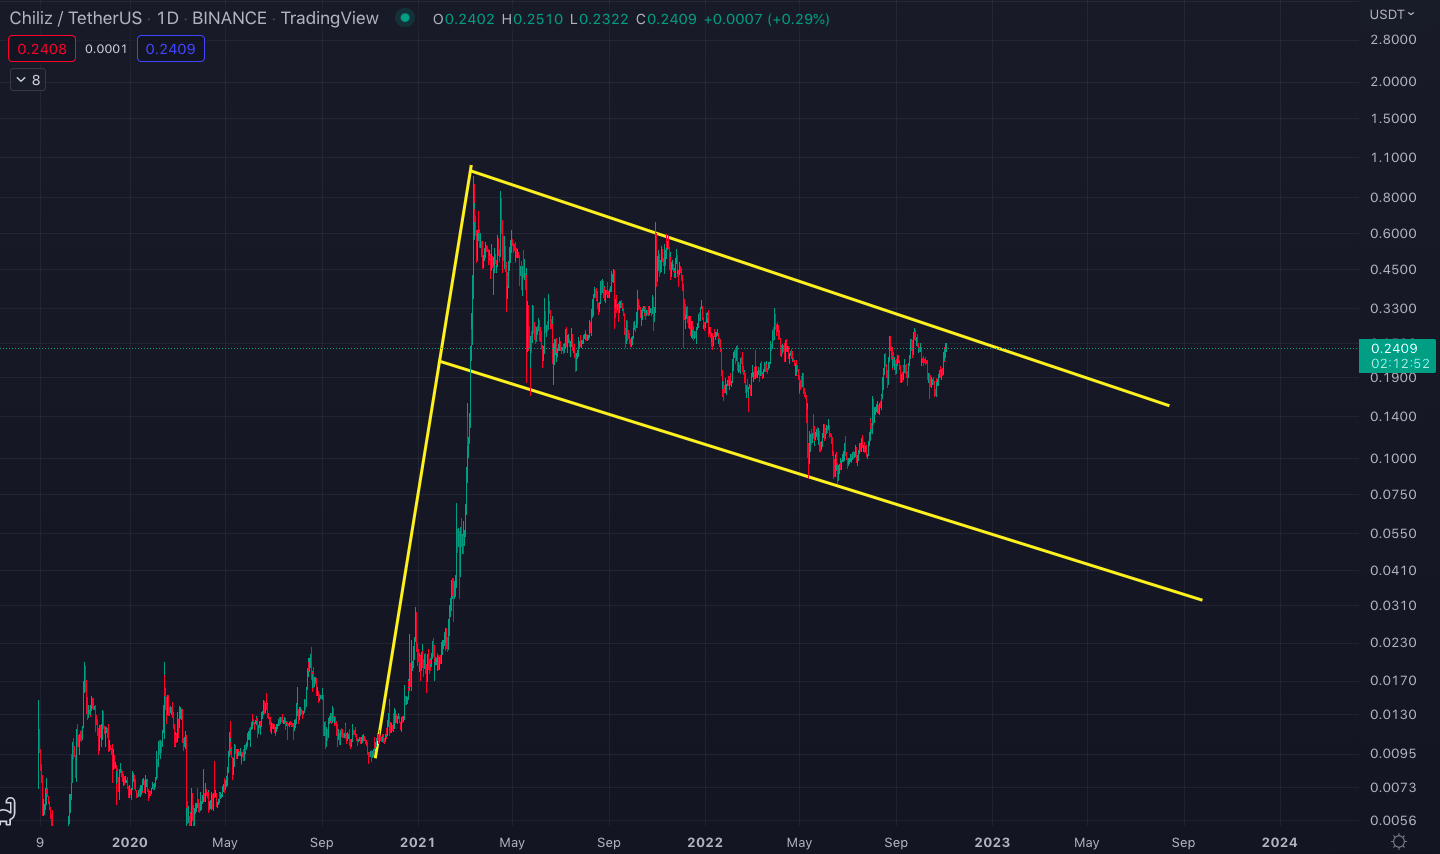
CHZ’s potential bull flag which started in the 2021 bull market.
Tune in next week, and every week, for the latest CEX.IO crypto ecosystem update. For more information, head over to the Exchange to check current prices, or stop by CEX.IO University to continue expanding your crypto knowledge.
Disclaimer: Information provided by CEX.IO is not intended to be, nor should it be construed as financial, tax or legal advice. The risk of loss in trading or holding digital assets can be substantial. You should carefully consider whether interacting with, holding, or trading digital assets is suitable for you in light of the risk involved and your financial condition. You should take into consideration your level of experience and seek independent advice if necessary regarding your specific circumstances. CEX.IO is not engaged in the offer, sale, or trading of securities. Please refer to the Terms of Use for more details.