
Key Findings:
- Total stablecoin supply decreased for the first time since Q3 2023, slipping to $312 billion, as yield-bearing and crypto-backed tokens reversed years of gains.
- Ethereum Layer-2 stablecoin supply posted its biggest quarterly decline since Q4 2022, as Arbitrum lost ground to HyperEVM.
- USDC’s share of total crypto trading volume reached an all-time high of 12.5% as the asset is becoming more widely adopted on CEXs.
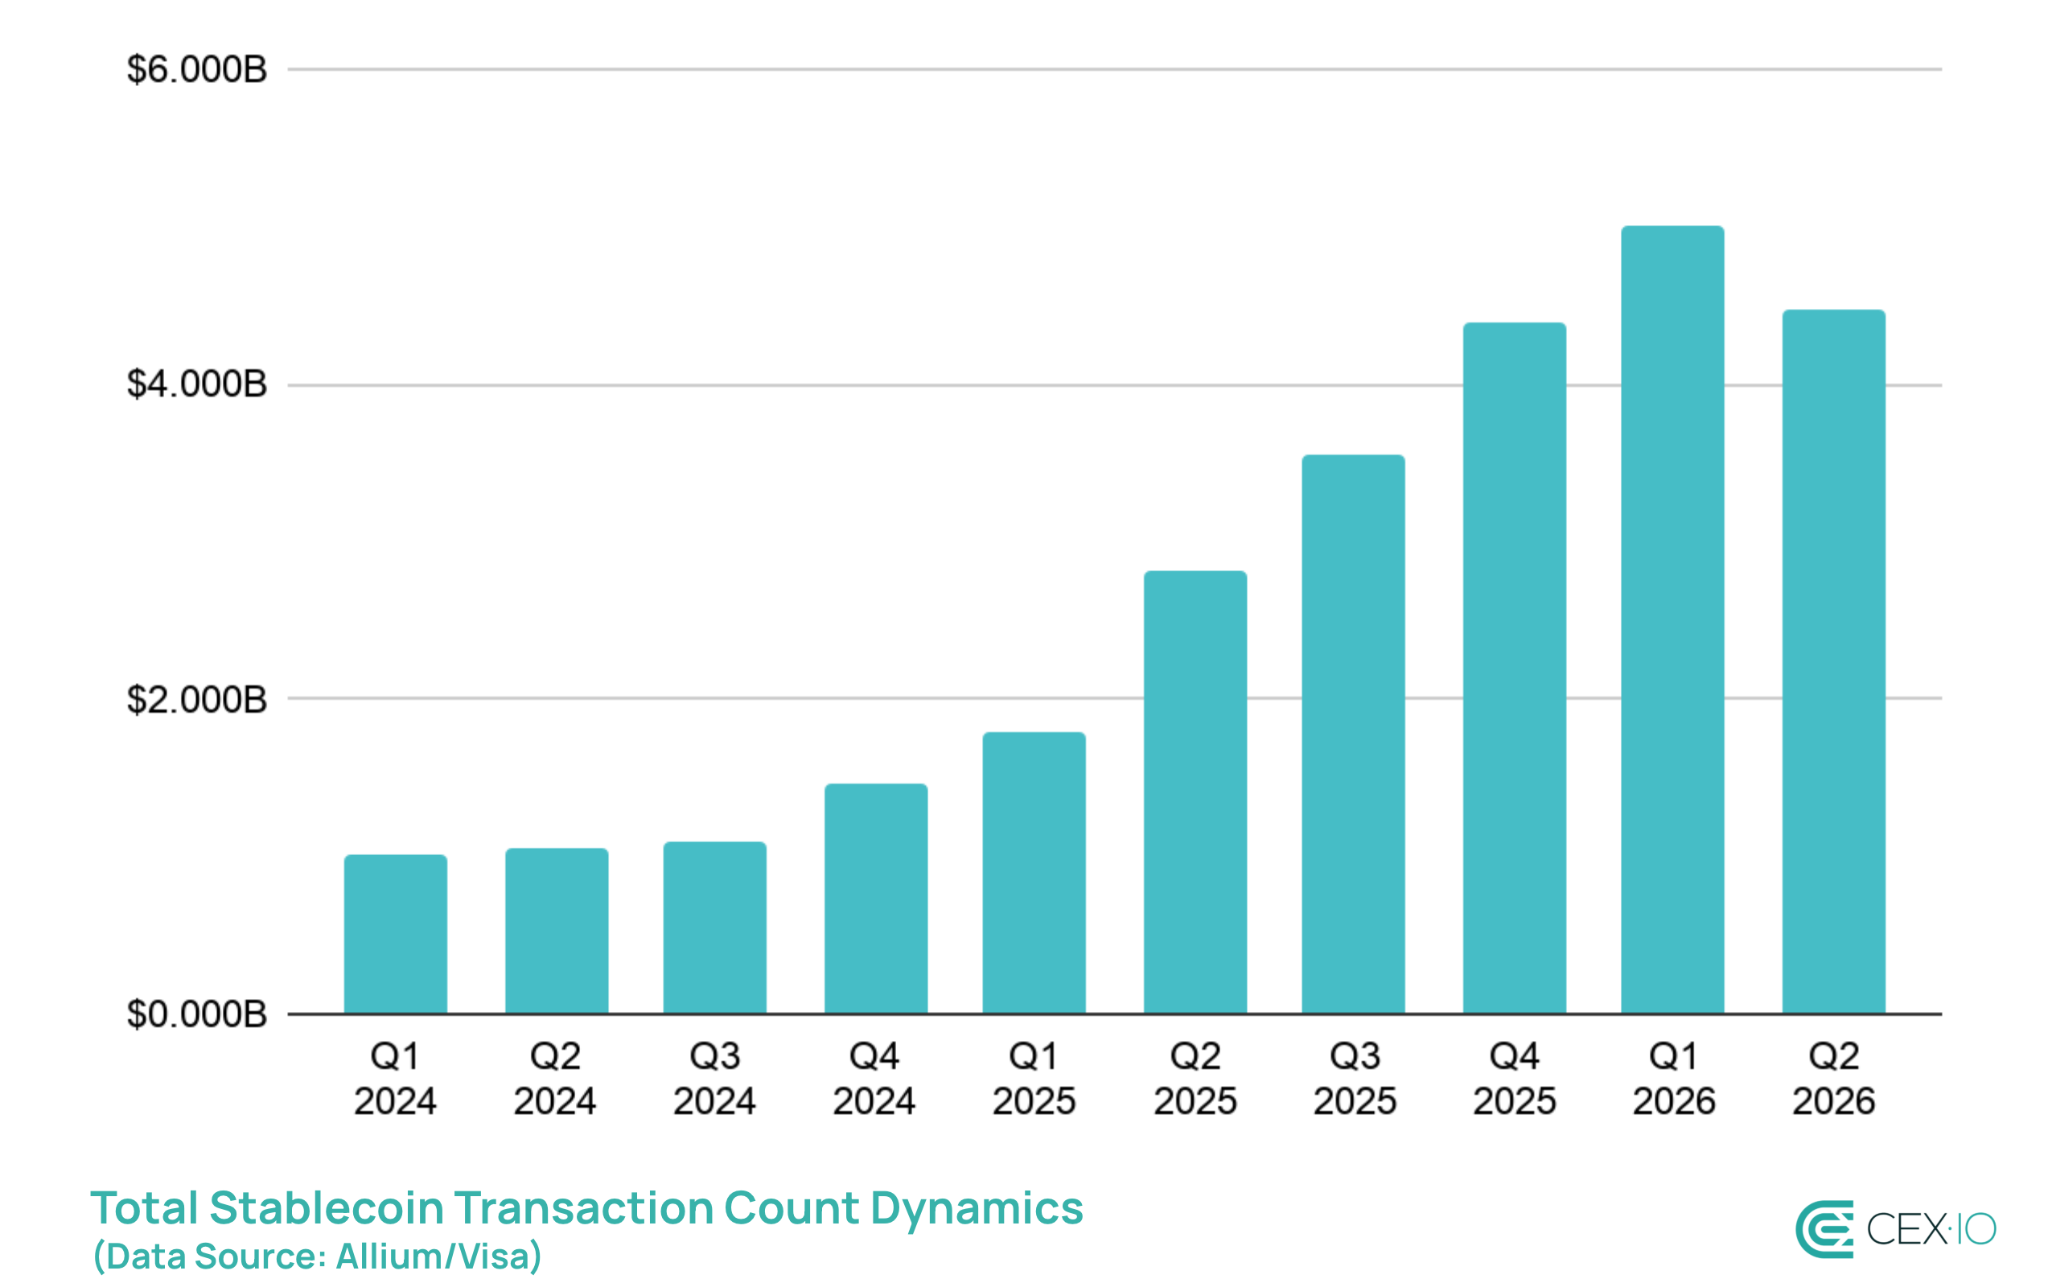
- Stablecoin transaction counts suffered their steepest quarterly drop on record, falling by 530 million.
- Organic transaction volume broke a ten-quarter growth streak, showing a 5.5% drop compared to Q1.
If Q1 2026 was about rotation, or capital moving toward stablecoins and specific tokens without the overall pie growing much, Q2 2026 is about contraction. Supply shrank outright for the first time in nearly three years, transaction counts posted their sharpest drop on record, and trading volume cooled across the board. The risk-off backdrop that drew comparisons to 2022 last quarter has become even more pronounced.
However, this doesn’t mean that stablecoin adoption stalled. In the U.S., six federal agencies are finalizing rules under the GENIUS Act. In turn, there’s a compromise on stablecoin yield within the CLARITY Act, although the bill could still be delayed. Traditional finance also kept leaning in, with SoFi and MoneyGram rolling out their own stablecoins. Japan’s three largest banks also moved a joint yen-pegged stablecoin closer to launch. All of that indicates that interest in stablecoins remains relatively high, and could potentially shape up their developments in the second half of 2026.
But for now, let’s take a closer look at what happened across stablecoin supply, trading volume, and transaction activity in Q2 2026.
Supply Dynamics
Stablecoin Supply Shrinks for the First Time Since Q3 2023
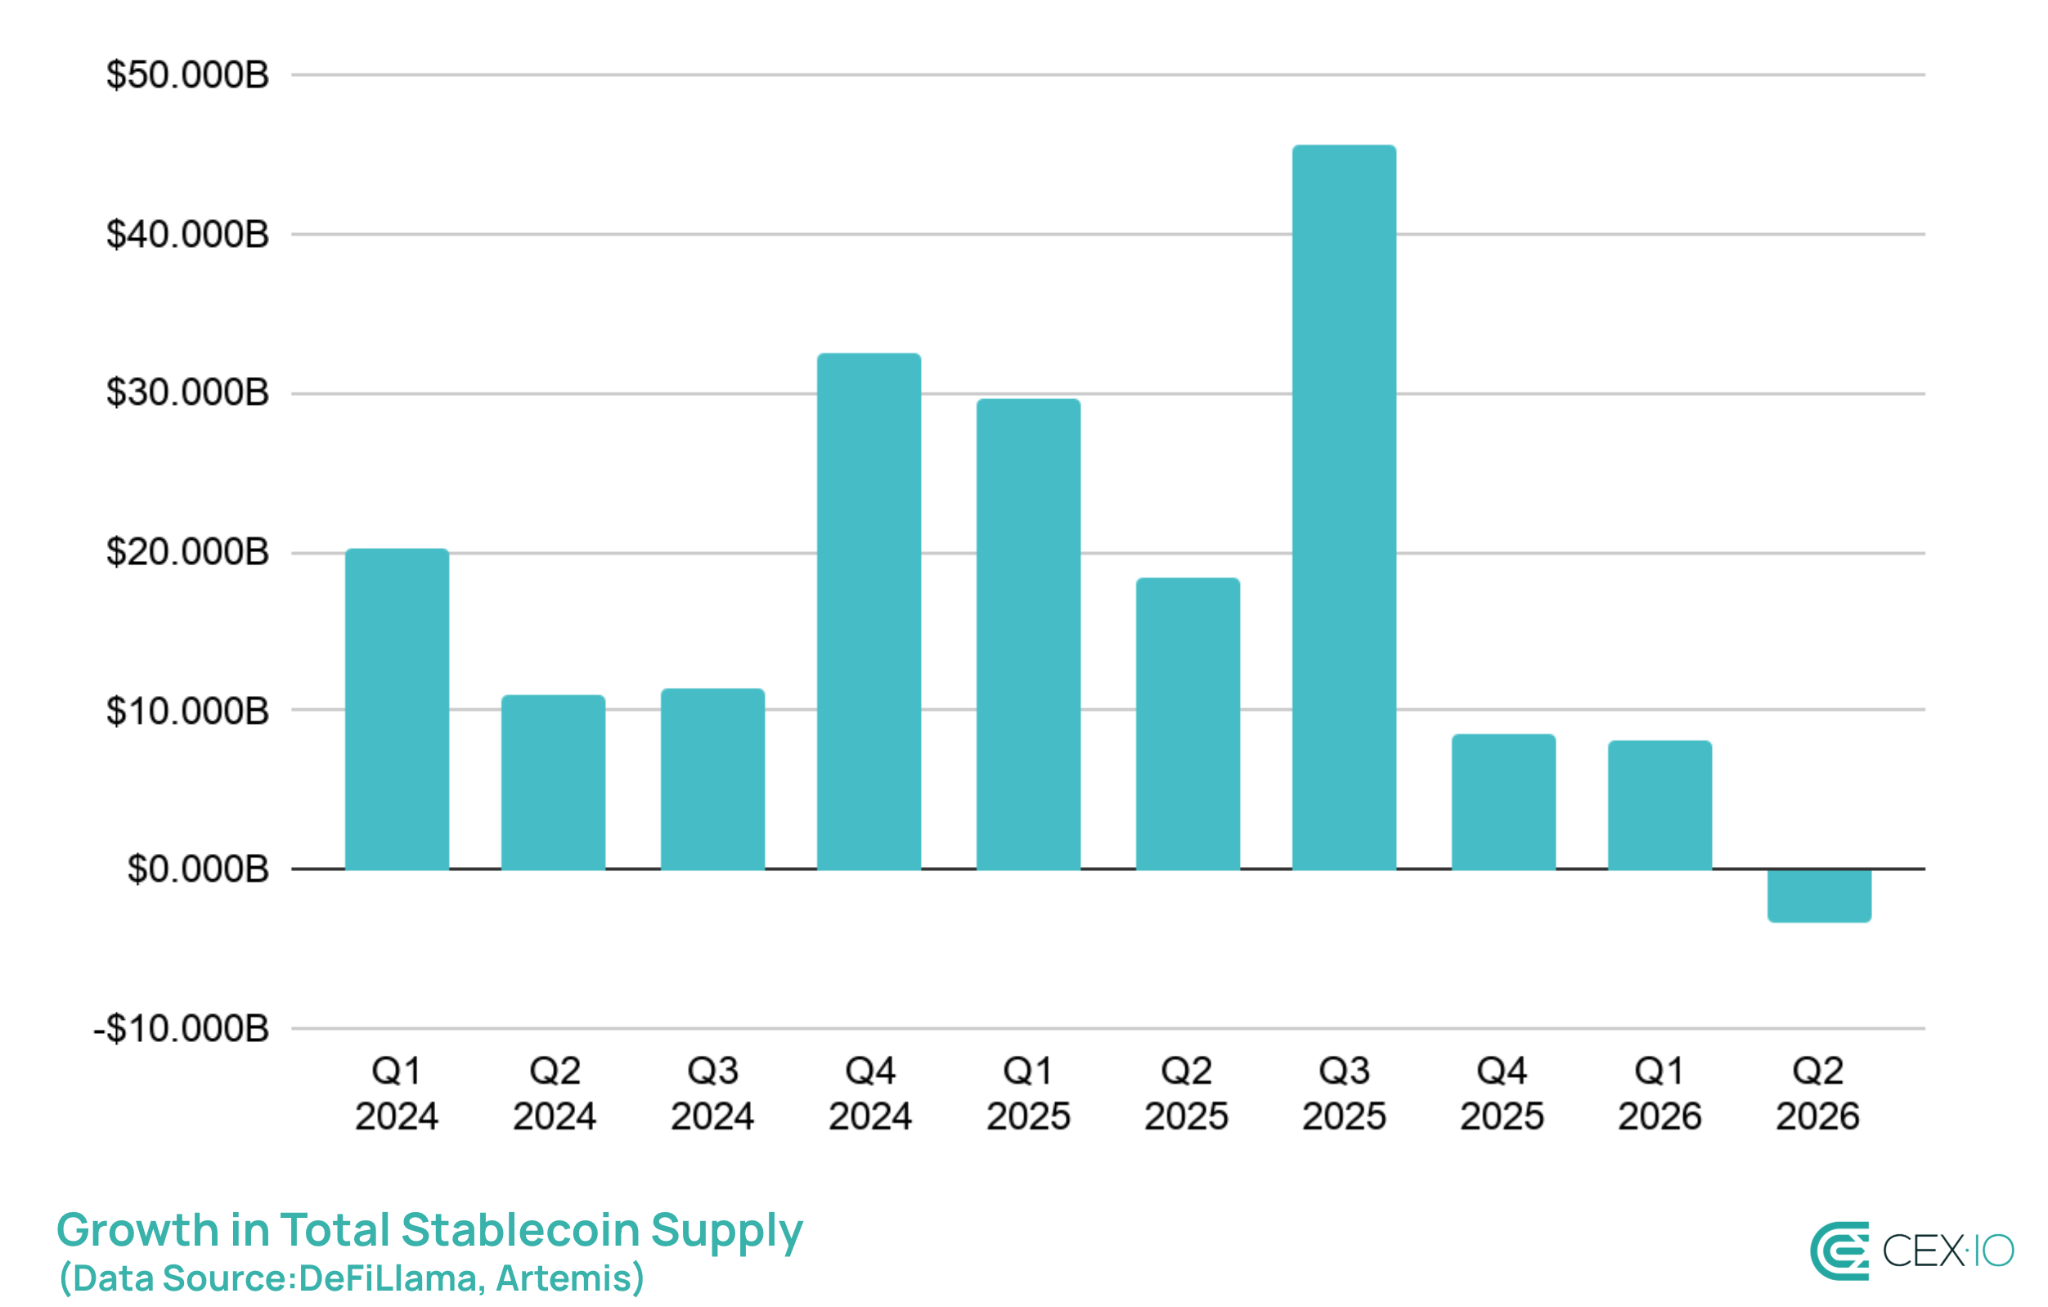
Total stablecoin supply fell to $312 billion in Q2 2026, losing more than $3 billion compared to the previous quarter. It might look like a small change in isolation, but it’s the first quarterly decline the market has posted since Q3 2023.
The slowdown had already become apparent in Q1 2026, making the latest drop more of a continuation of existing trends. A similar pattern emerged during the 2022 bear market, when stablecoin supply shifted from rapid growth to gradual contraction, with the decline persisting well into 2023. In that sense, stablecoins continue to follow their own bear market cycle.
Similarly to the 2022 bear market, stablecoins have been more resilient than the broader crypto market. While total crypto market capitalization fell 6.2% in Q2, stablecoin supply declined by only 0.4%. As a result, stablecoins’ share of the total crypto market rose from 13% to 14%, indicating that market rotation toward stablecoins within crypto is still present. However, it’s not compensating enough for the overall market exit that crypto experiences.
Yield-Bearing Stablecoins Flip From Growth Engine to Headwind
After growing every single quarter since mid-2023, including a 19% jump just last quarter, yield-bearing stablecoin supply fell over $3.5 billion, or 15%, in Q2 2026.
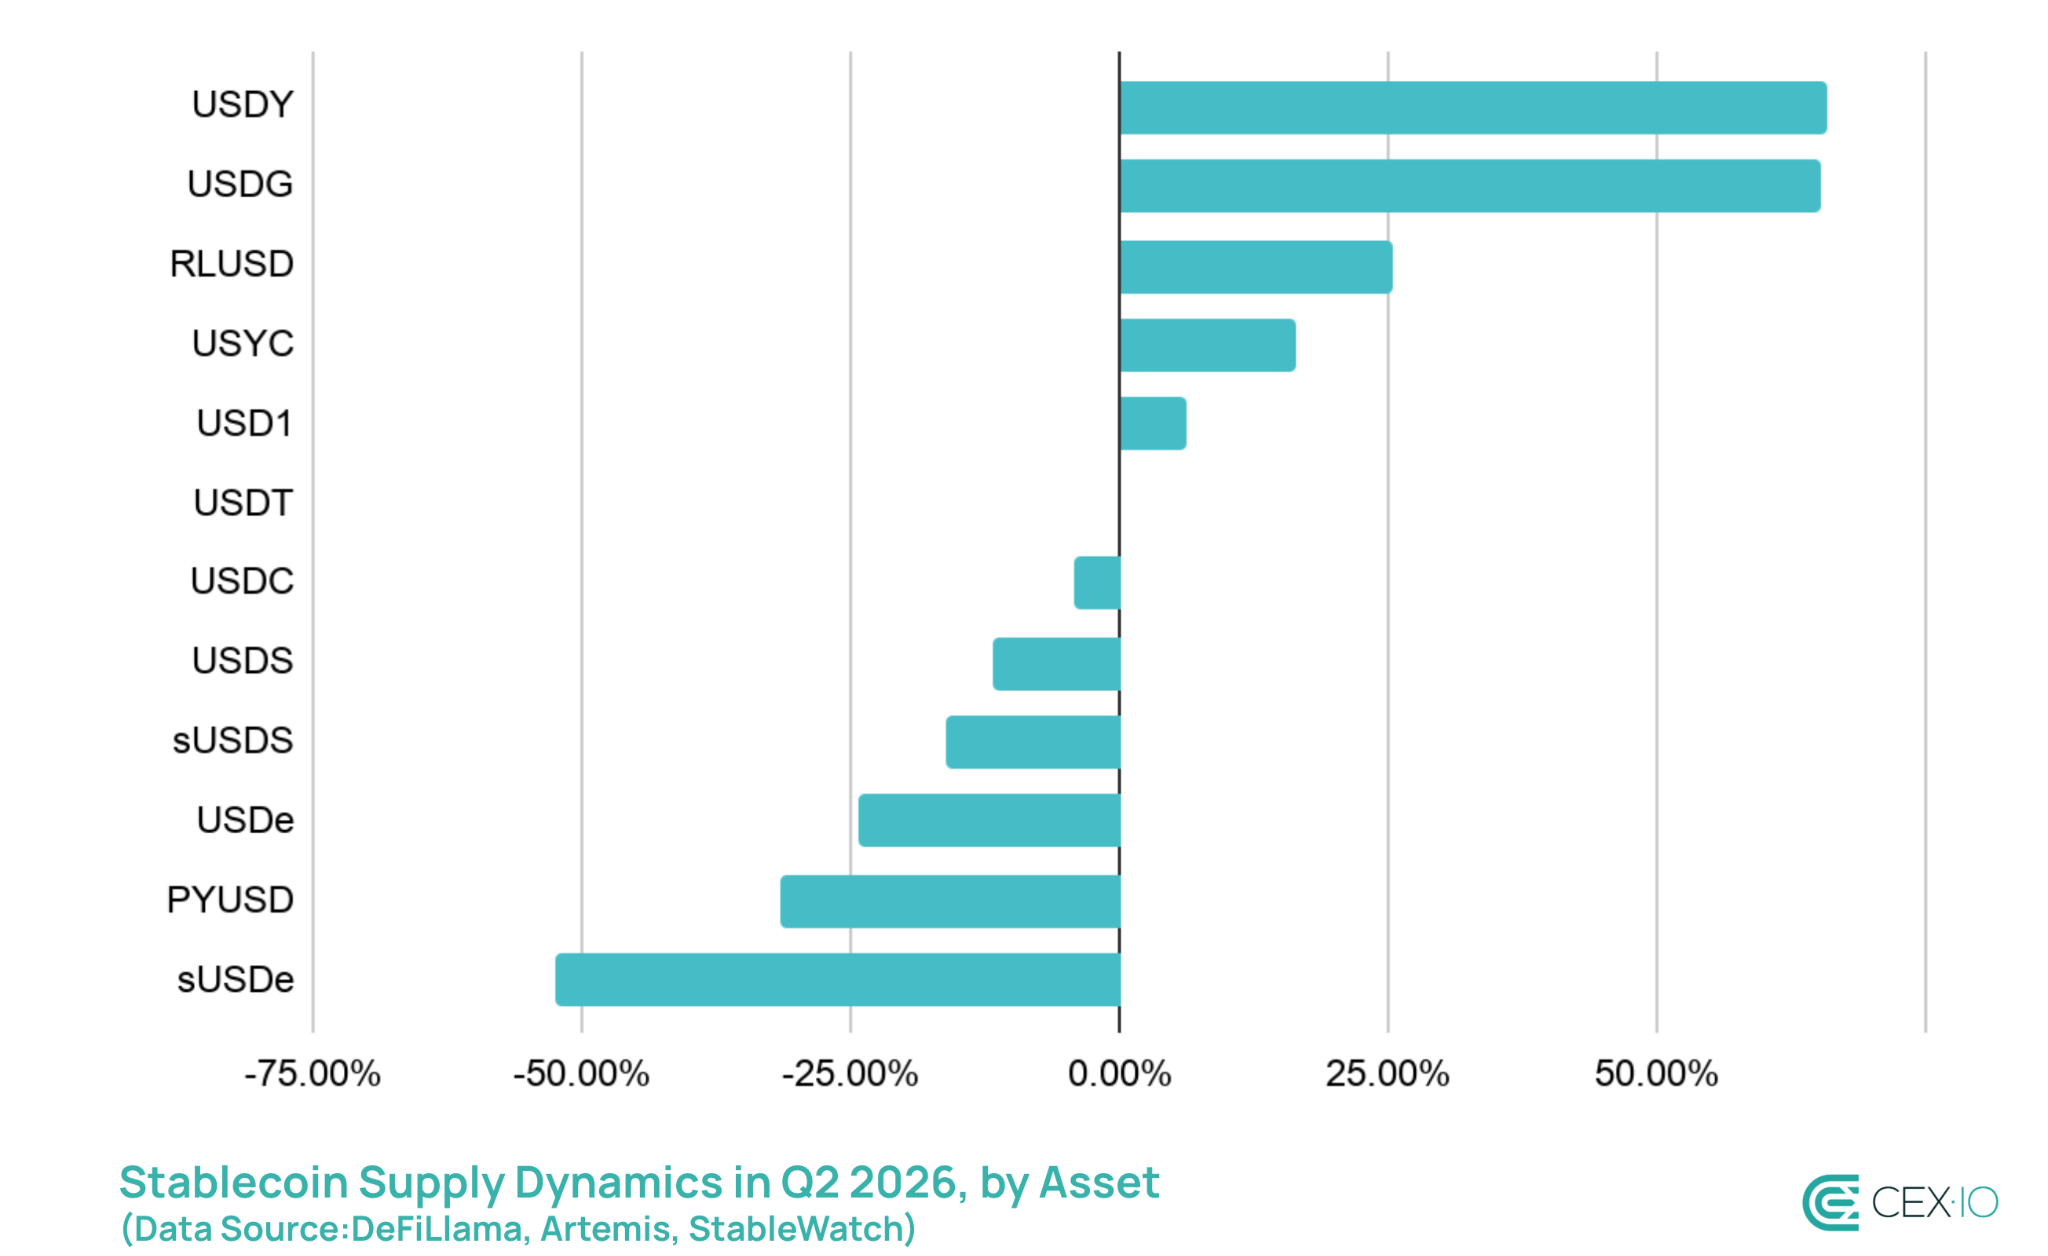
But the decline wasn’t evenly spread, and was almost entirely concentrated in a DeFi-native story. Ethena’s sUSDe lost more than half its market cap, falling 52% and losing nearly $2 billion in supply, while Sky’s sUSDS declined by 16%. Both assets become major drivers of the entire category contraction.
At the same time, treasury-backed yield products kept growing. BlackRock’s BUIDL added 2%, USYC climbed nearly 16%, and USDY jumped over 66%. It highlights a market shift from crypto-collateralized synthetic yield to more RWA-related yield, which lines up with the broader flight to safety in crypto.
Among non-yield-bearing stablecoins, the most notable shift was the reversal between USDT and USDC. The two effectively swapped places from Q1: USDT supply grew by $0.5 billion, while USDC supply fell $3.2 billion.
Stablecoin Supply on Ethereum L2s Sees Its Steepest Drop Since 2022
Stablecoin supply on Ethereum Layer-2 networks fell 24% ($4.34 billion) in Q2 2026 — the largest quarterly drop since Q4 2022.
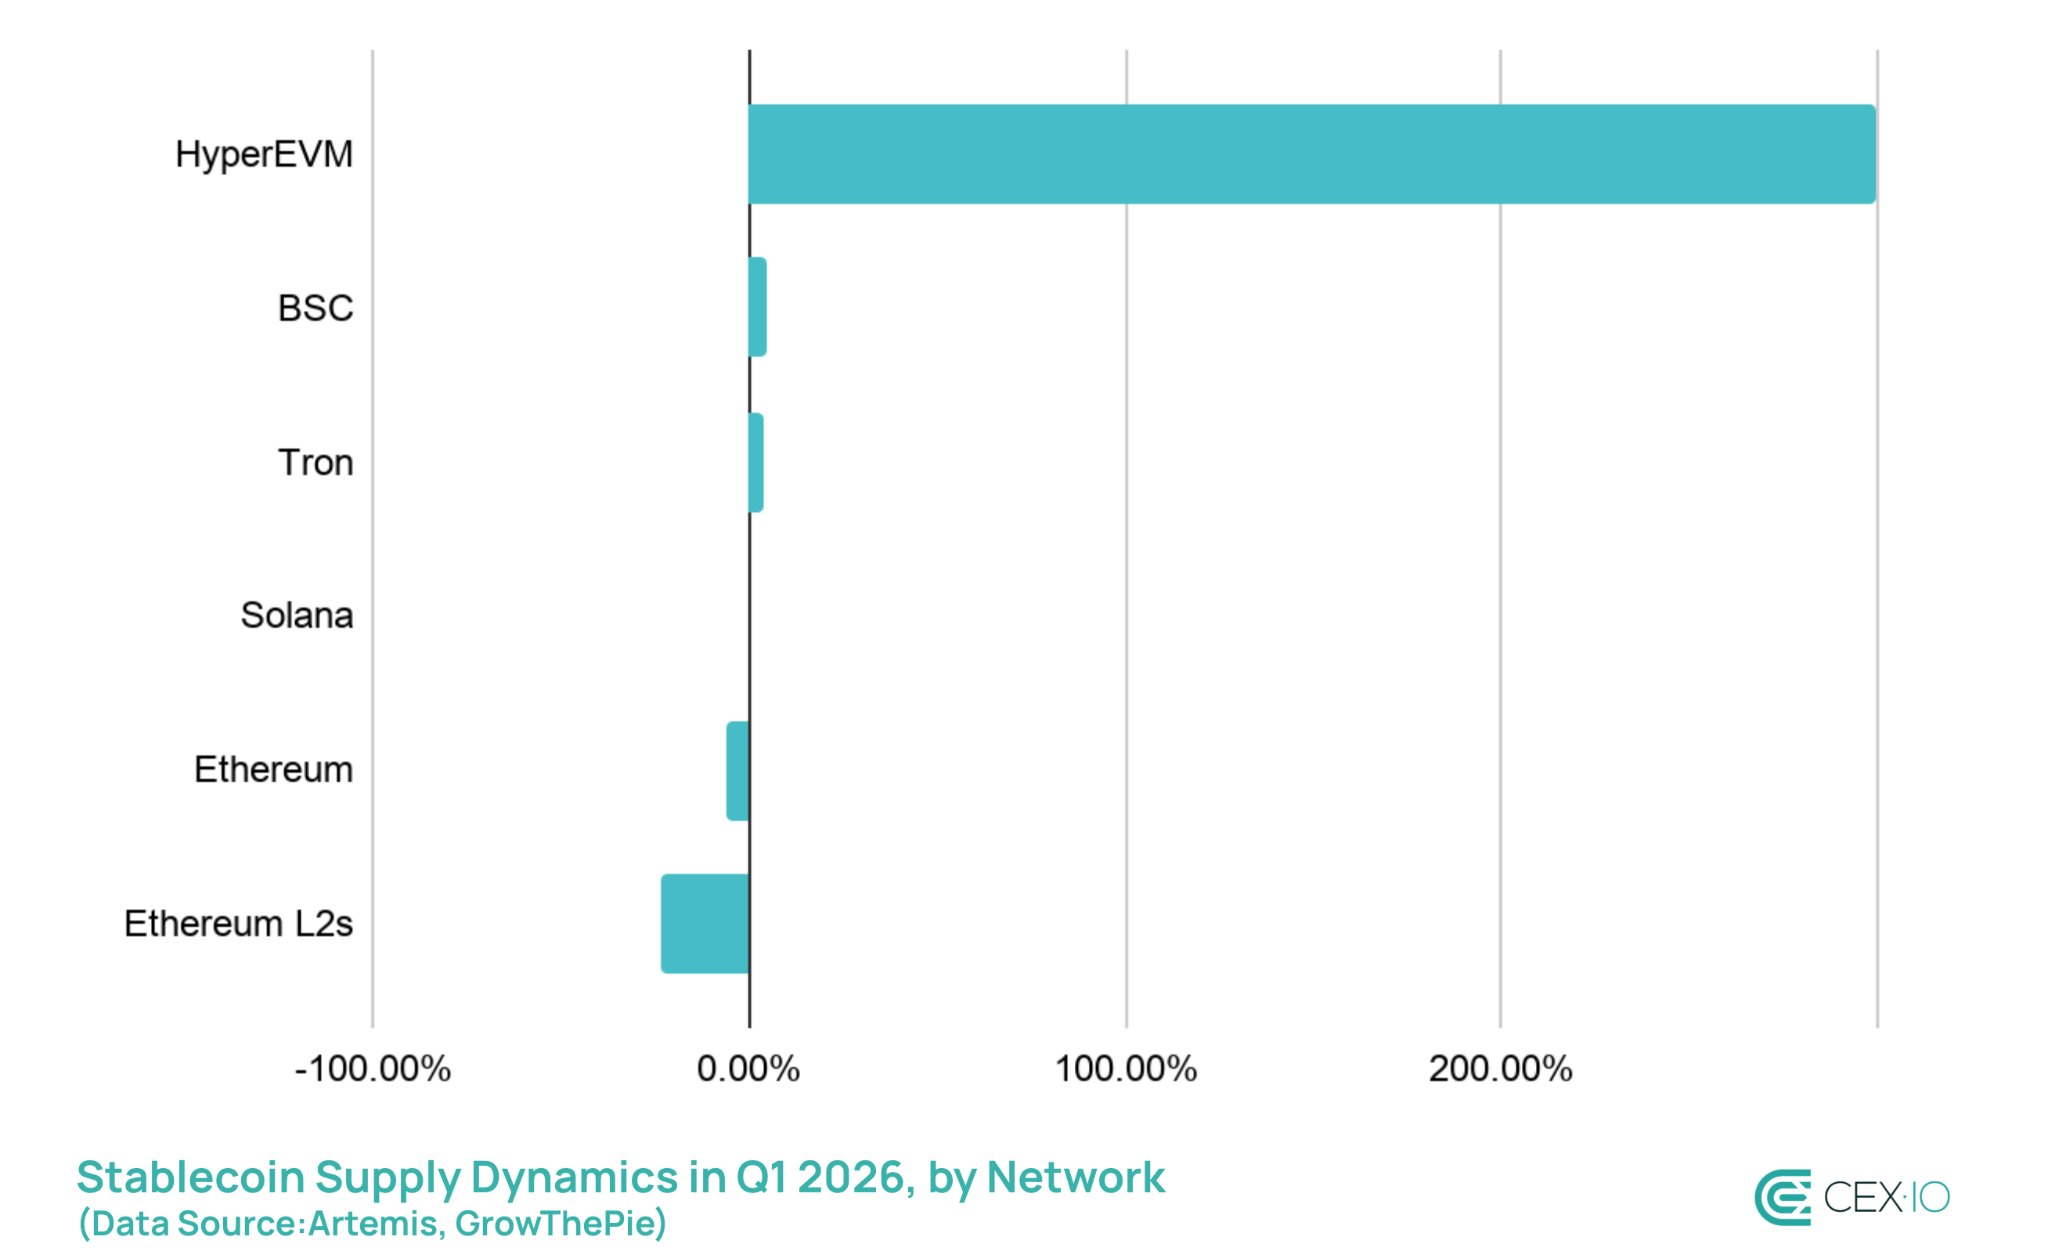
Almost all of it traces back to one network: Arbitrum, which lost 45% of its stablecoin supply ($3.5 billion). Arbitrum had built up that supply largely as the main on-ramp to Hyperliquid; but as HyperEVM adoption matured, that role faded fast. HyperEVM’s own stablecoin supply grew 300% in the same window, to $5.6 billion — almost a mirror image of Arbitrum’s loss.
In absolute terms, Ethereum’s base layer showed the worst performance in Q2 2026, losing more than $10 billion in stablecoin supply, the largest drop since Q1 2023. In turn, Tron and BNB Chain added $3.4 billion and $0.7 billion in stablecoin supply respectively, and this increase was largely driven by rising payment activity.
Trading Volume Dynamics
USDC’s Share of Trading Volume Hits an All-Time High
Total stablecoin trading volume fell by 18% in Q2, reaching $6.8 trillion. The drop was primarily fueled by an overall decline in crypto trading activity and USDT volume, which plummeted by 24% compared to Q1.
USDC, however, moved in the opposite direction. Its trading volume rose by 34%, making it the only major stablecoin to post absolute volume growth during the quarter. That divergence pushed USDC’s share of total crypto trading volume to 12.5% in Q2 2026, a new all-time high that surpassed the previous record of 11% set in Q4 2023.
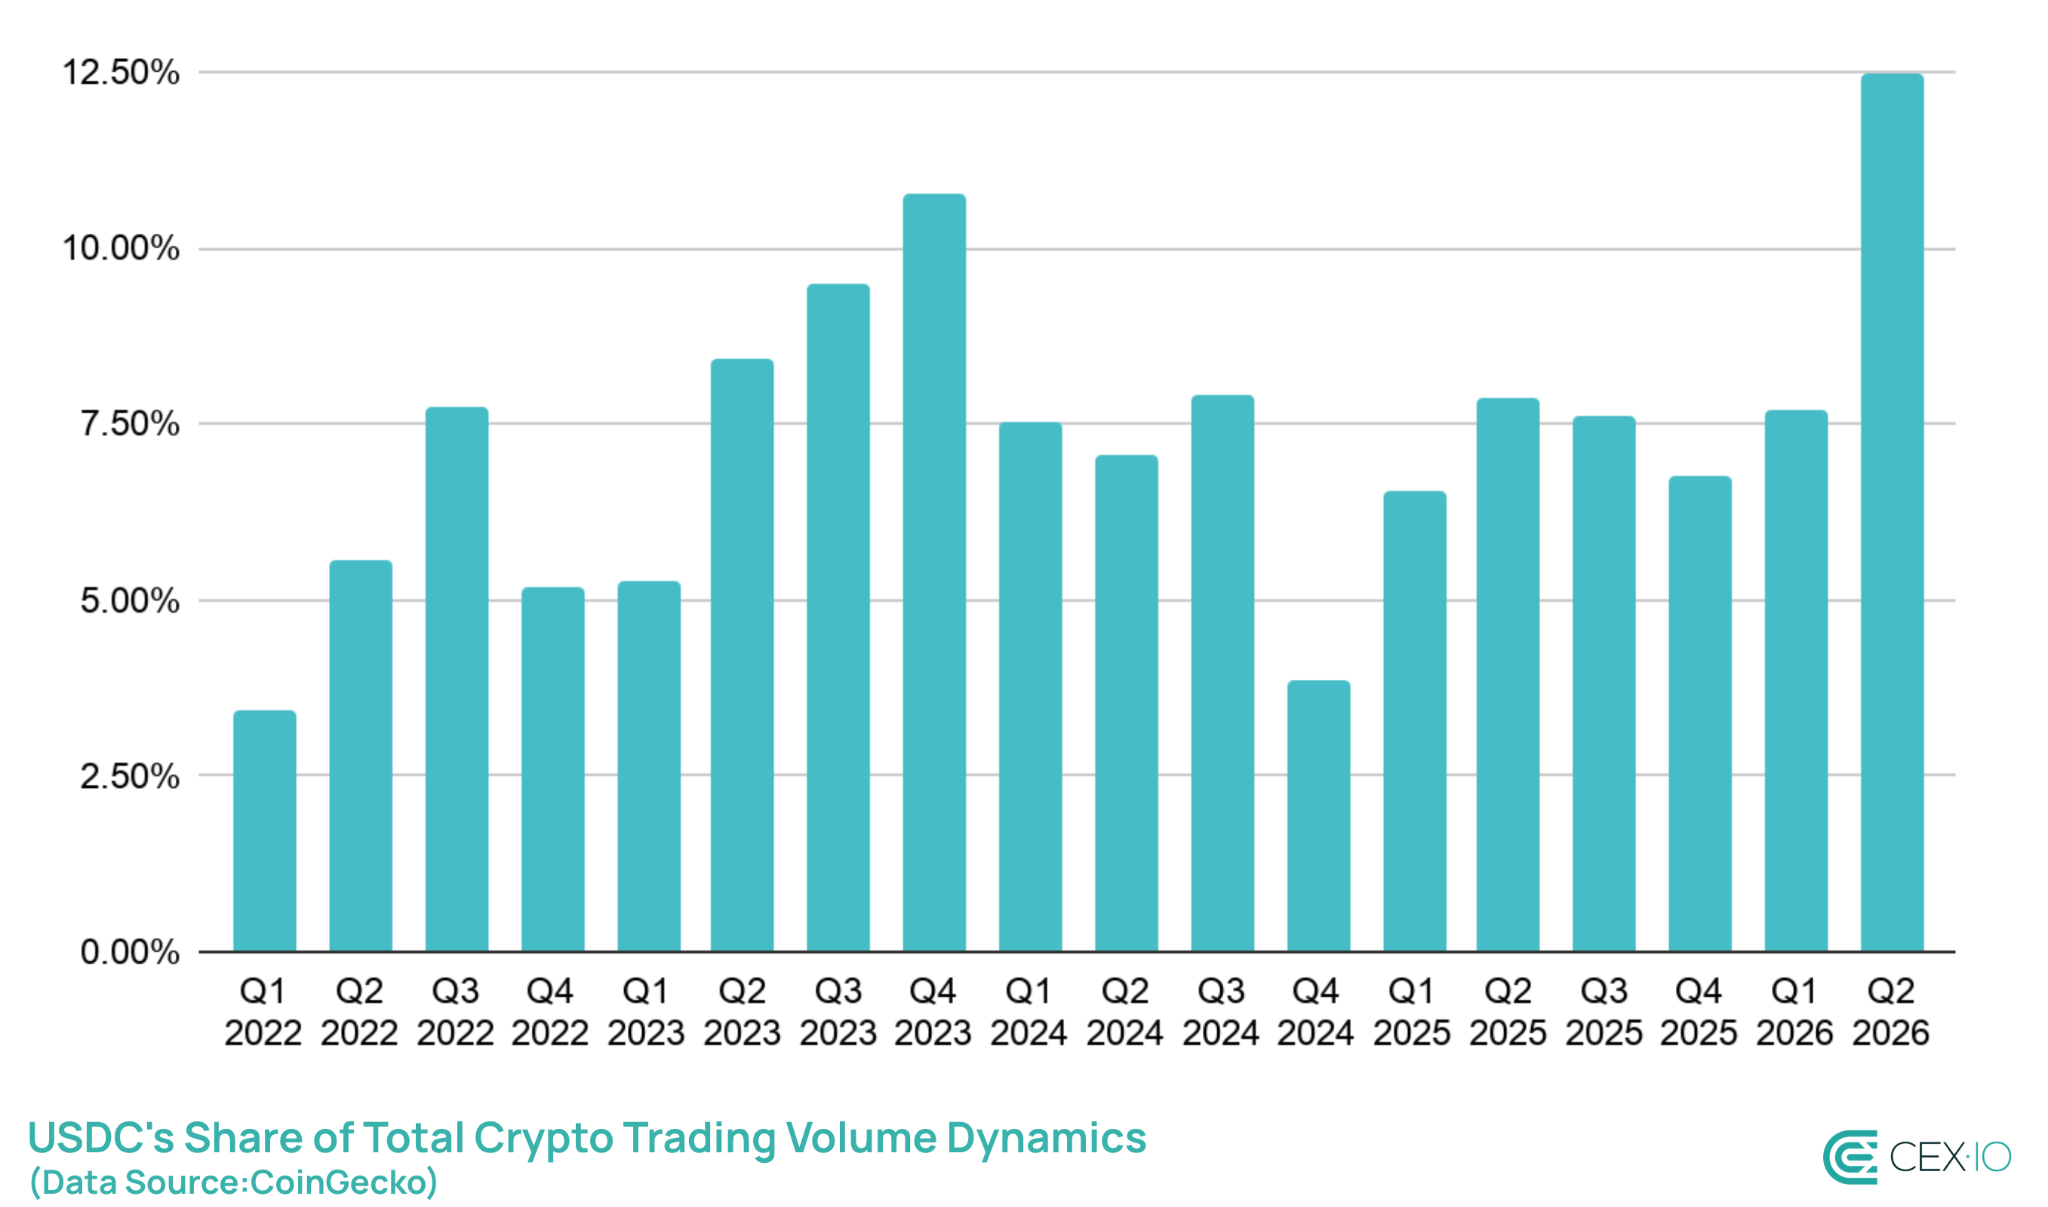
One of the major drivers behind this growth is rising USDC adoption among CEXs, which could be partly traced back to Europe. Tether still hasn’t secured authorization to operate under MiCA, and major exchanges have been progressively removing USDT pairs from their European venues, and replacing them with USDC.
CEX.IO’s internal data supports this trend. Across all stablecoin-related financial operations on the platform, USDC’s share rose from 58% to 60% quarter-over-quarter, and up sharply from just 27% a year earlier in Q1 2025.

Transaction Activity Dynamics
Transaction Counts Post Their Sharpest Drop on Record
The clearest signal of a genuine slowdown shows up in transaction counts. Total stablecoin transactions fell to 4.48 billion in Q2 2026, down 530 million from Q1 — the largest absolute quarterly drop ever. In relative terms, the 11% decline is the steepest since Q4 2022.
The similar pattern holds after stripping out bot, automated, and non-economic activity. Adjusted (organic) transaction counts fell to 613 million, down near 11 million. However, this is a smaller drop than in the previous quarter, suggesting that the Q2 2026 contraction was primarily driven by bot and infrastructure-related transactions.
This pattern closely mirrors the previous bear market in 2022, when declining transaction counts signaled a broader cooling in crypto activity. However, it’s important to keep in mind that transaction count is historically among the first to recover during prolonged stablecoin contractions. Hence, if coming quarters show improvements in adjusted transaction count, this might also signal that the sector might be coming closer to broader recovery.
Organic Transaction Volume Breaks a Ten-Quarter Growth Streak
The transaction volume tells the same story as the count data. Adjusted transaction volume fell to $4.09 trillion in Q2 2026, down 5.5%. This the first quarterly decline since Q3 2023, breaking a run of ten consecutive quarterly increases that included a 18.3% gain just last quarter.
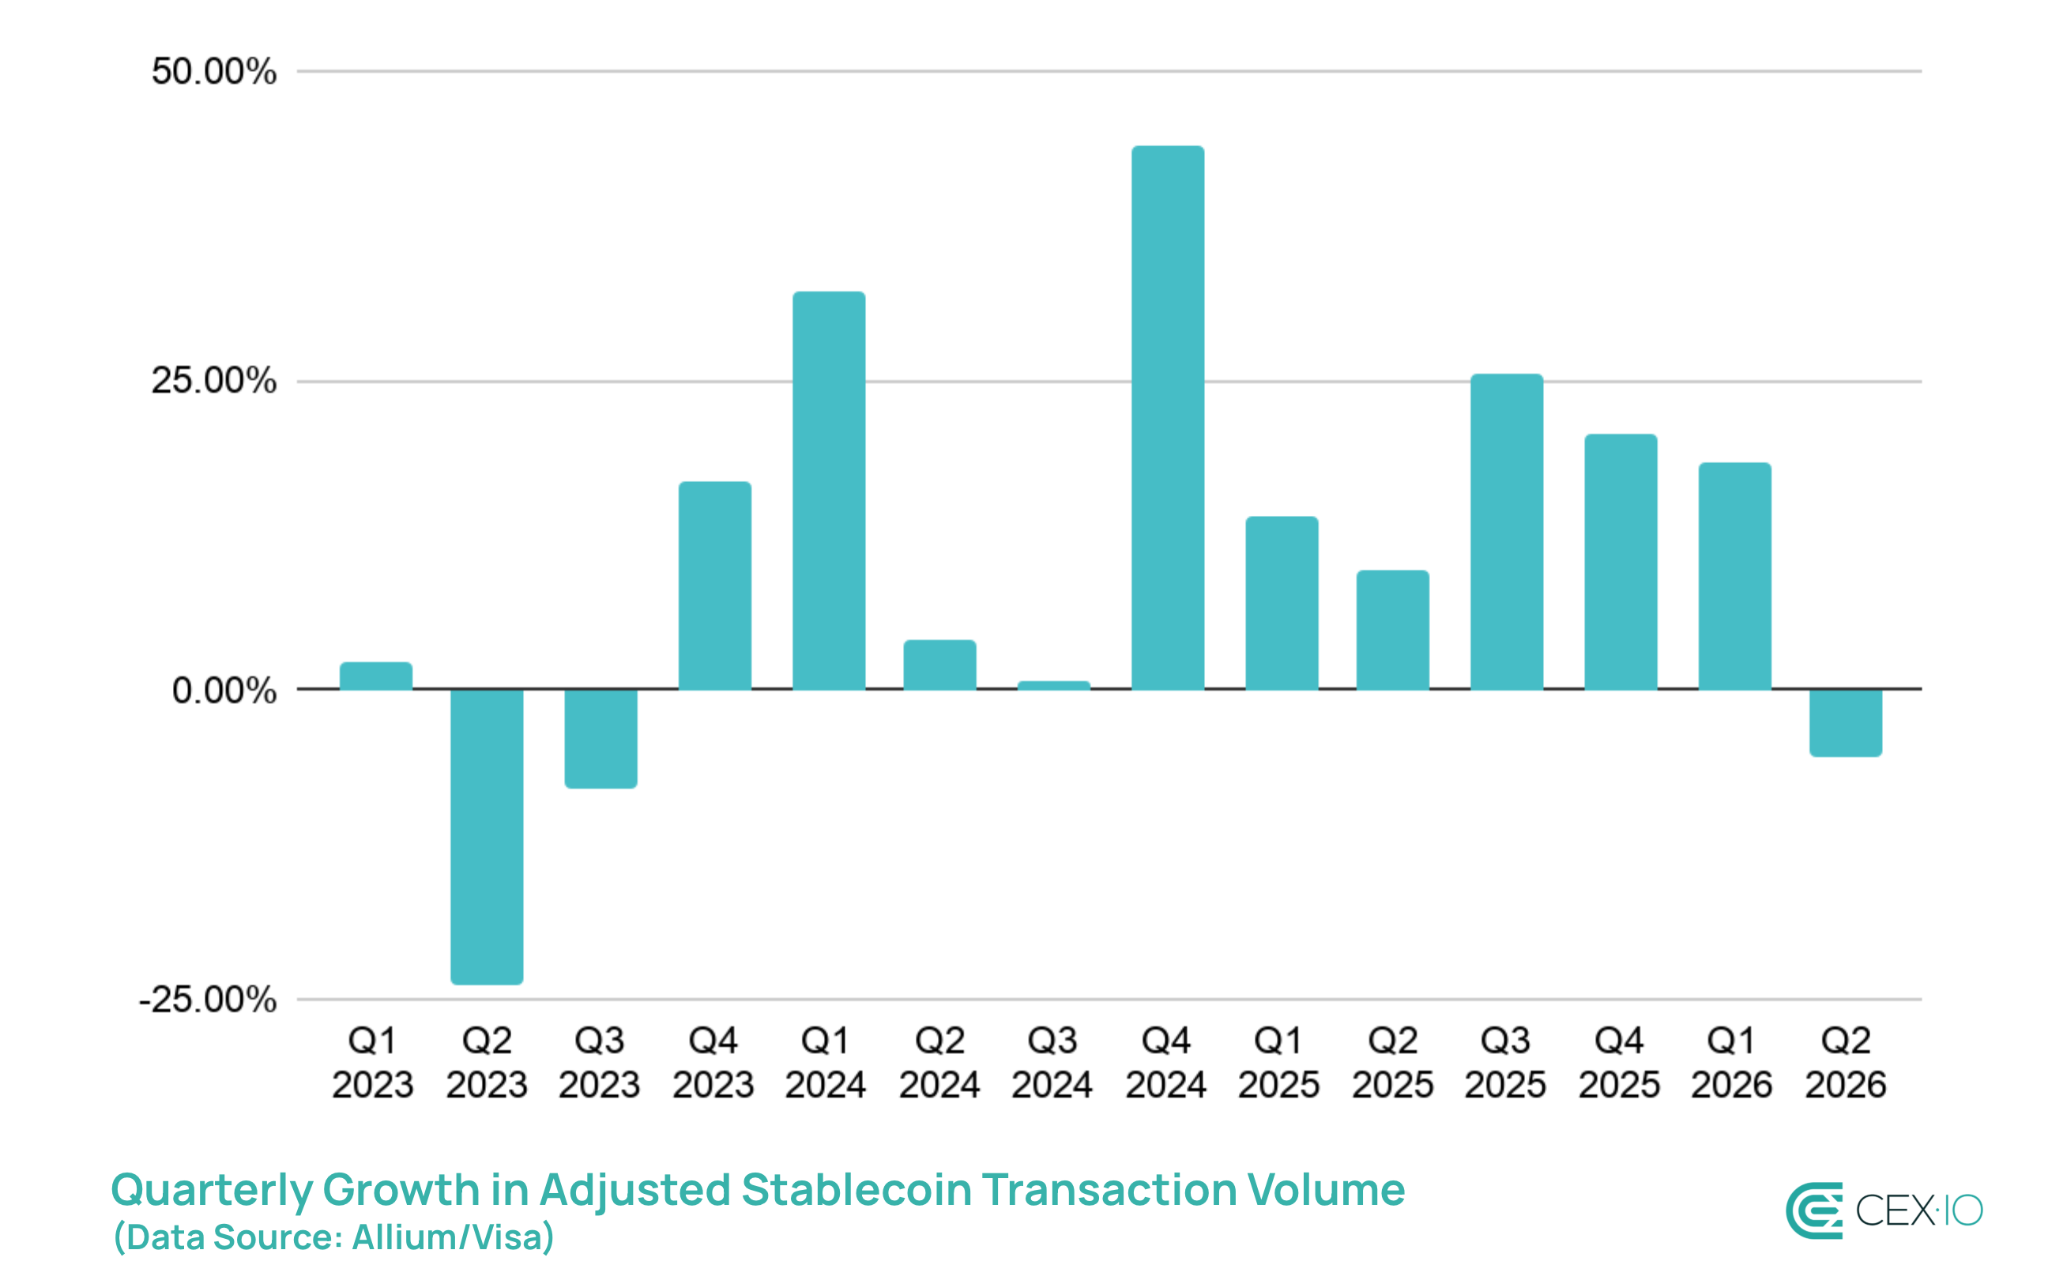
Seeing both the count and volume of organic activity decline together after such a long growth streak, makes this look like a real slowdown in stablecoin usage.
However, transfers under $250 actually registered a slight increase, edging up by 5%, to $19.39 billion. That points to the pullback being concentrated in larger, more infrastructure- and bot-driven flows rather than ordinary peer-to-peer usage.
What Could Come Next
Q3 brings a wave of stablecoin regulation, and MiCA’s full enforcement leads the pack. This might keep weighing on USDT specifically — its exchange reserves and trading footprint already showed cracks this quarter. USDT’s rotation toward DEX activity, which recently overtook USDC’s there, could keep building as compliant centralized venues lean further into USDC. Those trends are already in place, and they may see further expansion with regulatory force.
In the U.S., the stablecoin picture could get clearer. The GENIUS Act’s final rules are due by mid-July, and the CLARITY Act is now on the Senate’s legislative calendar. If both land, more traditional finance players could feel less pressure to experiment with stablecoins and build on rather than keep watching from the sidelines.
The bigger unknown is supply. Previous major stablecoin contraction, in 2022-2023, took about a year to fully resolve and transition to broader expansion. But this time it may not follow the same script. Crypto trading now looks more dependent on stablecoins than stablecoins are on crypto trading, and the asset class itself has gotten more varied. TradFi-adopted payment rails and RWA-backed yield kept growing this quarter even as DeFi-native yield and Layer-2 activity shrank. If that split holds, meaning newer, less cyclical use cases expanding while the more crypto-native ones fade, stablecoin supply could recover faster than it did last cycle.
Sources
The data used for this research consists of publicly available information from DeFiLlama, Visa/Allium, Artemis, CoinGecko, StableWatch, Blockworks Research, CryptoQuant, and GrowThePie, supplemented with CEX.IO’s internal trading data. Organic activity is measured as adjusted volume using the Adjusted Transaction Methodology. Retail-sized transactions are defined as adjusted (non-bot) transactions under $250, per the same methodology. The observation period for this study covers Q2 2026, with data points ending June 30, 2026.
The web content provided by CEX.IO is for educational purposes only. The information and tools provided neither are, nor should be construed as, an offer, or a solicitation of an offer, or a recommendation, to buy, sell or hold any digital asset or to open a particular account or engage in any specific investment strategy. Digital asset markets are highly volatile and can lead to loss of funds.
The availability of the products, features, and services on the CEX.IO platform is subject to jurisdictional limitations. To understand what products and services are available in your region, please see our list of supported countries and territories. This page includes additional links to information about individual products, and their accessibility.