
This weekly piece of cryptocurrency price analysis and thought leadership is brought to you by the expert team at CEX.IO, your crypto guide since 2013. At CEX.IO, we’re committed to providing the latest industry developments and potential price scenarios to help our users make the most informed decisions along their crypto journeys.
In this week’s update, we look at whether or not Bitcoin approached its potential bottom for this cycle.
Additionally, the article includes the recent price movements of Chiliz (CHZ), XDC Network (XDC), and BNB (BNB), as well as notable events for the last week.
Read along for in-depth breakdowns, and enjoy reviews of correlated markets.
Looking for Bitcoin’s bottom
After the FTX collapse, the Bitcoin price updated its local minimum by reaching the $15,479 level. This fueled discussion in the community about whether or not it could be bitcoin’s bottom for this cycle.
As Bitcoin historical data shows, the asset typically experiences a deep correction period of 1-2 years. Bitcoin reached its all-time high at $68,789 in November 2021, meaning that the bearish market could potentially approach its end.
Furthermore, Bitcoin has also recently completed 65% of the duration until the next halving, which will take place at block 840,000, or somewhere in the first half of 2024. In all previous cycles, the bottom was reached by the time 65% of the period between two halvings was passed.
The $15,479 level indicates a 77% drop from the all-time high in this cycle. This corresponds with the idea that Bitcoin price shows lower drops with consecutive cycles, due to increased liquidity. For instance, Bitcoin dropped by 92% in 2012, 86% in 2014, and 83% in 2018. Given this history, the potential bottom of this cycle could be in the 77-83% range, or between $11,500 and $15,800.
However, the ascending support line (green line) that has been in place since December 2018 indicates that the next potential target could be around $12,000 (yellow line). This level acted as a major resistance in a previous cycle.

At the same time, the weekly RSI generated a strong bullish divergence (blue lines). But in order to confirm bullish potential, RSI has to break its descending resistance line (orange line).
Still, a doom narrative continues to dominate the market, inspiring people to look for potential victims of the so-called FTX contagion. For more than a month, Digital Currency Group (DCG) which owns Genesis Capital Group and Grayscale Bitcoin Trust has been widely viewed as the next potential black swan.
Recently, Bitvavo, a European crypto exchange, claimed that DCG is “experiencing liquidity problems due to the current turbulence in the crypto market.” The platform clarified it has 280 million Euro stuck with DCG and stated that DCG “has suspended repayments until this liquidity issue has been resolved.” If DCG or its affiliates confirm the liquidity issue, it could strengthen the bearish narrative and push the price to retest the last low near $15,500 (red line).

For now, the Bitcoin price is trading on the daily chart below major moving averages, meaning that the path of least resistance is down.
The Fed’s message on maintaining raising rates in 2023 to fight inflation is considered a major driver of Bitcoin’s recent drop from $18,200. But if bullish divergence on the weekly chart materializes, then the next target for the bulls could be $18,700 (orange line), where the descending resistance line (green line) could be reached. Its breakout may push the price upwards to $20,000.
FIFA World Cup didn’t help Chiliz
Chiliz was widely anticipated to benefit significantly from the FIFA World Cup, as a sponsor of the event, and as a home for various fan tokens. However, when the event started, the CHZ price experienced a sell-off, and a downward movement prevailed throughout the games.
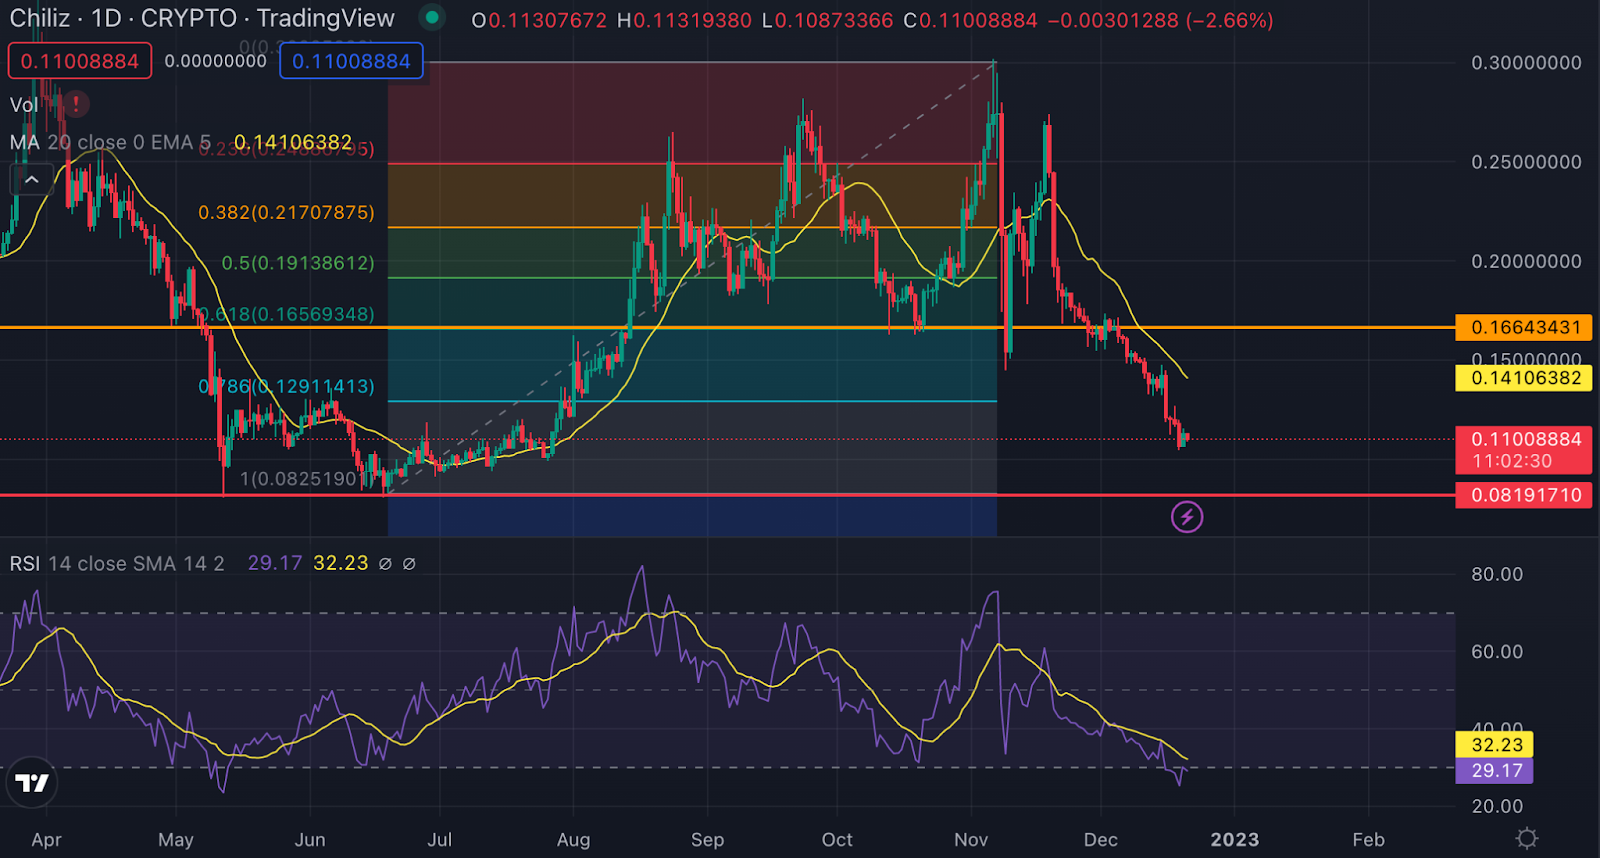
A failed attempt to retest the 0.618 Fibonacci level (orange line) increased bearish pressure, pushing the CHZ price to the support area near $0.1. The next target for the bears could be the level where the CHZ rally has begun — $0.0825.
Although a long-term outlook is rather bearish, a four-hour chart hints at a potential short-term rebound.

RSI formed a strong bullish divergence (blue lines) which could move the price to the descending resistance line (orange line).
XDC Network reached major resistance
XDC Network has become one of the top performers over the last week with a price increase of over 20%. Shortly before the rally, STATIS deployed its EURS stablecoin on XDC Network. It is the first Euro-backed stablecoin on the XDC Network, and, with this integration, both projects aim to “boost Web3 payments,” according to the announcement.
As a result of the rally, the XDC price managed to break a crucial level of $0.025 (orange line), and moved upwards to the descending resistance line (blue line). In the case of a breakout of this line, the next target for the bulls could be located in the $0.031-$0.033 zone (green channel).

However, Stochastic indicates that the asset is already in the overbought zone, which limits bullish potential. If the price fails to sustain above the resistance line, it could increase the chance for the price to return to the $0.025 level.
A withdrawal wave on Binance affected BNB
In early December, Binance released a report by auditing firm Mazars claiming that its Bitcoin reserves are overcollateralized. However, various outlets flayed the document for its narrow scope. Due to concerns about Binance’s proof of reserves, the platform endured a record wave of withdrawals.
Cryptocurrencies related to Binance, including BNB and TWT, have seen a price drop of over 20% amid this “stress testing.” In addition, BUSD lost $3 billion of capitalization in a few days. At the same time, the BNB price experienced a death cross on the four-hour chart, which is considered a bearish signal.

The downward movement led the price to a low of $220 (red line) and caused a breakdown from the $250 horizontal support area (green line). However, recent news about the acquisitions of Indonesia exchange Tokocrypto, and the assets of Voyager Digital, could be the reason for the rapid rebound back to $250.
Notable market events
Ren Protocol warned of a $15M asset loss risk due to potential shutdown
The Ren Protocol developers warned that the project may be shut down in short order. Furthermore, there remains $15 million of value in the protocol that’s at risk of getting stuck when and if the network stops. The team clarified that it doesn’t know exactly when it will happen. It could be days or weeks. The driver is that the now-collapsed trading firm Alameda Research acquired the project in February 2021 and controls part of the infrastructure.
The network supports tokens wrapped from other blockchains. The Ren Protocol developers asked users to send wrapped tokens back to their respective chains to unlock this collateral before the network suddenly shuts down.
Tezos activated the Lima update
Tezos has activated the 12th iteration of the protocol called Lima. The update helped increase network bandwidth, introduced a new option for validators (consensus keys), and reduced the risk of bugs in smart contracts.
A new feature is called consensus keys, and it allows bakers (validators) to designate a special key for signing blocks and consensus operations. Consensus keys prevent backers from losing delegators due to a change in setup, or the need to coordinate with delegators off-chain to move them to a new address.
Apart from improvement in Layer 1, the Lima upgrade also finalized the development work towards Smart Rollups. This Layer 2 scaling solution is expected to debut in the subsequent Tezos upgrade proposal. A public test of Smart Rollups is scheduled for early 2023.
FIL and STORJ experienced record liquidations on long positions
FIL and STORJ prices were hit by record liquidations on long positions, as more traders may be questioning the utility of storage protocols. According to CoinGlass, nearly $5.7 million long FIL positions were liquidated on December 16, while $365,000 in STORJ long positions were liquidated the same day. Open Interest data from CoinAlyze suggests that both assets may experience other potential waves of long liquidations, due to increased interest in short positions and negative funding rates.
Waves prepares a revival plan for USDN and could launch another stablecoin
Neutrino USD (USDN), the algorithmic stablecoin of the Waves ecosystem, lost its peg after South Korea’s Digital Asset Exchange Association labeled Waves as an “Investment Warning” asset. It caused the USDN price to drop below $0.53. Sasha Ivanov, the founder of Waves, said on Twitter he will unveil another stablecoin after providing a plan to stabilize USDN. The Waves community and other crypto enthusiasts criticized the idea in the comments, and compared Waves and its USDN with Terra and collapsed UST stablecoin.
Tune in next week, and every week, for the latest CEX.IO crypto highlights. For more information, head over to the Exchange to check current prices, or stop by CEX.IO University to continue expanding your crypto knowledge.
Disclaimer: Not investment advice. Seek professional advice. Digital assets involve risk. Do your own research.