
Following the Fed’s raising interest rates by 50 basis points, markets have become convinced that rate hikes will continue for the foreseeable future. This has expedited exits from riskier assets such as stocks and cryptocurrencies. Even gold and silver, the so-called “safe havens” have been negatively affected since the interest rate hike on May 4.
The Fed also declared that asset tapering will resume at an expedited rate which gave a boost to the dollar index, DXY, and increased the downside pressure on asset prices including cryptocurrencies. Bitcoin has fallen from $40,000 to $26,000 since May 4 and lost its major bull market support at $30,000. Other cryptocurrencies experienced much higher drops in their USD values.
Although external factors have become adverse, ongoing events and developments in the crypto space are taking a significant toll on digital asset prices as well. The de-pegging of TerraUSD (UST) and the accompanying collapse of the Terra (LUNA) ecosystem have created pandemonium in the market and there is increasing fear and uncertainty about all stablecoin products across the board.
This has triggered an escape from stablecoins to Bitcoin and fiat currencies. Altcoin investors also became fearful of the developments in the market and realized a huge sell-off, which wiped out more than 20% of the total market capitalization between May 9 and 11.
In this issue of the crypto ecosystem update, we will discuss what happened with UST and Terra (LUNA). We will also provide a detailed technical analysis for Bitcoin as its next major move will likely dictate the direction of the entire crypto ecosystem.
What Happened To Luna and UST?
Terra’s (LUNA) algorithmic stablecoin, UST, lost its peg to the US Dollar on May 8 soon after Bitcoin started to crash. This was because UST was backed by Bitcoin reserves worth $1.6 billion. When the value of the reserves started to drop rapidly, UST holders started to panic and rushed to sell their tokens to other stablecoin products.
An unknown user on Binance sold $84 million of UST to other stablecoins. According to reports, the same wallet sold similarly large amounts on decentralized platforms like Curve and Anchor (a total of 285 million UST on May 8) which eventually broke UST’s peg against the US Dollar.
How does UST work?
By the nature of its design, the price of UST is algorithmically backed by Luna tokens. According to the protocol, Luna holders have the right to mint 1 UST for every $1 worth of Luna they hold. When UST is minted, an equivalent amount of Luna tokens is burnt and taken out of circulation.
Similarly, UST holders have the right to mint 1 Luna token for every $1 worth of UST they hold.
The purpose of the protocol is to create an equilibrium price of $1 per UST token. When the price of UST drops below $1 due to a supply increase, traders or arbitrageurs can buy the cheaper UST tokens to mint LUNA, which would deflate the total supply of UST and push its price back to $1.
The incentive of doing this is that UST holders will eventually have a more valuable UST in their hands if they initially burn their tokens and then swap the minted Luna tokens back with a more valuable UST ($1 per token if the peg is achieved).
Likewise, when the price of UST rises above $1, Luna holders will burn their tokens to reduce the value of UST so that they can swap back to Luna at a cheaper UST price.
What collapsed UST and Luna?
Starting on May 4, following the Fed rate hike announcement, there was a rush to sell Bitcoin and switch to stablecoins, including UST. This removed a lot of market liquidity from UST. However, since UST was backed with BTC reserves, UST holders soon started to sell their tokens to other stablecoin products fearing the drop in the value of UST’s BTC reserves. There was soon no interest left among arbitrageurs to preserve the value of UST.
To counter the rising UST supply in circulation, The Luna Foundation Guard (LFG), a non-profit organization that backs the Terra blockchain ecosystem, started to buy UST by selling the BTC reserves. Despite selling more and more BTC, along with other reserve assets, the peg failed to maintain. The market was already flooded with UST and arbitrage traders could not come to the rescue either because they were swamped with more UST than they could buy.
This resulted in panic sales from LUNA investors, and a rush from arbitrage traders to swap their plummeting UST for the LUNA token, which they also sold in turn.
To preserve the value of UST, the Terra Labs management chose the path of hyperinflating the Luna supply. The original total supply of 1 billion rose to 6 billion on May 10, more than 50 billion on May 11, and over 6 trillion by May 13.
However, none of this Luna printing could save the value of UST which fell to as low as 10 cents per token on May 13 when the Terra blockchain was finally halted. The price of the Luna token collapsed from $60 to less than one cent within a few days and exchanges have simultaneously stopped both Luna’s and UST’s trading activities.
The below chart displays the massive spike in Luna’s circulating supply which was minted in a matter of three days.
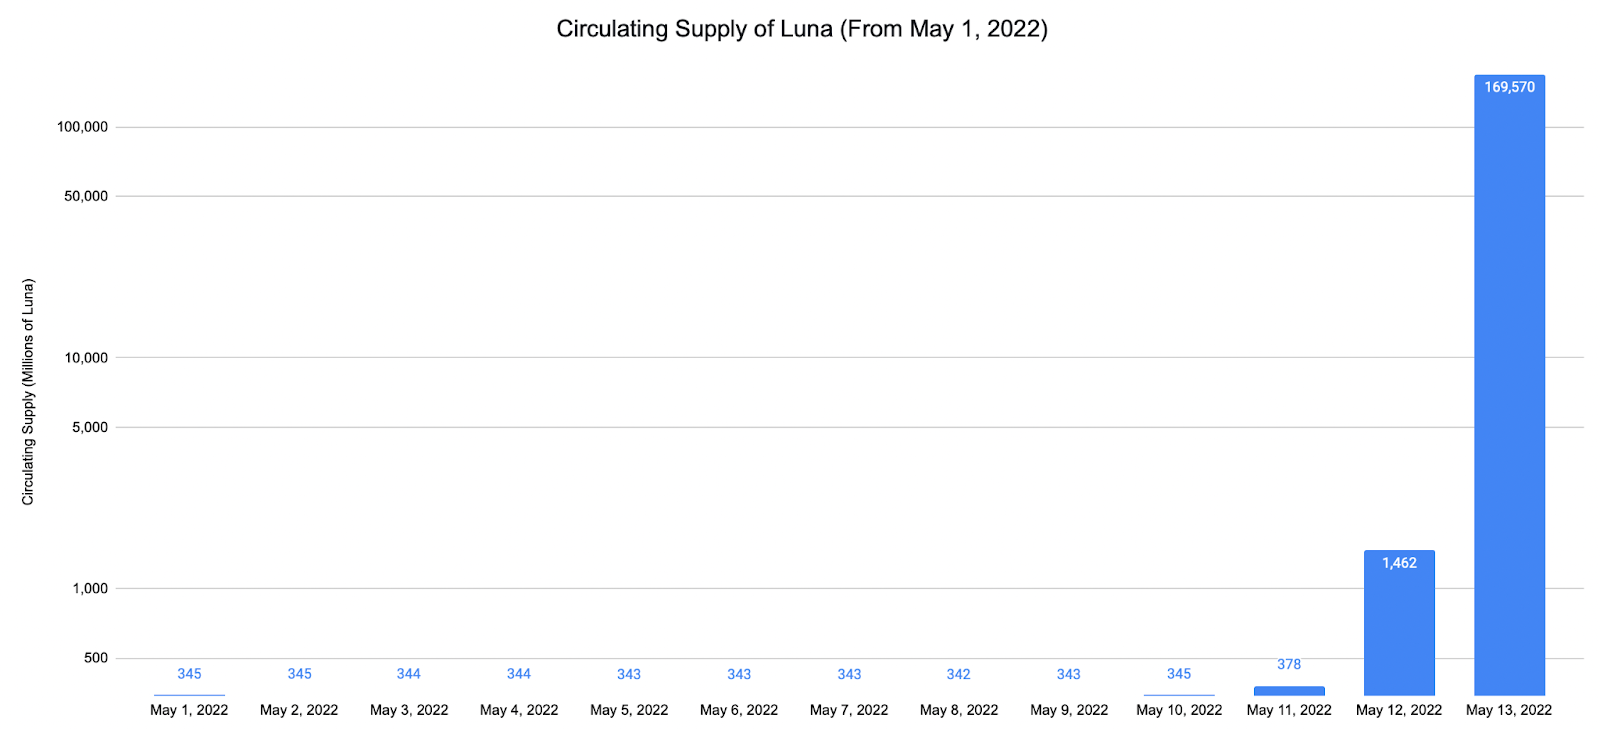
Source: Messari
Luna token minting finally came to a halt later on Friday, May 13 and the Terra blockchain was reactivated following Chanpeng Zhao’s supportive tweets about how the Terra ecosystem could be rescued. The price of Luna recovered slightly during the May 14-15 weekend with a 10-15x increase (a relatively mild increase considering the 99.99% price drop in a few days) and the price volatility has diminished significantly since then.
As of now, the Luna price is consolidating within a range, waiting for new developments that could influence the future of this former top-five cryptocurrency project.
Bitcoin Price Analysis
Bitcoin price has been falling since May 4 along with major fiat currencies and stocks. Money has been flowing to the US Dollar in anticipation of interest rate hikes throughout 2022 and 2023.
The US Dollar currency index, DXY, which shows the relative value of the US Dollar against a basket of major fiat currencies (the Euro, Japanese Yen, British Pound, Canadian Dollar, Swiss Franc, and Swedish Krona) has been on an uptrend since May 2021, the month that Bitcoin made its 2021 bull run top. This makes sense as Bitcoin is considered a hedge against the US Dollar.
You will find below the factors that may determine the next major move in Bitcoin over the next few weeks.
- DXY about to break out of its long-term channel
As you can see in the below chart, DXY made a triple bottom in May 2021 following its 2018 and January 2021 bottoms. The ongoing uptrend has accelerated since March 30, 2022, which is only two days later than Bitcoin made its local top at $48,000 per coin.
DXY has surged to the top of the channel that it has been following since 2015 and it may break the channel to the upside if new developments in the next coming weeks further increase recession fears for investors.
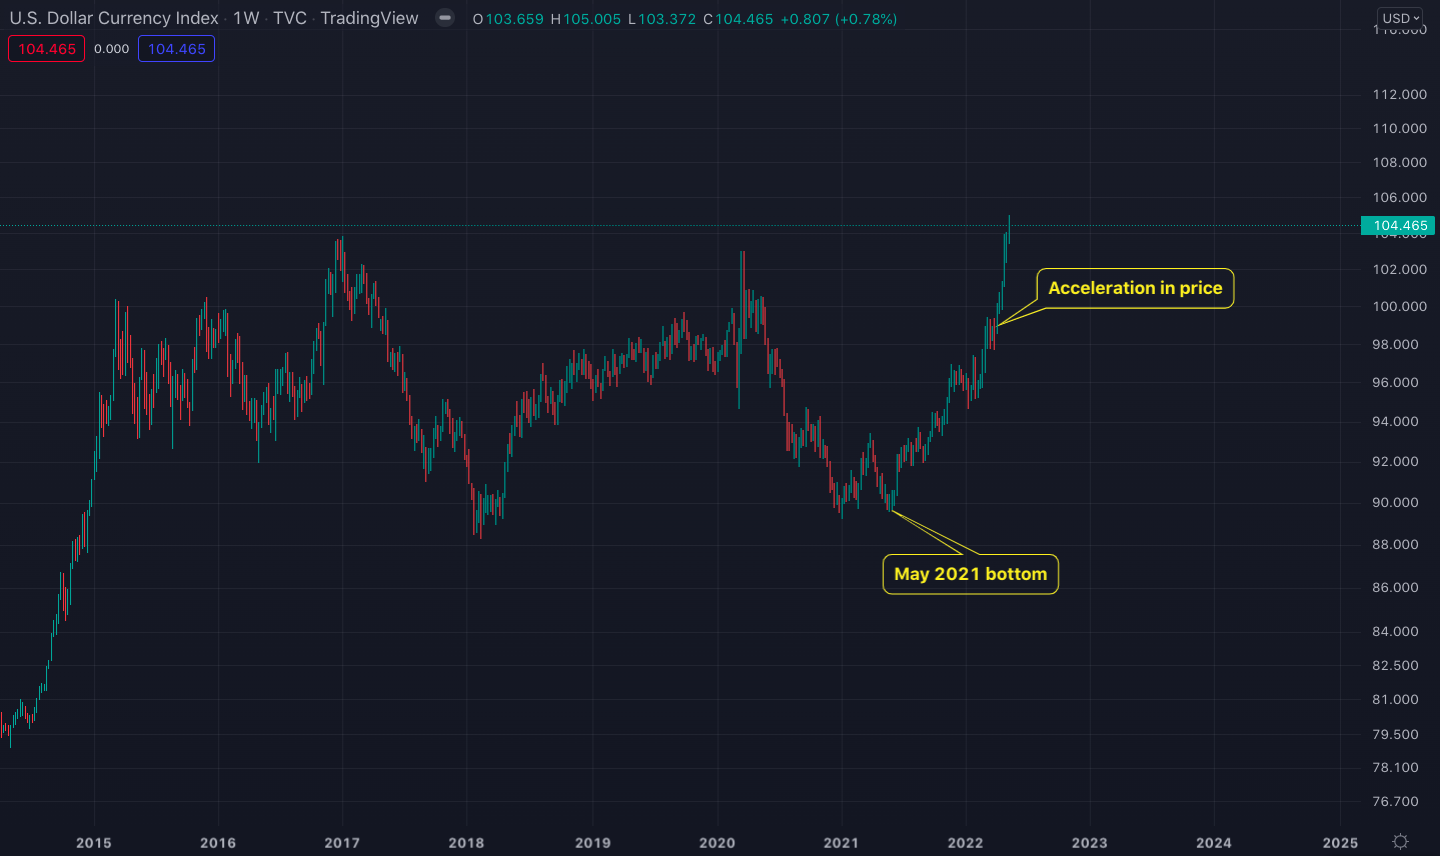
US Dollar Currency Index (DXY) price chart on a weekly time frame. Each candlestick represents a week. Source: Tradingview
An accelerated run to the top of the horizontal price range rather than a slowly grinding increase suggests that the trend with DXY is quite strong now. Considering that the price has been in the same horizontal range for eight years, it may this time break out of this channel with the momentum of the ongoing strong trend.
When you zoom out for a long-term view of the picture, the US Dollar currency index is at a historical resistance level right now considering the last 50 years. The current resistance corresponds to the monthly resistance from 1974, 76, 86, and finally 1999. If it flips this level to the upside on a monthly closing candle, it could be clear skies up to the 120 level (please see the chart below).
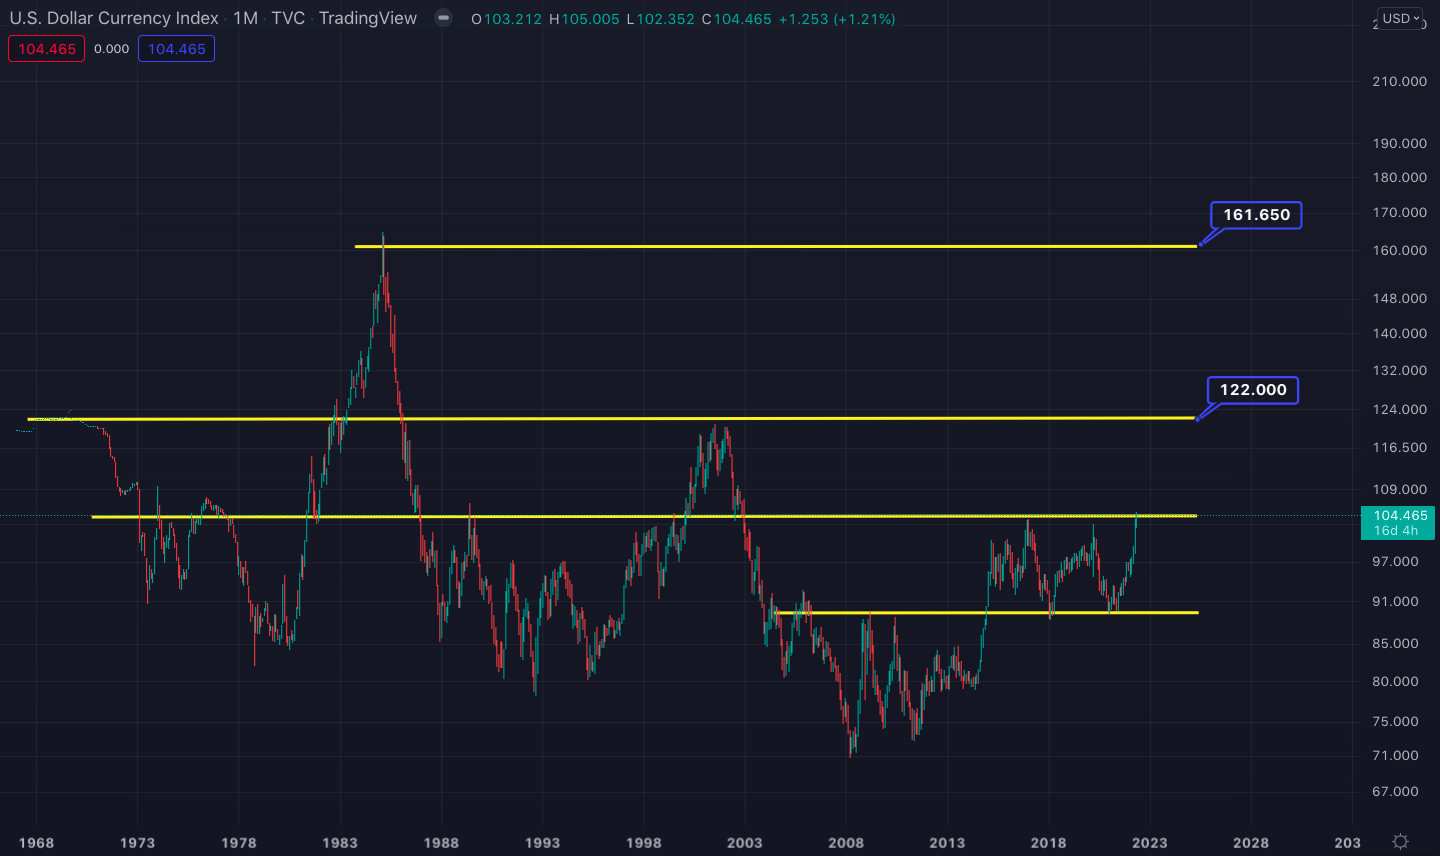
US Dollar Currency Index (DXY) price chart on a monthly time frame. Each candlestick represents a month.
Even a 10% increase in the US Dollar currency index has historically been quite destructive for risk-on assets like stocks and cryptocurrencies. When DXY climbed from 90 to 100 in 2018, it was enough to drop the price of Bitcoin from $20,000 to $3,000.
Going to the 120 resistance from the current index level would correspond to an even higher, 15% increase in the DXY price.
DXY’s all-time high price was at around 160 when excessive inflation in the second half of the 1970s was followed by interest rate hikes and an accompanying recession. It started surging in 1980 at 85 and climbed all the way up to 160 by 1985.
The current inflationary environment could be more in tune with the late 1970s. The U.S. Dollar currency index is something to watch closely in the coming days.
- US 10-year yield
Another inversely correlated asset to Bitcoin is the US bond yields. Stocks are a derivative of the bond market. When the value of bonds falls, it usually drags the stock market down with itself. As cryptocurrencies have historically been correlated to the U.S. stock markets, a drop in stocks usually meant drops for cryptos as well.
When the bond market drops, bond yields increase. As you can see in the below chart, the yield for the ten-year US bond has been increasing since the Covid 19 flash crash and it is currently breaching a very major diagonal resistance that has been intact since 1981.
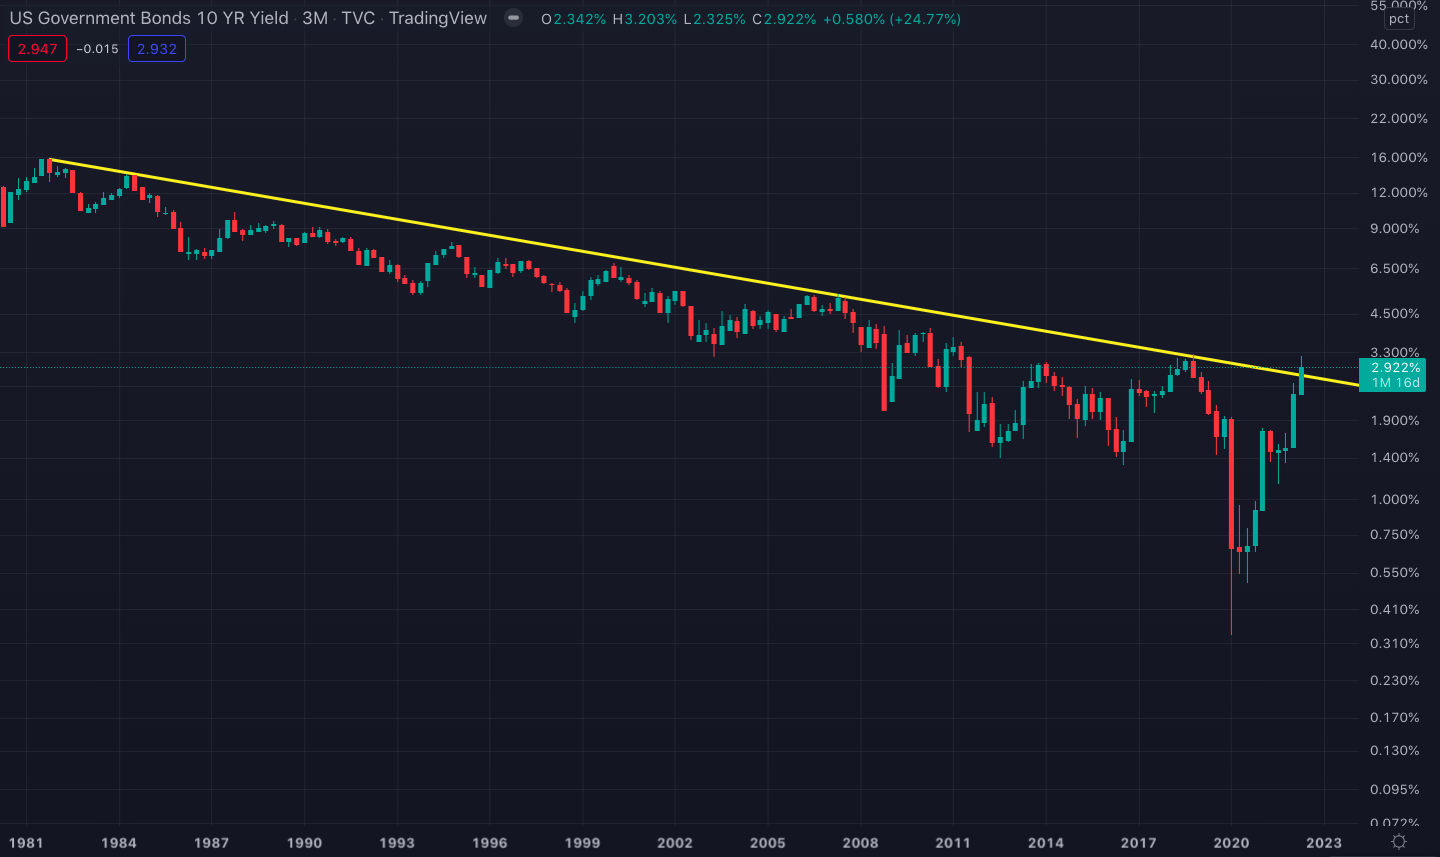
10-year US bond yield chart on a quarterly time frame. Each candlestick represents three months
The current candle is pushing above the 40-year-old resistance which will close at the end of June. If the candle closes June above the diagonal resistance, it may spell serious trouble for all markets including cryptocurrencies since yield is usually inversely correlated to assets.
- Bitcoin bear flag
The Bitcoin bear flag that had been forming between January 22 and May 4 finally broke down on May 5 following the Fed’s interest rate hike.
Bear flags are the exact opposite of bull flags. The pole of the flag is downwards instead of upwards and the flag is tilted upwards. Therefore, a breakout from the flag is a downside movement instead of an upside.
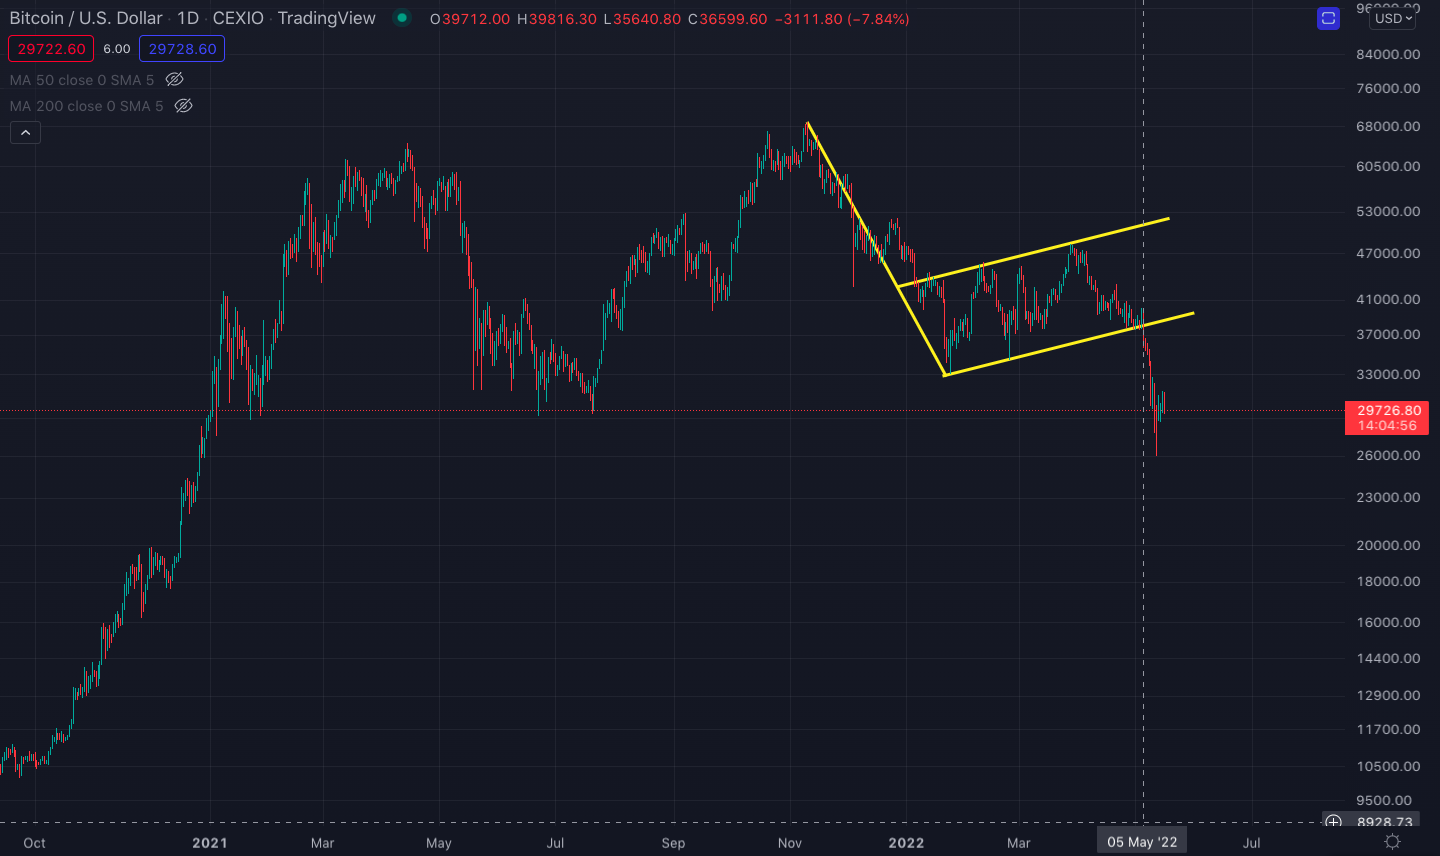
Bear flag on the Bitcoin/U.S. Dollar price chart
The target price of a bear flag is estimated by taking the length of the flag pole and extrapolating it down from the flag’s breakout point, which is the May 5 breakdown with the current bear flag.
As you can see in the below chart, taking the pole that went down from Bitcoin’s $69,000 all-time high to its January 24 low at $33,000 would give a target price of $18,000 per coin, which roughly corresponds to the high price of the previous bull run in 2017.
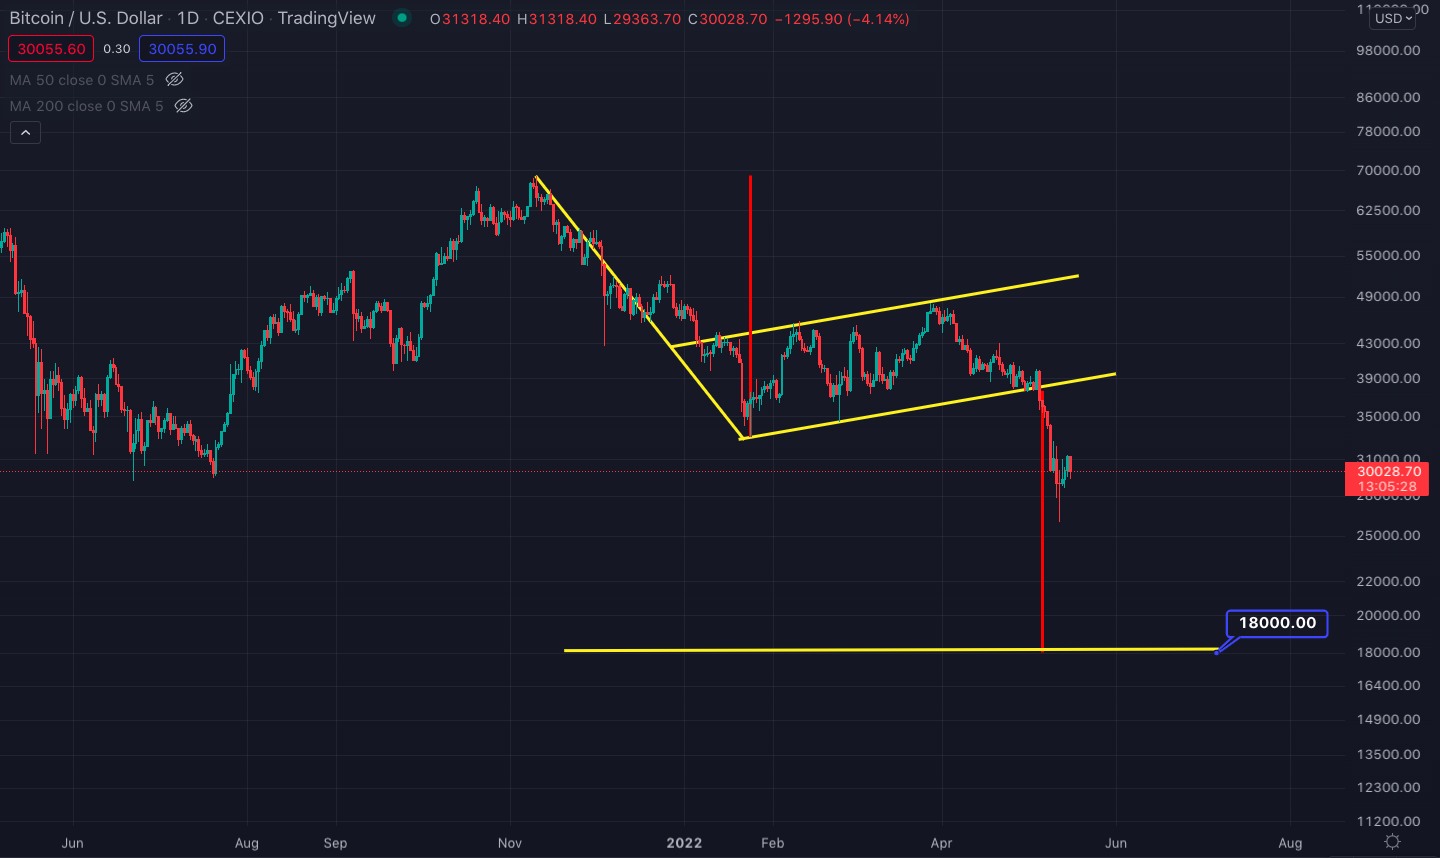
Bitcoin bear flag’s target price is estimated by extrapolating the flag pole length
You should carefully note that prices do not have to bottom or top out at the flag target prices. The above chart is just a common estimation method that has generally played out with accuracy in flag formations of the past.
Still, markets widely use such estimation methods to define buy or sell targets for their trades so in case the current bear flag target is ever achieved, it would likely be accompanied by heavy buying activity at those price levels.
- 3-Day Death Cross
Bitcoin’s expected 3-day death cross finally occurred on May 16. The 3-day death cross is the crossing down of the 50 SMA (the yellow line in the chart below) and overlapping the 200 SMA (red line).
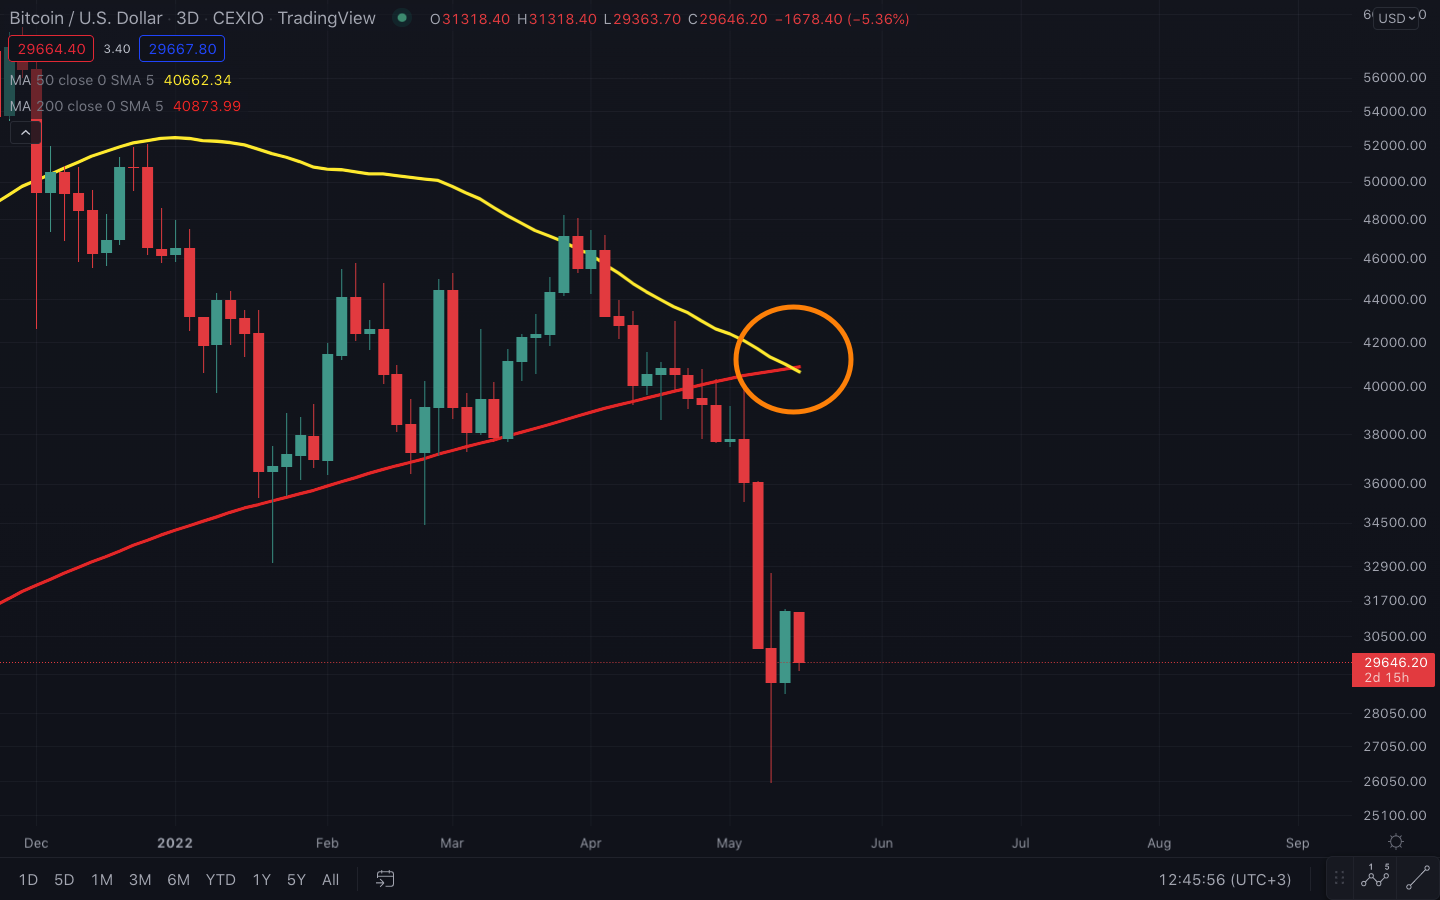
Bitcoin/U.S. Dollar 3-day price chart. The yellow line represents the 50 SMA and the red line represents the 200 SMA.
Throughout Bitcoin’s history, 3-day death crosses have ended with mega crashes and each time capitulation happened very quickly. If history is a sign, capitulation may be very close for Bitcoin (which statistically means a 50% mega crash) and so is the market cycle bottom.
In the below chart, you can see the previous 3-day death crosses in Bitcoin’s history, both of which were followed by a 50% crash within a single month.
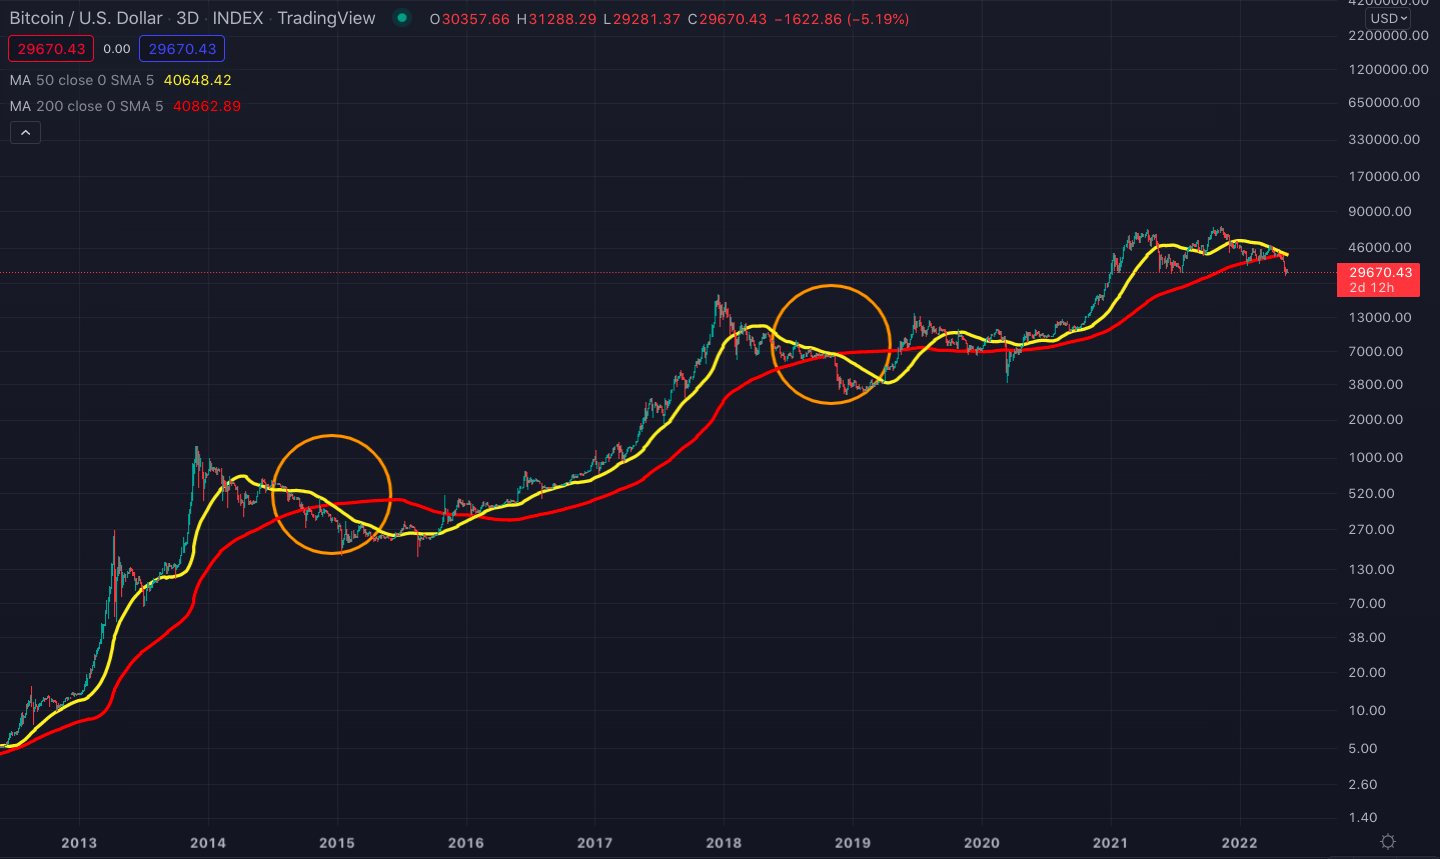
Historical 3-day death crosses on the Bitcoin/U.S. Dollar chart
Bitcoin Dominance
Bitcoin dominance, which is the ratio of Bitcoin’s market capitalization against the total crypto market value bounced with a ferocious spike on May 11 (+6%) for the first time since the May 2021 market crash. This was a consequence of many investors either exiting or reducing their stablecoin and altcoin positions as a response to the UST/Luna crisis.
The Bitcoin dominance has been consolidating at around its 40% lows for over a year (see the chart below). A year-long horizontal accumulation followed by the two strong candles on May 11 and 12 could play out as a textbook trend reversal for the Bitcoin dominance. If the dominance starts a new uptrend, money will generally flow out of Ethereum, stablecoins, and other altcoins to Bitcoin in the upcoming months.
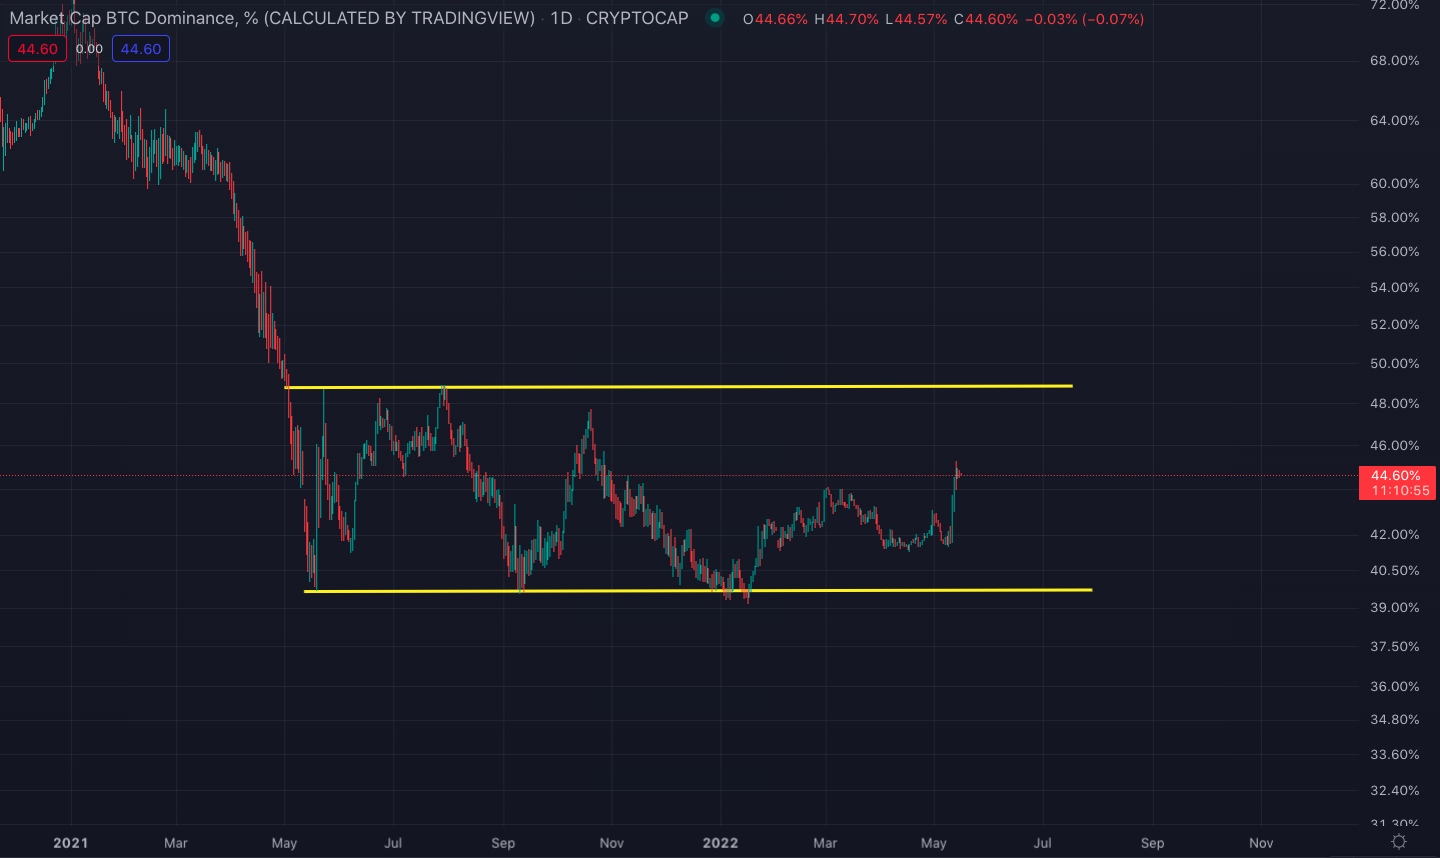
The Bitcoin dominance chart