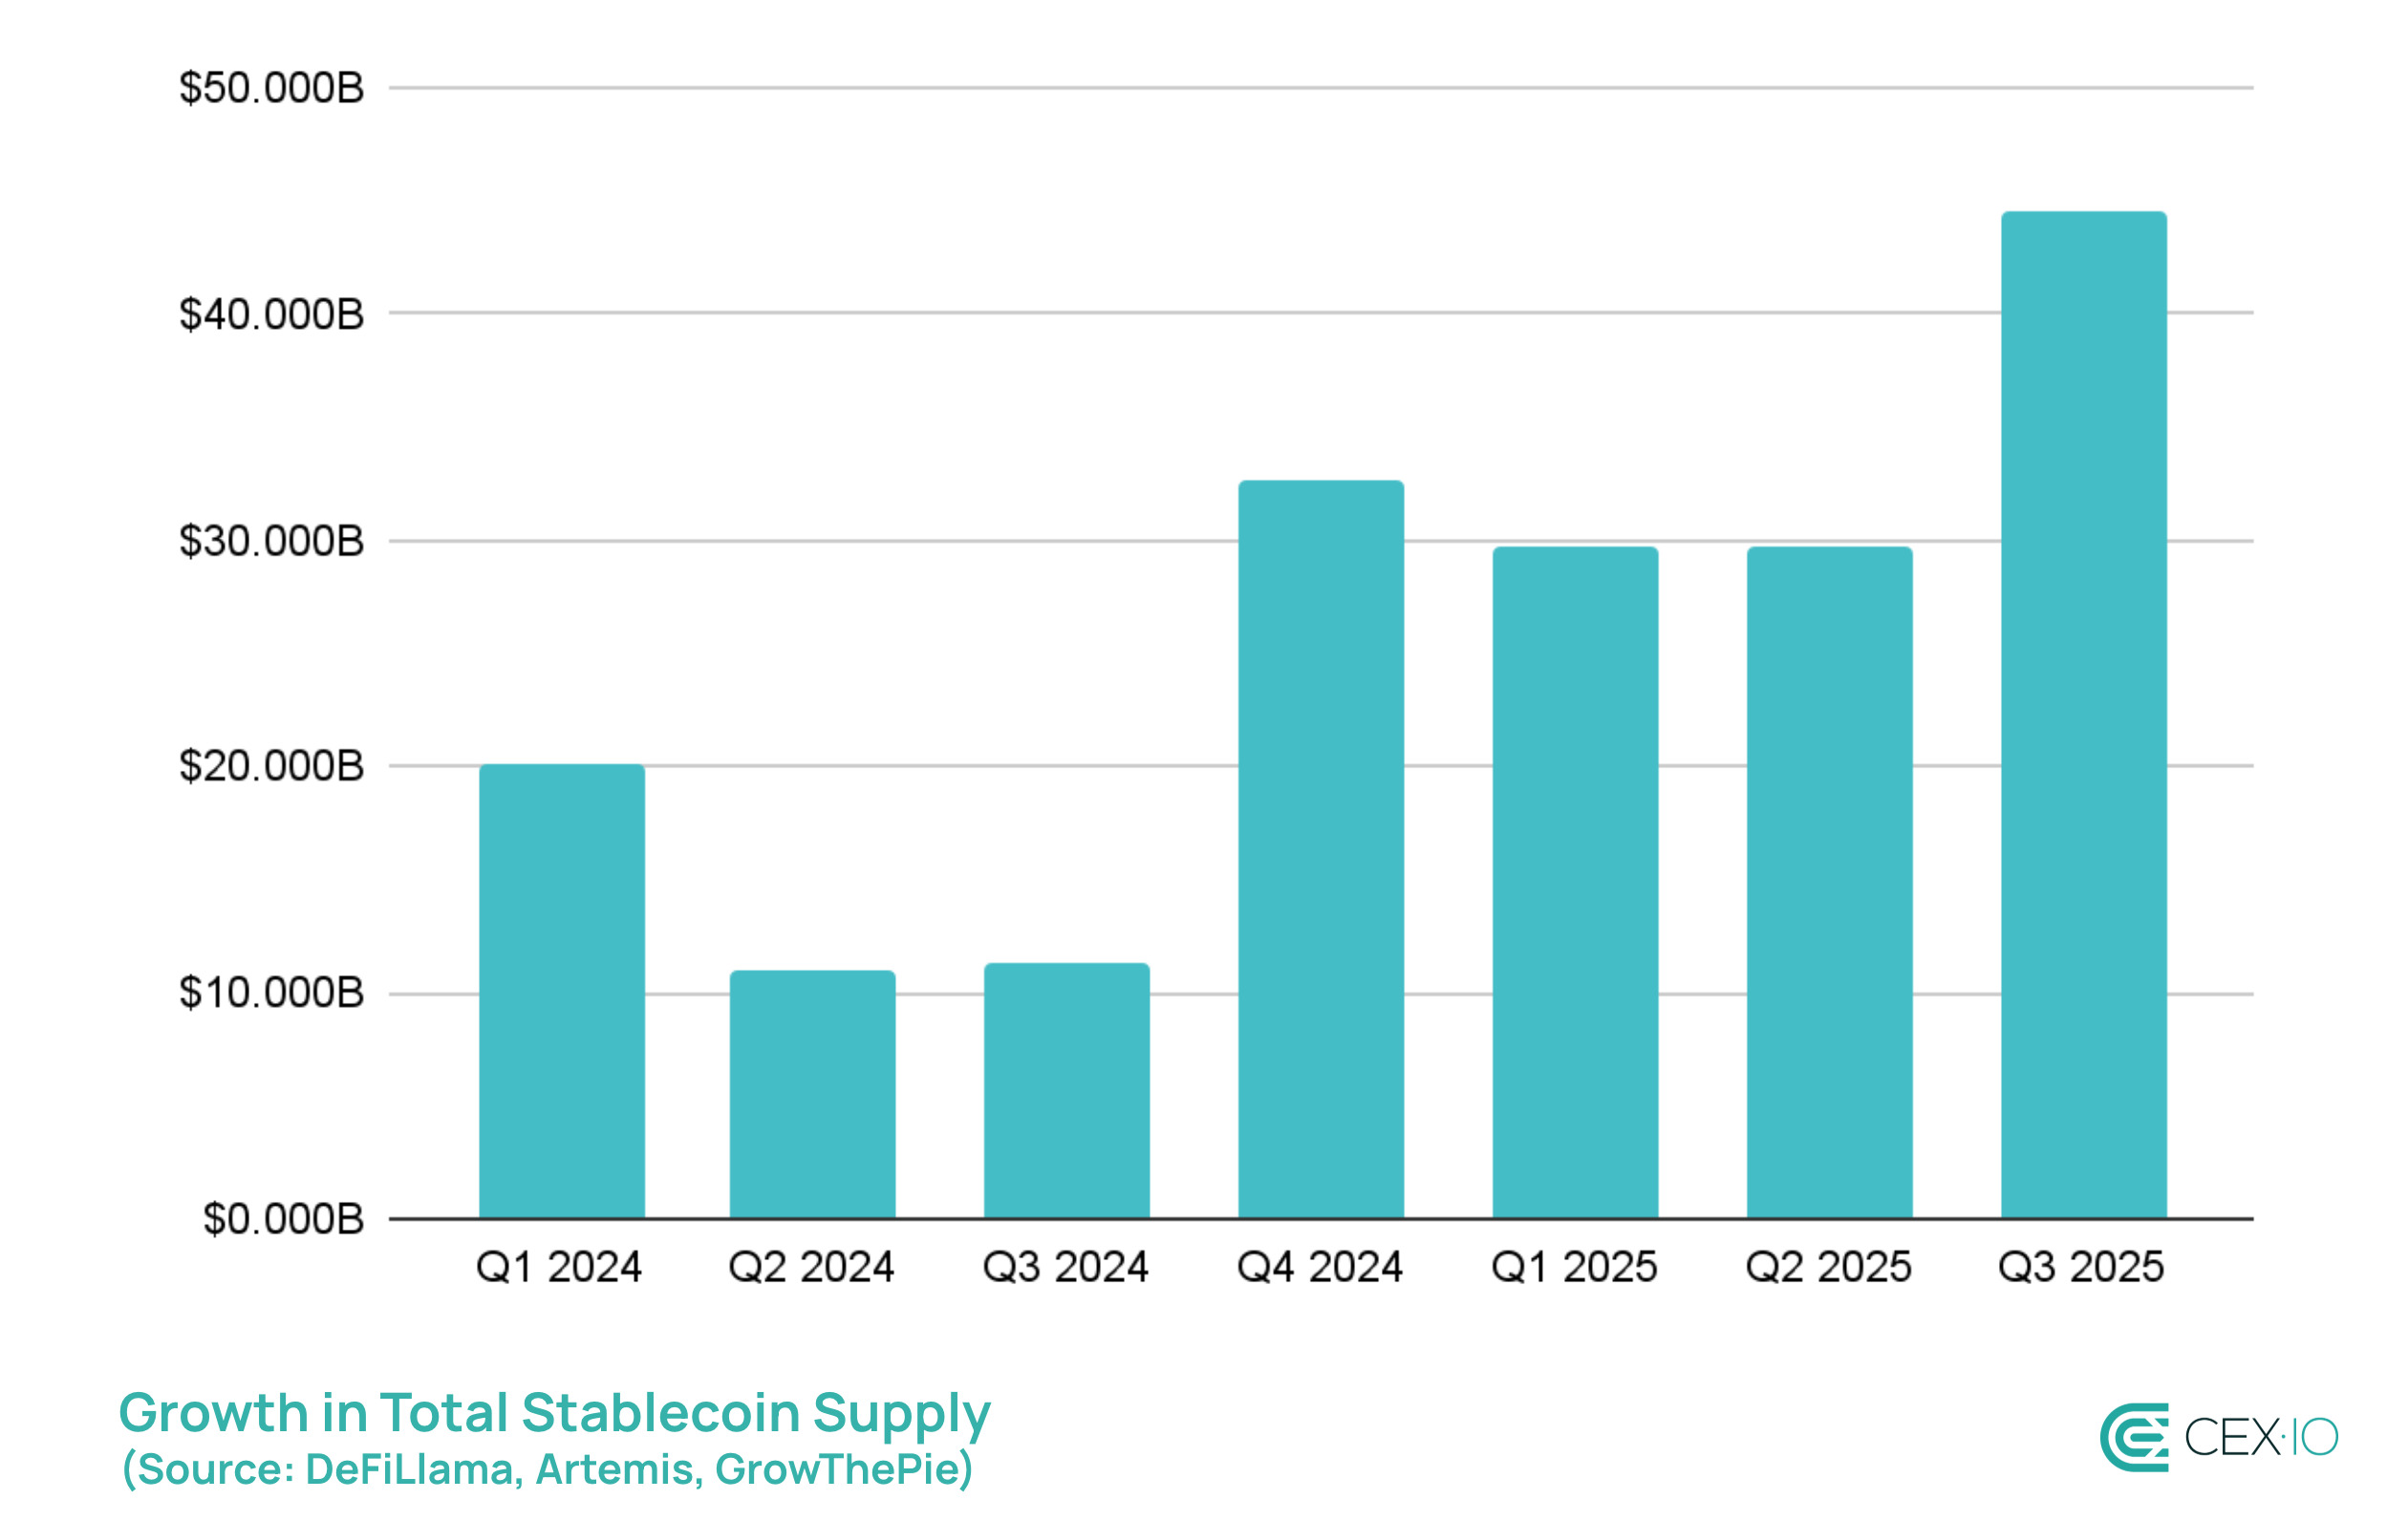
- Stablecoin supply jumped nearly $45 billion in Q3, showing the largest quarterly expansion in history.
- 84% of new stablecoin supply in Q3 came from USDT, USDC, and USDe, while 69% of new stablecoin issuance is hosted on Ethereum L1.
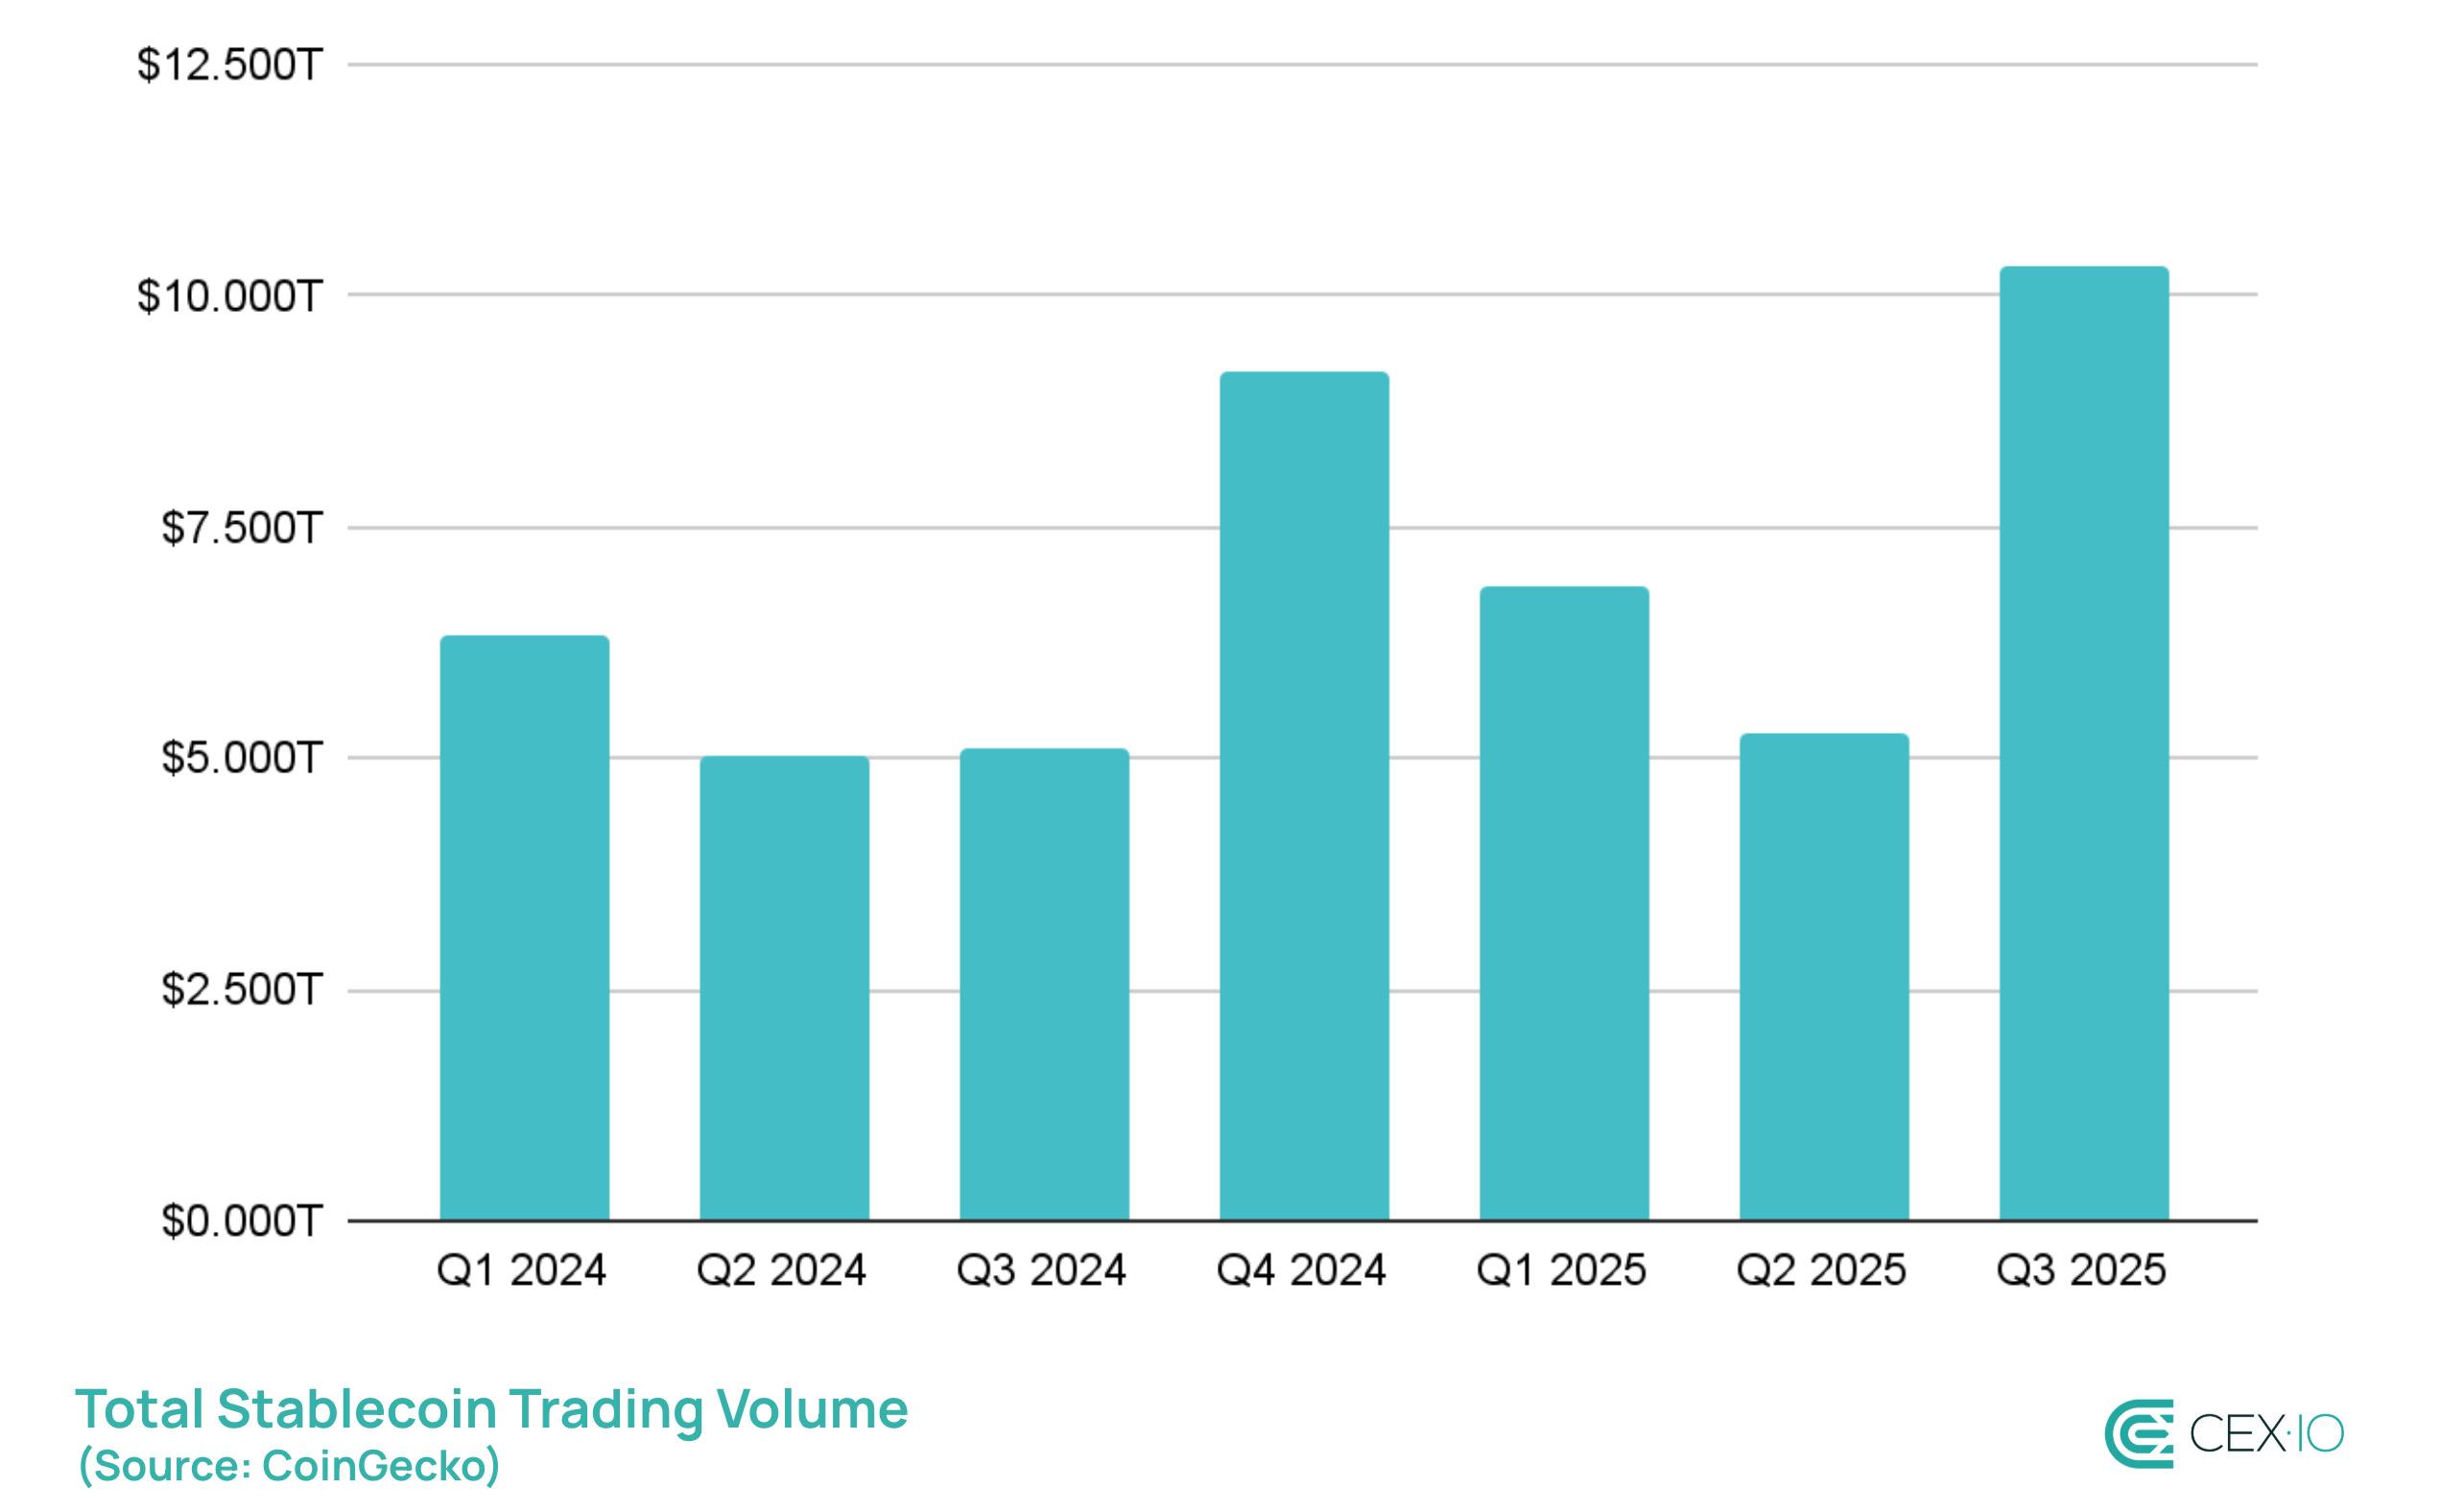
- Stablecoin trading volume hit $10.3 trillion in Q3, marking the most active quarter since Q2 2021.
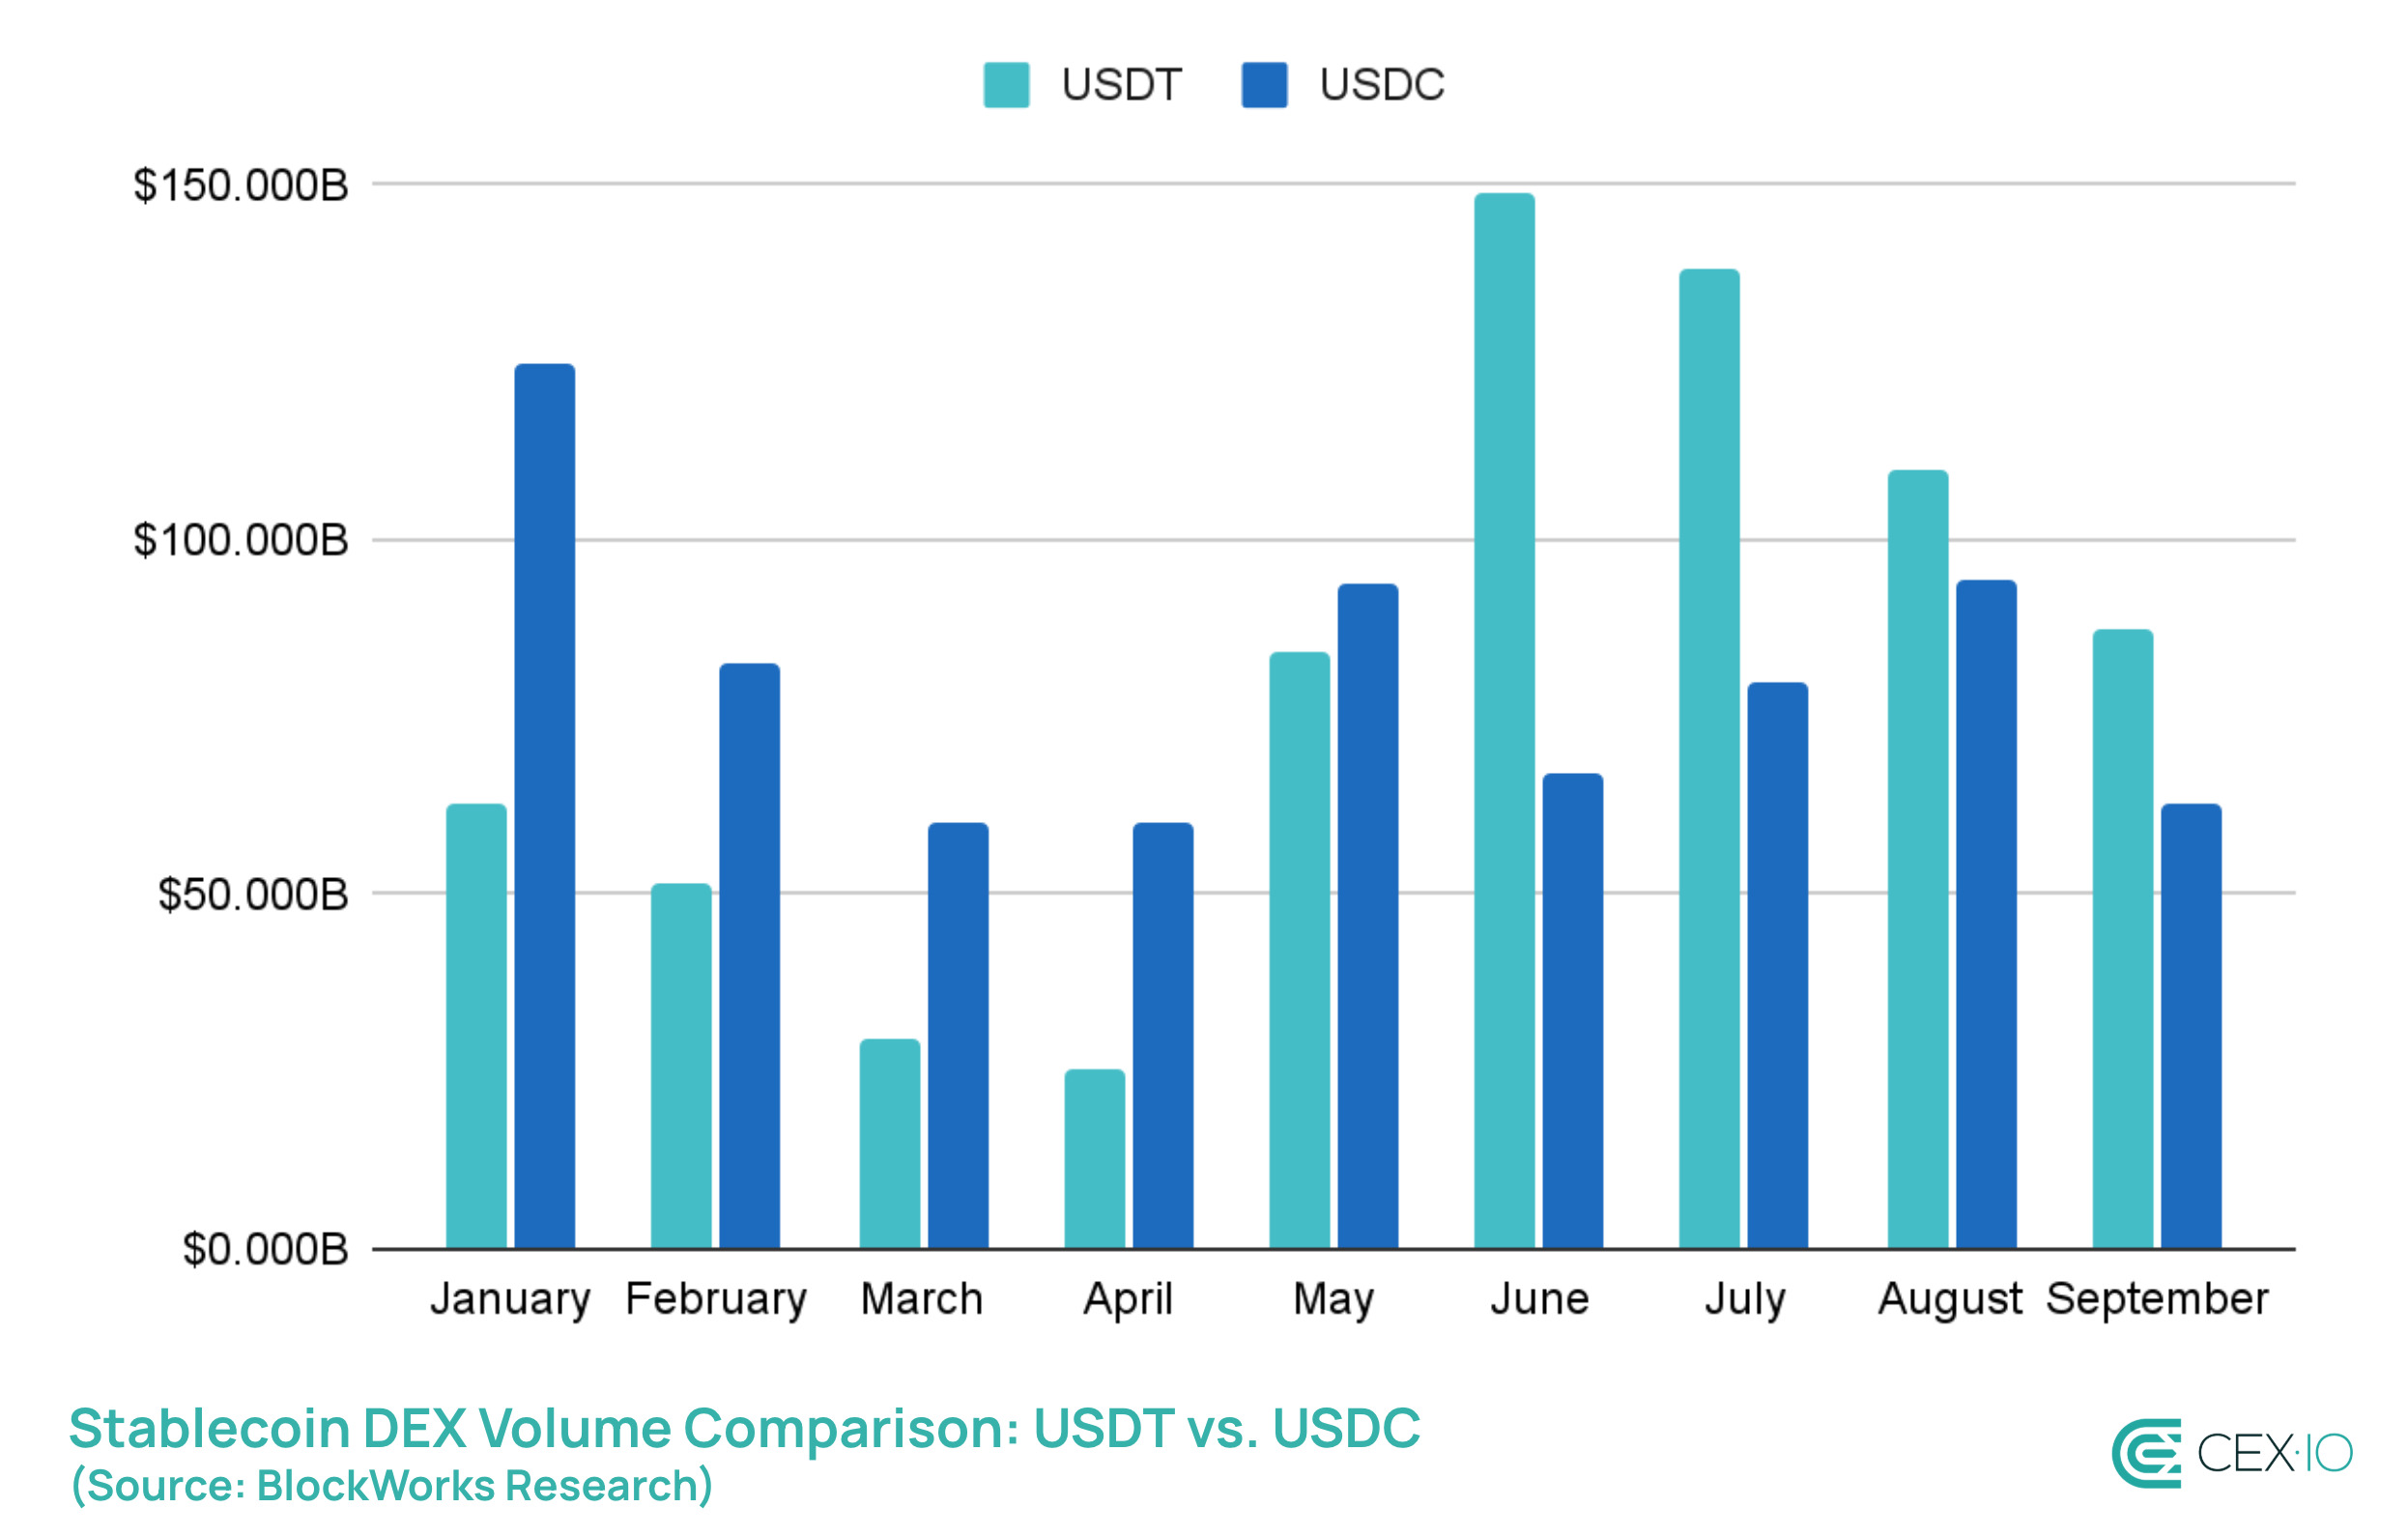
- USDT flipped USDC in DEX trading, crossing $100 billion in monthly volume for the first time.
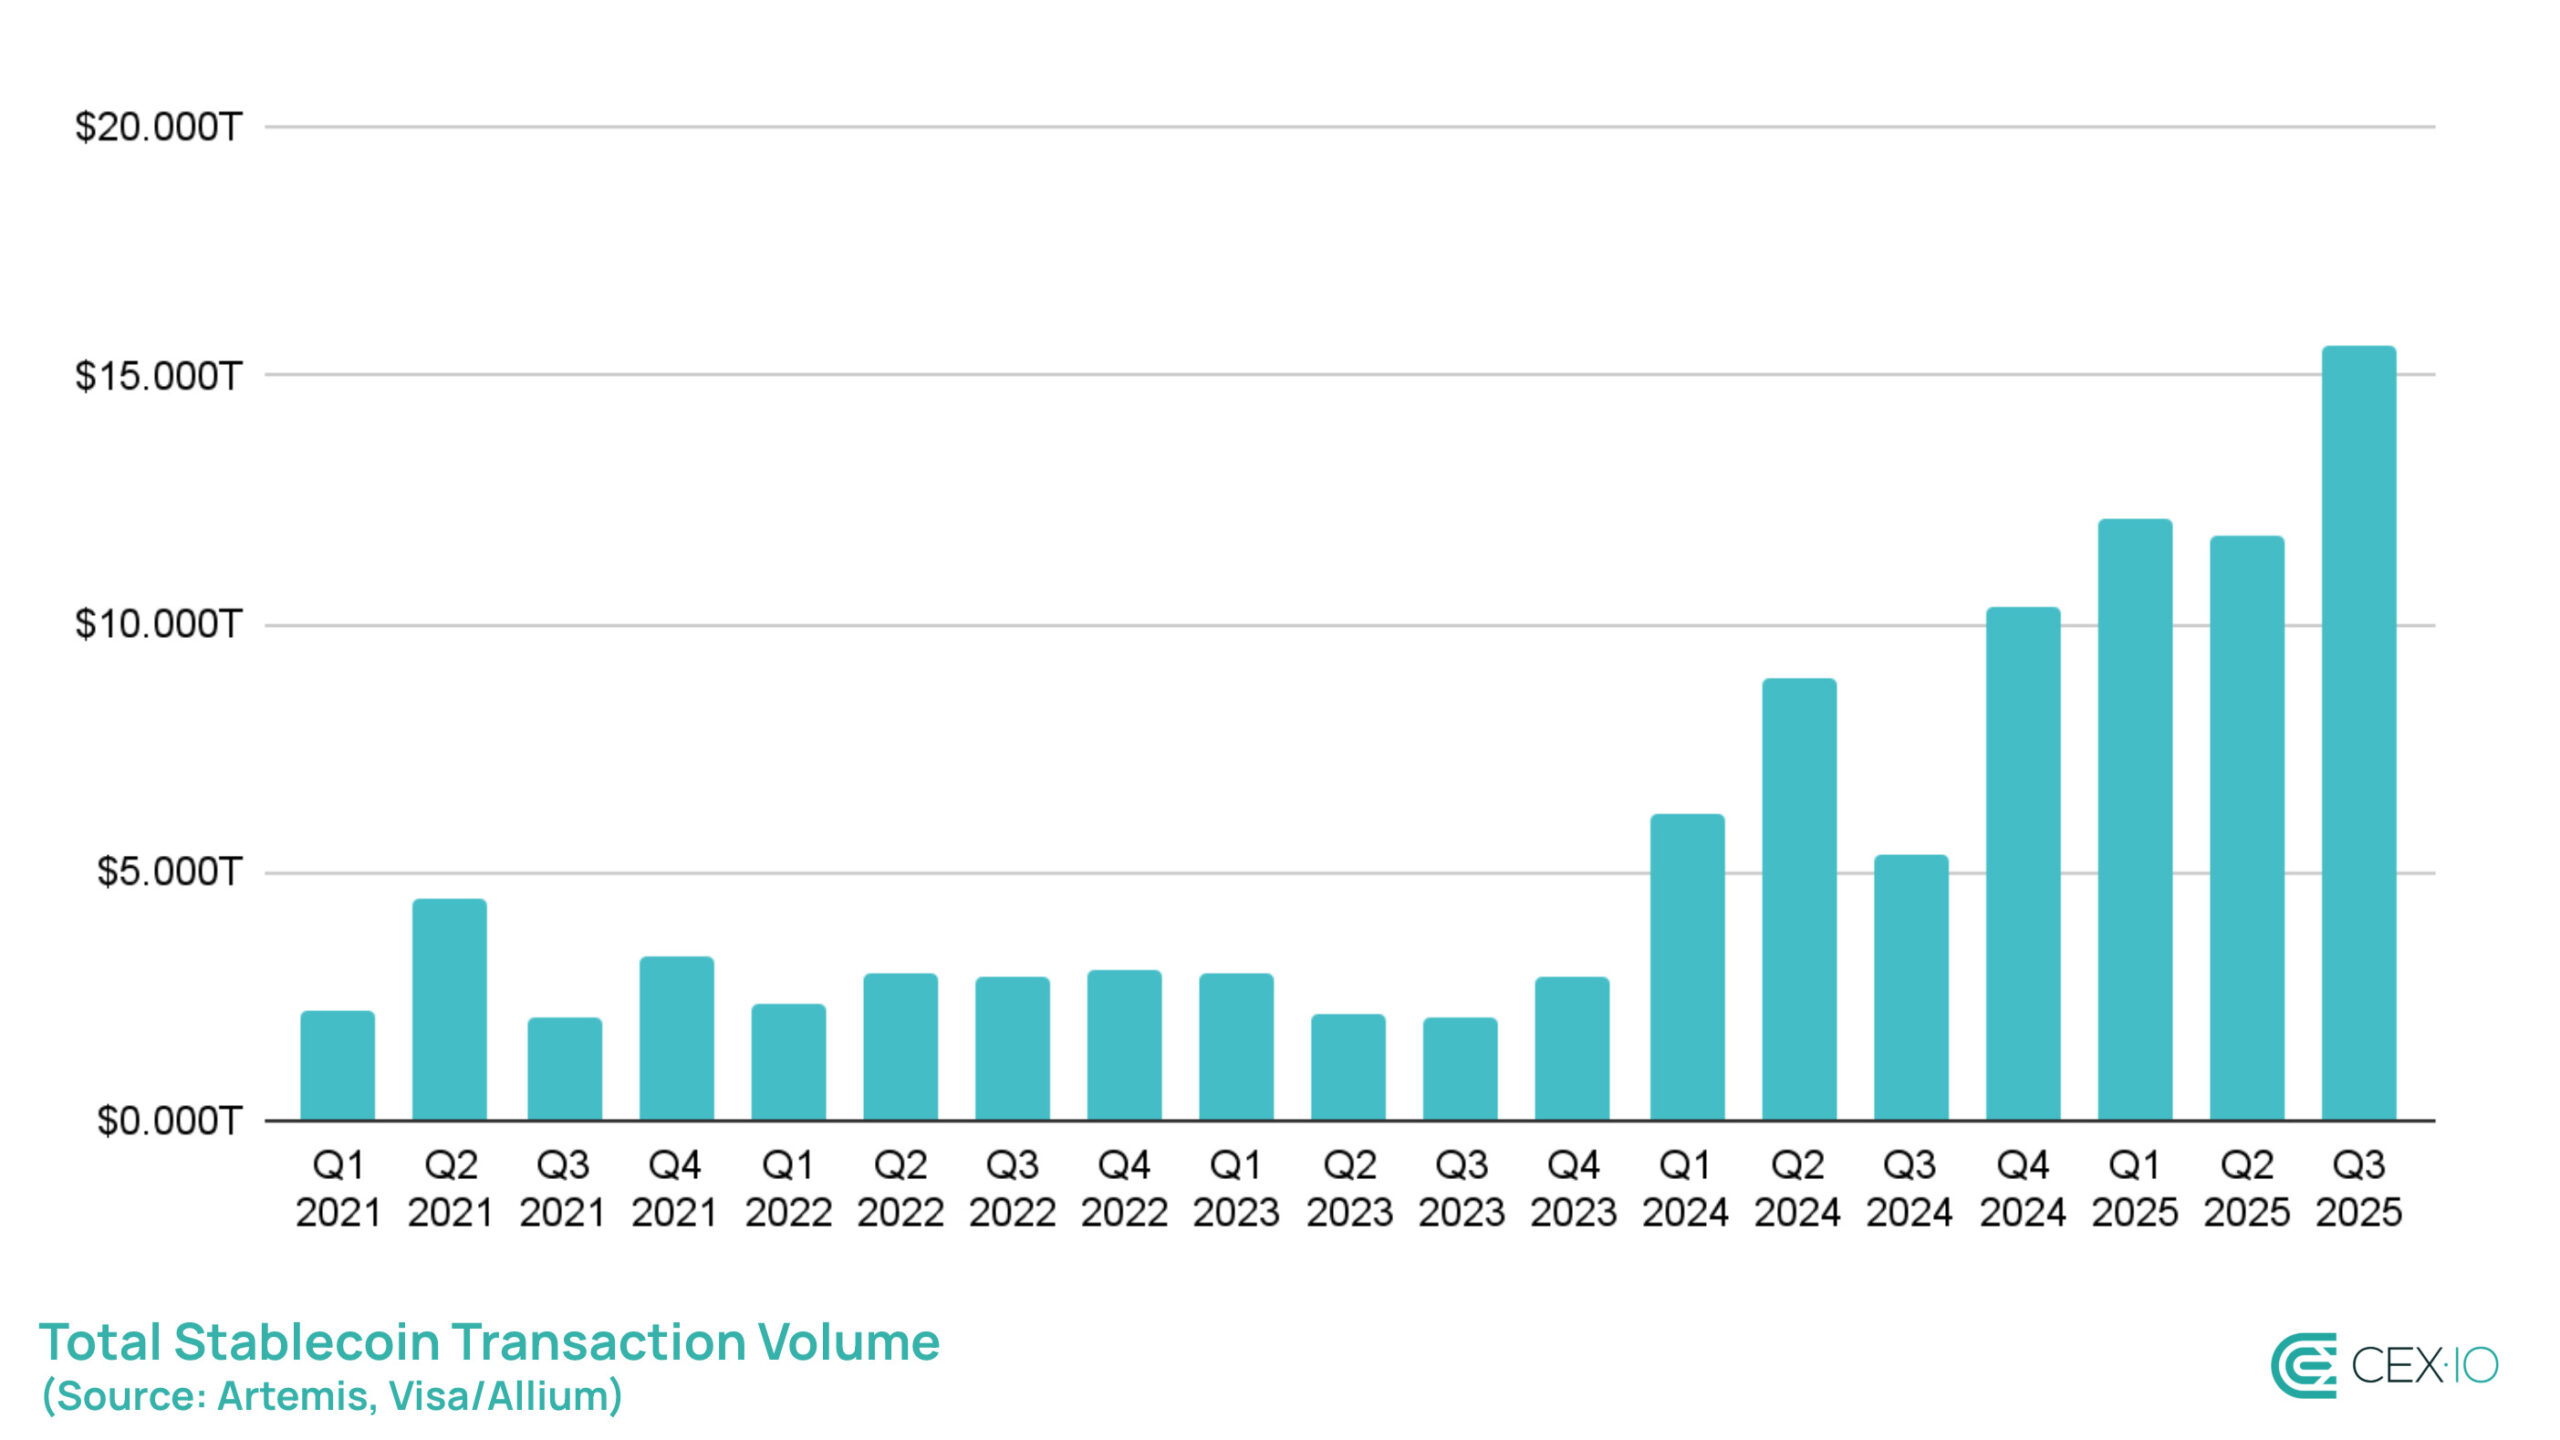
- On-chain stablecoin transfers reached a record $15.6 trillion in Q3, with bots accounting for 70% of activity.
- Retail stablecoin transfers under $250 hit an all-time high in September, putting 2025 on track for over $60 billion in volume.
Q3 is typically one of the quieter periods for crypto markets, yet 2025 broke that pattern in spectacular fashion. Far from being a seasonal lull, the quarter became one the most active periods on record for stablecoins, fueled by both regulatory breakthroughs and surging user interest.
Google searches for the term “stablecoin” hit record levels, driven by major regulatory news. The U.S. passed the Genius Act, the most comprehensive piece of stablecoin legislation to date. In addition, the SEC released new guidance on accounting rules, stating that USD-pegged stablecoins could be treated as cash equivalents. These steps gave both investors and institutions more confidence in using stablecoins.
As a result, by the end of Q3, 2025 had already surpassed the totals of 2024 on multiple metrics, with Q4 still ahead. And since the final quarter is historically one of the busiest periods for stablecoins, momentum shows little sign of slowing. But for now, let’s look at Q3 winners and what made it such a standout quarter.
Supply Dynamics
By the end of Q3, the total stablecoin supply climbed close to $300 billion, growing by nearly $45 billion in just three months. This marks the largest quarterly stablecoin expansion in its history.
In relative terms, supply expanded by over 18%, outpacing the wider crypto market cap, which grew by 16% over the same period. This shows that stablecoins are gaining market share and strengthening their position as a backbone of liquidity and trading activity in the industry.
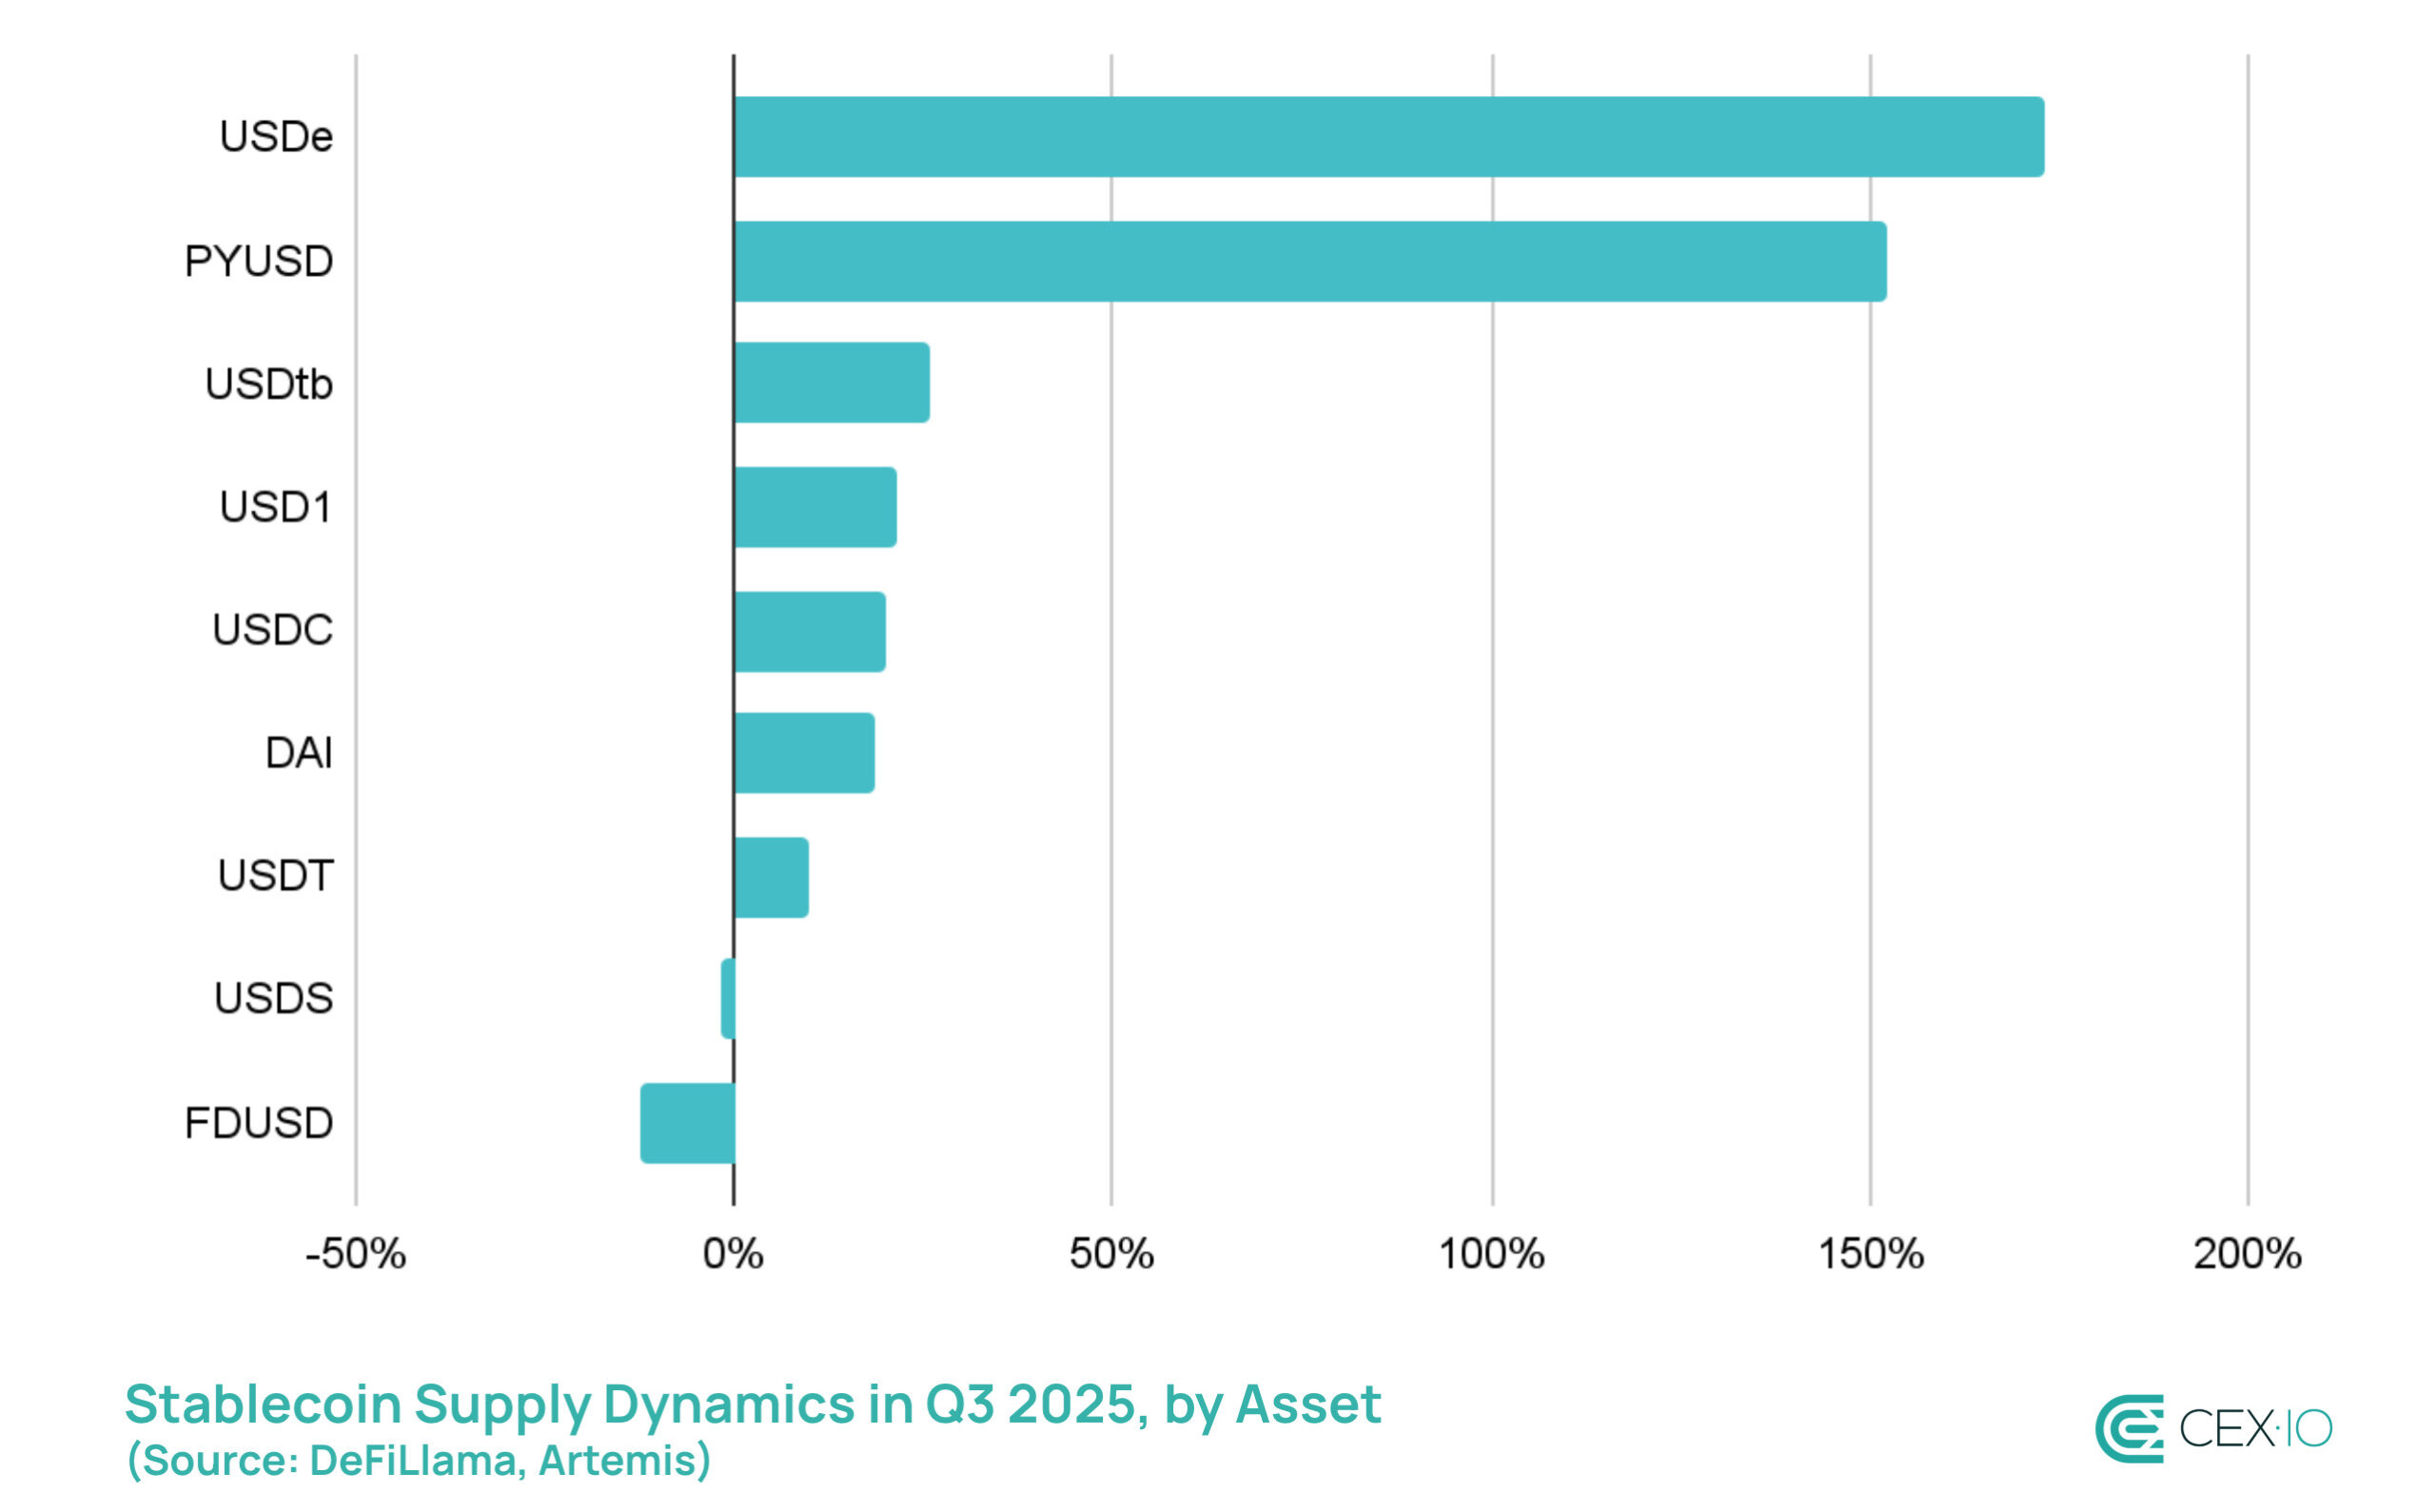
Most of this growth in Q3 came from three tokens — USDT, USDC, and USDe — which together accounted for 84% of the new supply. The standout were USDe and PYUSD, which expanded by more than 173% and 152% in Q3 alone, despite the Genius Act banning yield-bearing stablecoins in the U.S.
USDe took advantage of rising funding rates, offering more attractive yield, as crypto markets updated all-time highs in Q3. In addition, there’s been an explosive growth of leveraged yield strategies on protocols like Pendle and Aave. It allowed investors to deposit USDe, borrow against it, and then redeposit to amplify returns, creating strong demand for the token.
PYUSD supply increase was supported by its expansion into nearly 10 networks in Q3, primarily through LayerZero’s Stargate Hydra bridge, as well as increased DeFi integration, including the one with Spark.
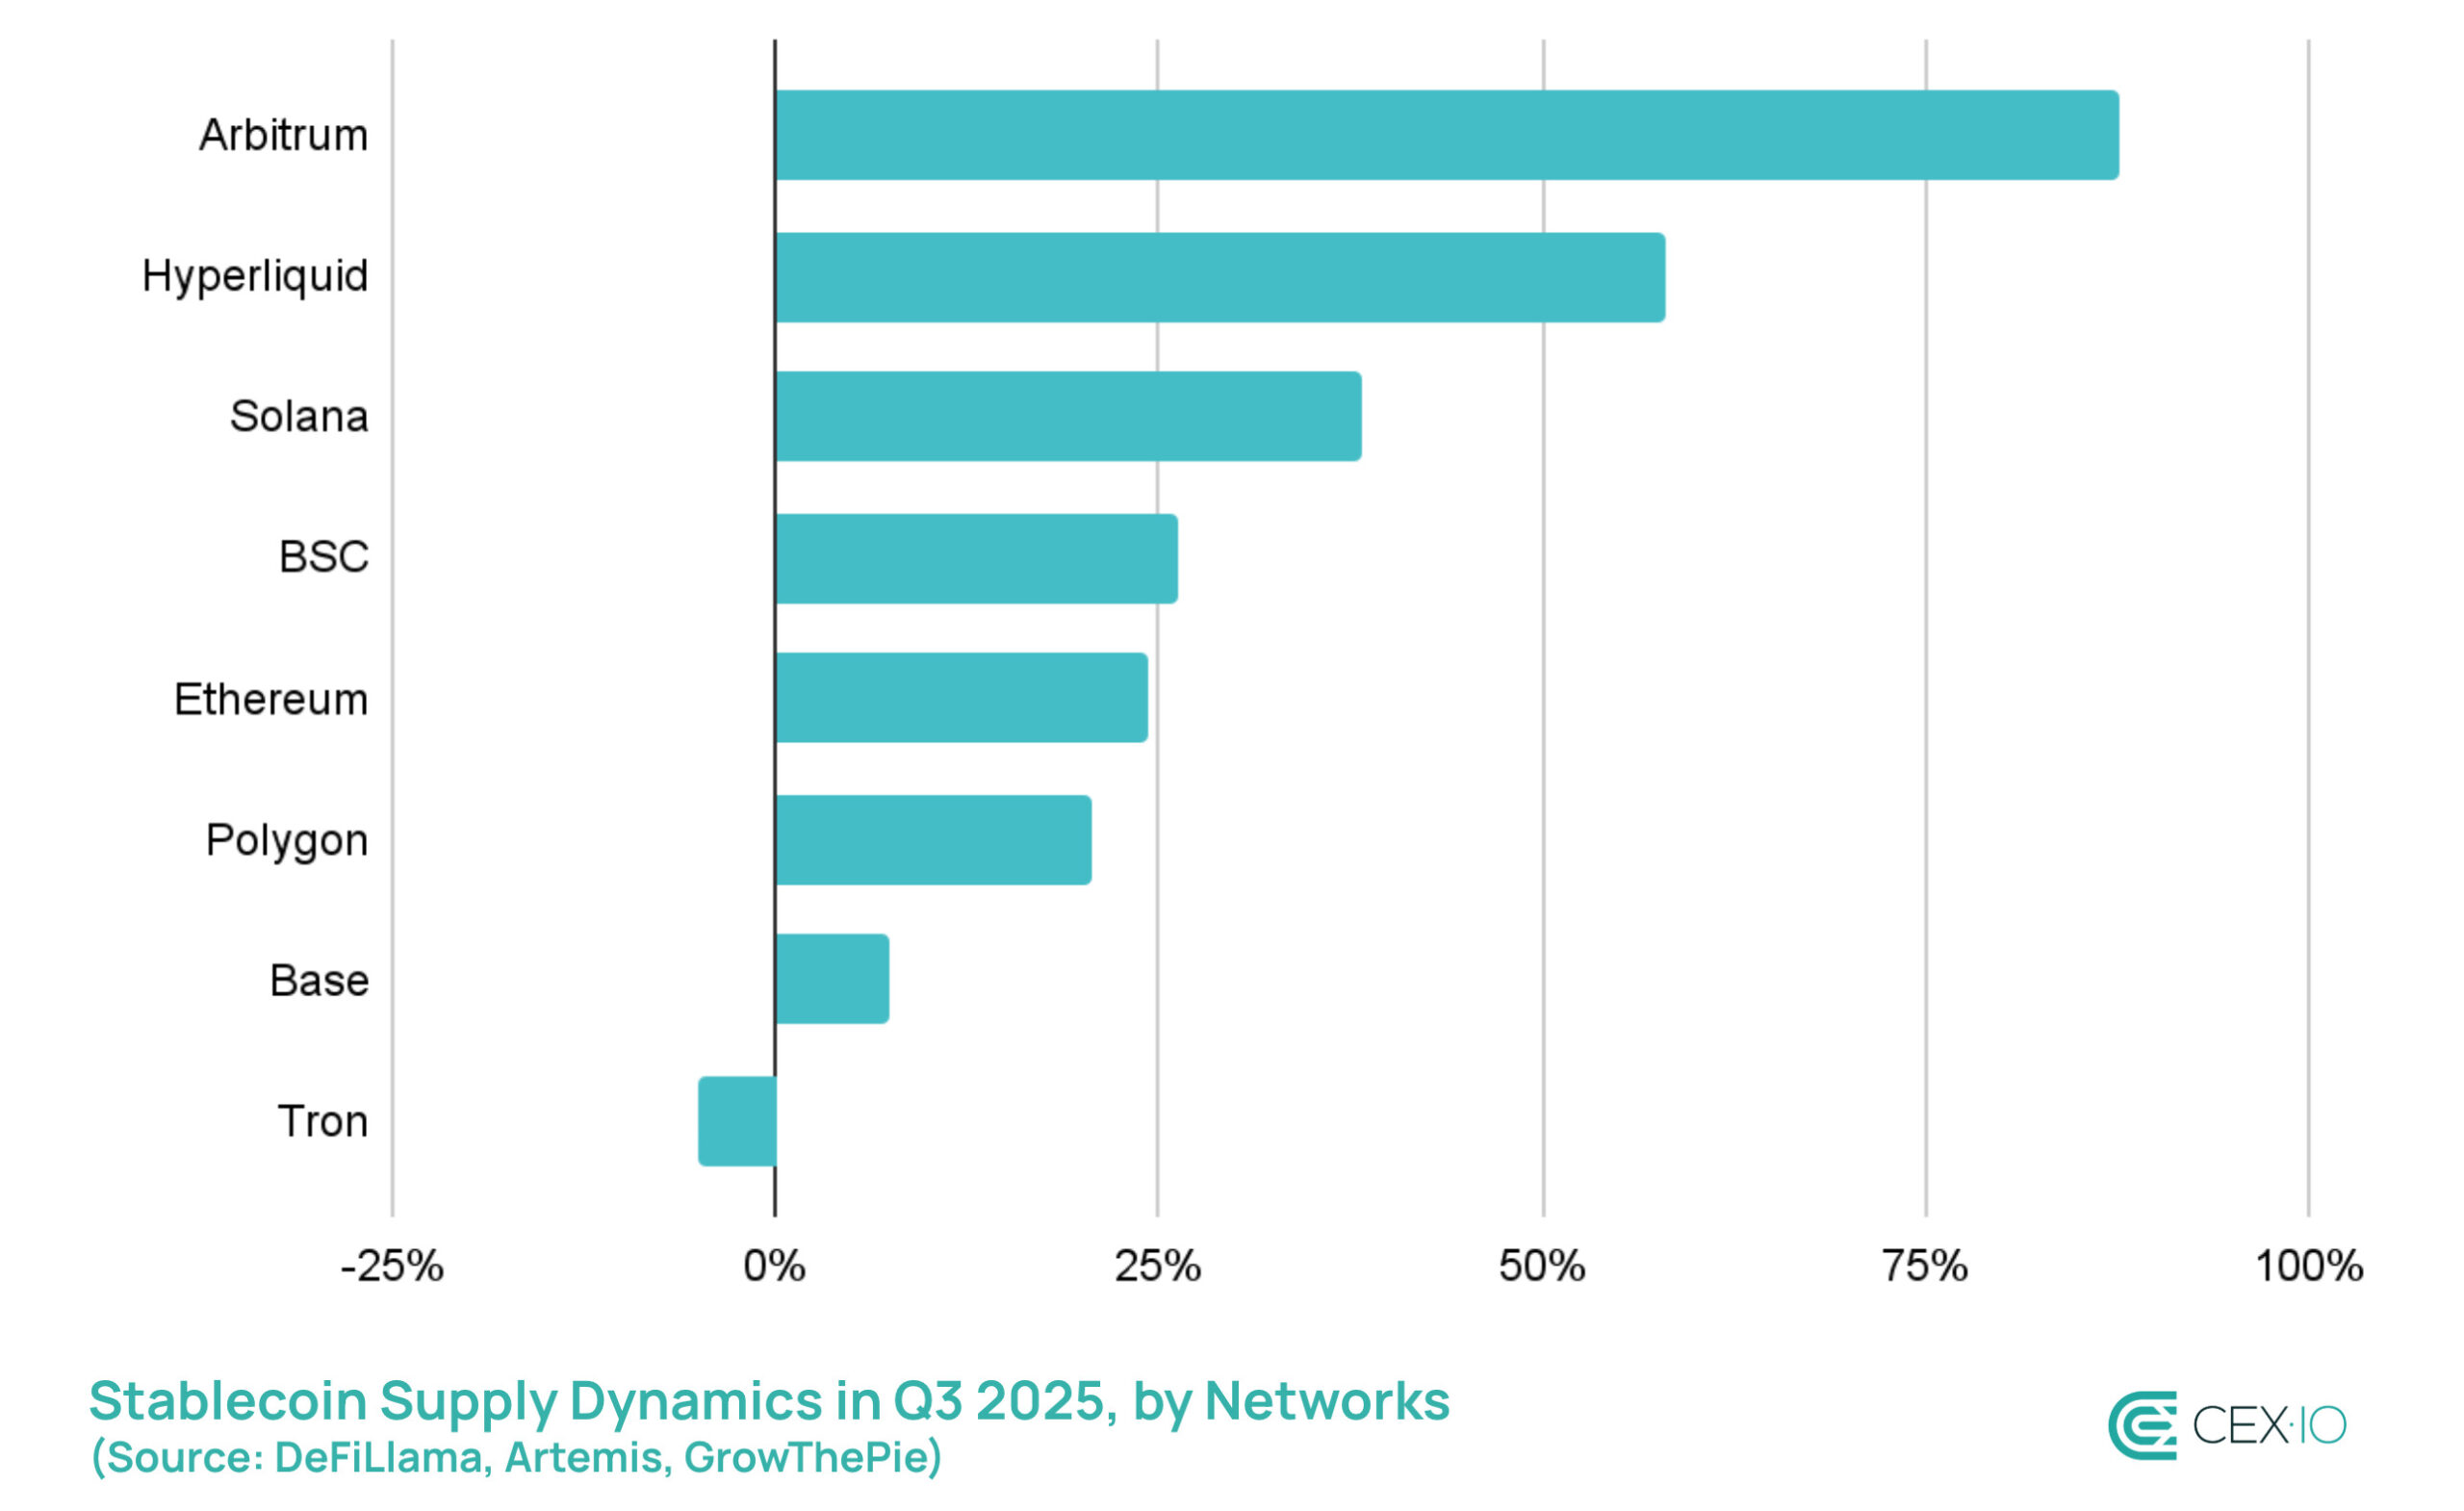
In terms of network distribution, Ethereum was the clear winner, hosting about 69% of all new stablecoin issuance in Q3. Ethereum also regained the top spot from Tron as the leading network for USDT supply due to decreased fees and record network activity. Tron, in contrast, was the only major network to see a decline in stablecoin supply, suggesting that users and liquidity are migrating toward alternatives.
Among smaller ecosystems, Hyperliquid’s L1 and Arbitrum were the fastest growers. The surge was tied to the rising adoption of Hyperliquid’s perpetual futures trading platform, which relies on USDC deposits through Arbitrum. This dynamic pushed Arbitrum’s stablecoin supply up by more than 88% in Q3, and lifted USDC’s dominance on Arbitrum from 44% to 58%.
Trading Dynamics
Total stablecoin trading volume reached $10.3 trillion in Q3 2025, making it the most active quarter since Q2 2021. In turn, average daily volumes climbed to $124 billion, more than double the levels recorded in Q2. The rebound was initially driven by heightened activity across broader crypto markets, but later in the quarter stablecoins also became a key vehicle for capital rotation as caution began to rise.
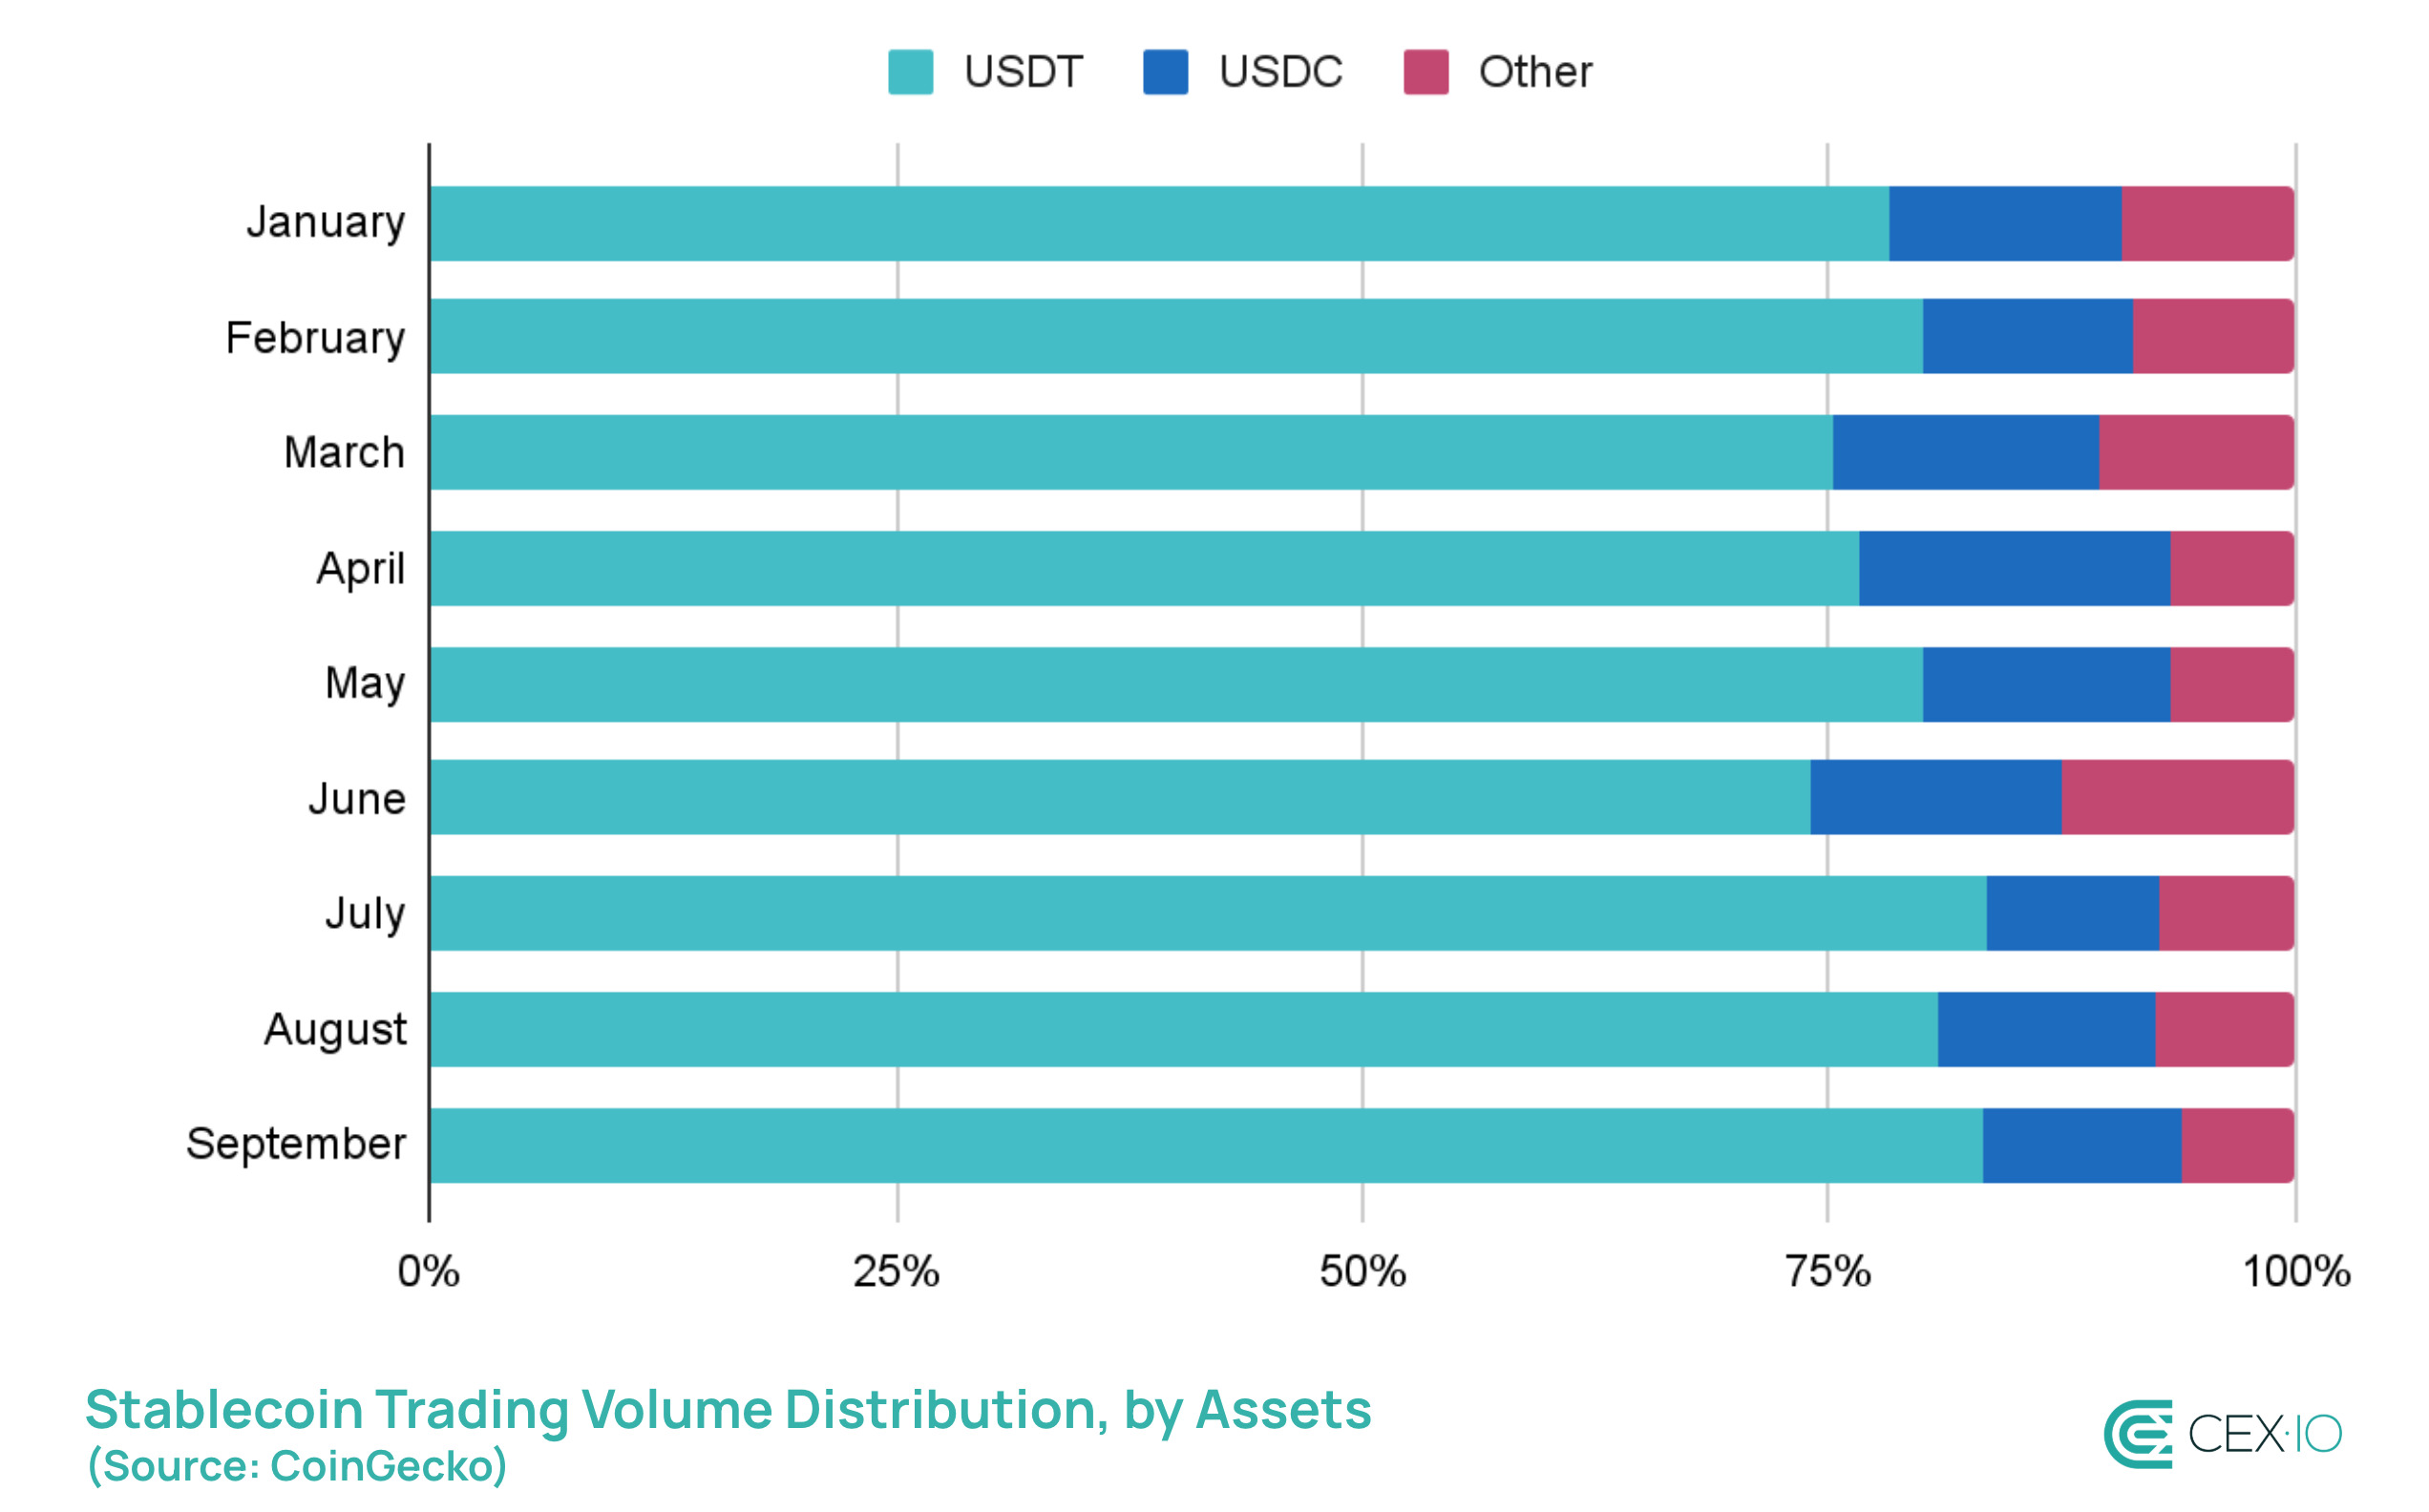
As overall activity accelerated, USDT managed to expand its dominance in trading volume. Its share climbed from 77.2% in Q2 to 82.5% in Q3, while USDC slipped from 14.5% to 10.5%. Other stablecoins also lost ground, falling to 7% combined.
A major development also unfolded on DEXs, where USDC had been maintaining a lead in trading since a memecoin boom in early 2024. But in Q3 2025, USDT decisively overtook USDC in DEX volume, surpassing $100 billion in monthly trading volume for the first time. This flip suggests that USDT’s dominance on CEXs is increasingly spilling over into DEXs, potentially encroaching on USDC’s preference in DeFi.
The major catalyst behind this surge has been DEX adoption within the BSC network. BSC share in total DEX volume surged from 13% to more than 43% throughout 2025, primarily in Q2 and Q3. At the same time, token dominance on BSC DEXs shows that USDT volume is 19 times larger than USDC’s, marking it as a go-to stablecoin for trading activity within the network.
Transaction Volume Dynamics
Total Volume
In Q3, stablecoin transaction volume surged to an all-time high of $15.6 trillion, helping 2025 surpass full 2024 levels. Organic transfers grew over 30%, to a new all-time high of $2.9 billion, which is the steepest rise since the post-election rally, indicating increased user adoption of stablecoins for peer-to-peer transfers and everyday payments.
However, bot-driven activity continues to dominate the landscape, accounting for 71% of all on-chain stablecoin transactions, up from 68% in Q2. The rise in automated transfers was most pronounced in August, and remained elevated through September despite a market cooldown. The surge of bot activity and unlabeled high-frequency transfers could raise questions about a potential increase of wash trading and non-economically-valuable transfers within the stablecoin space.
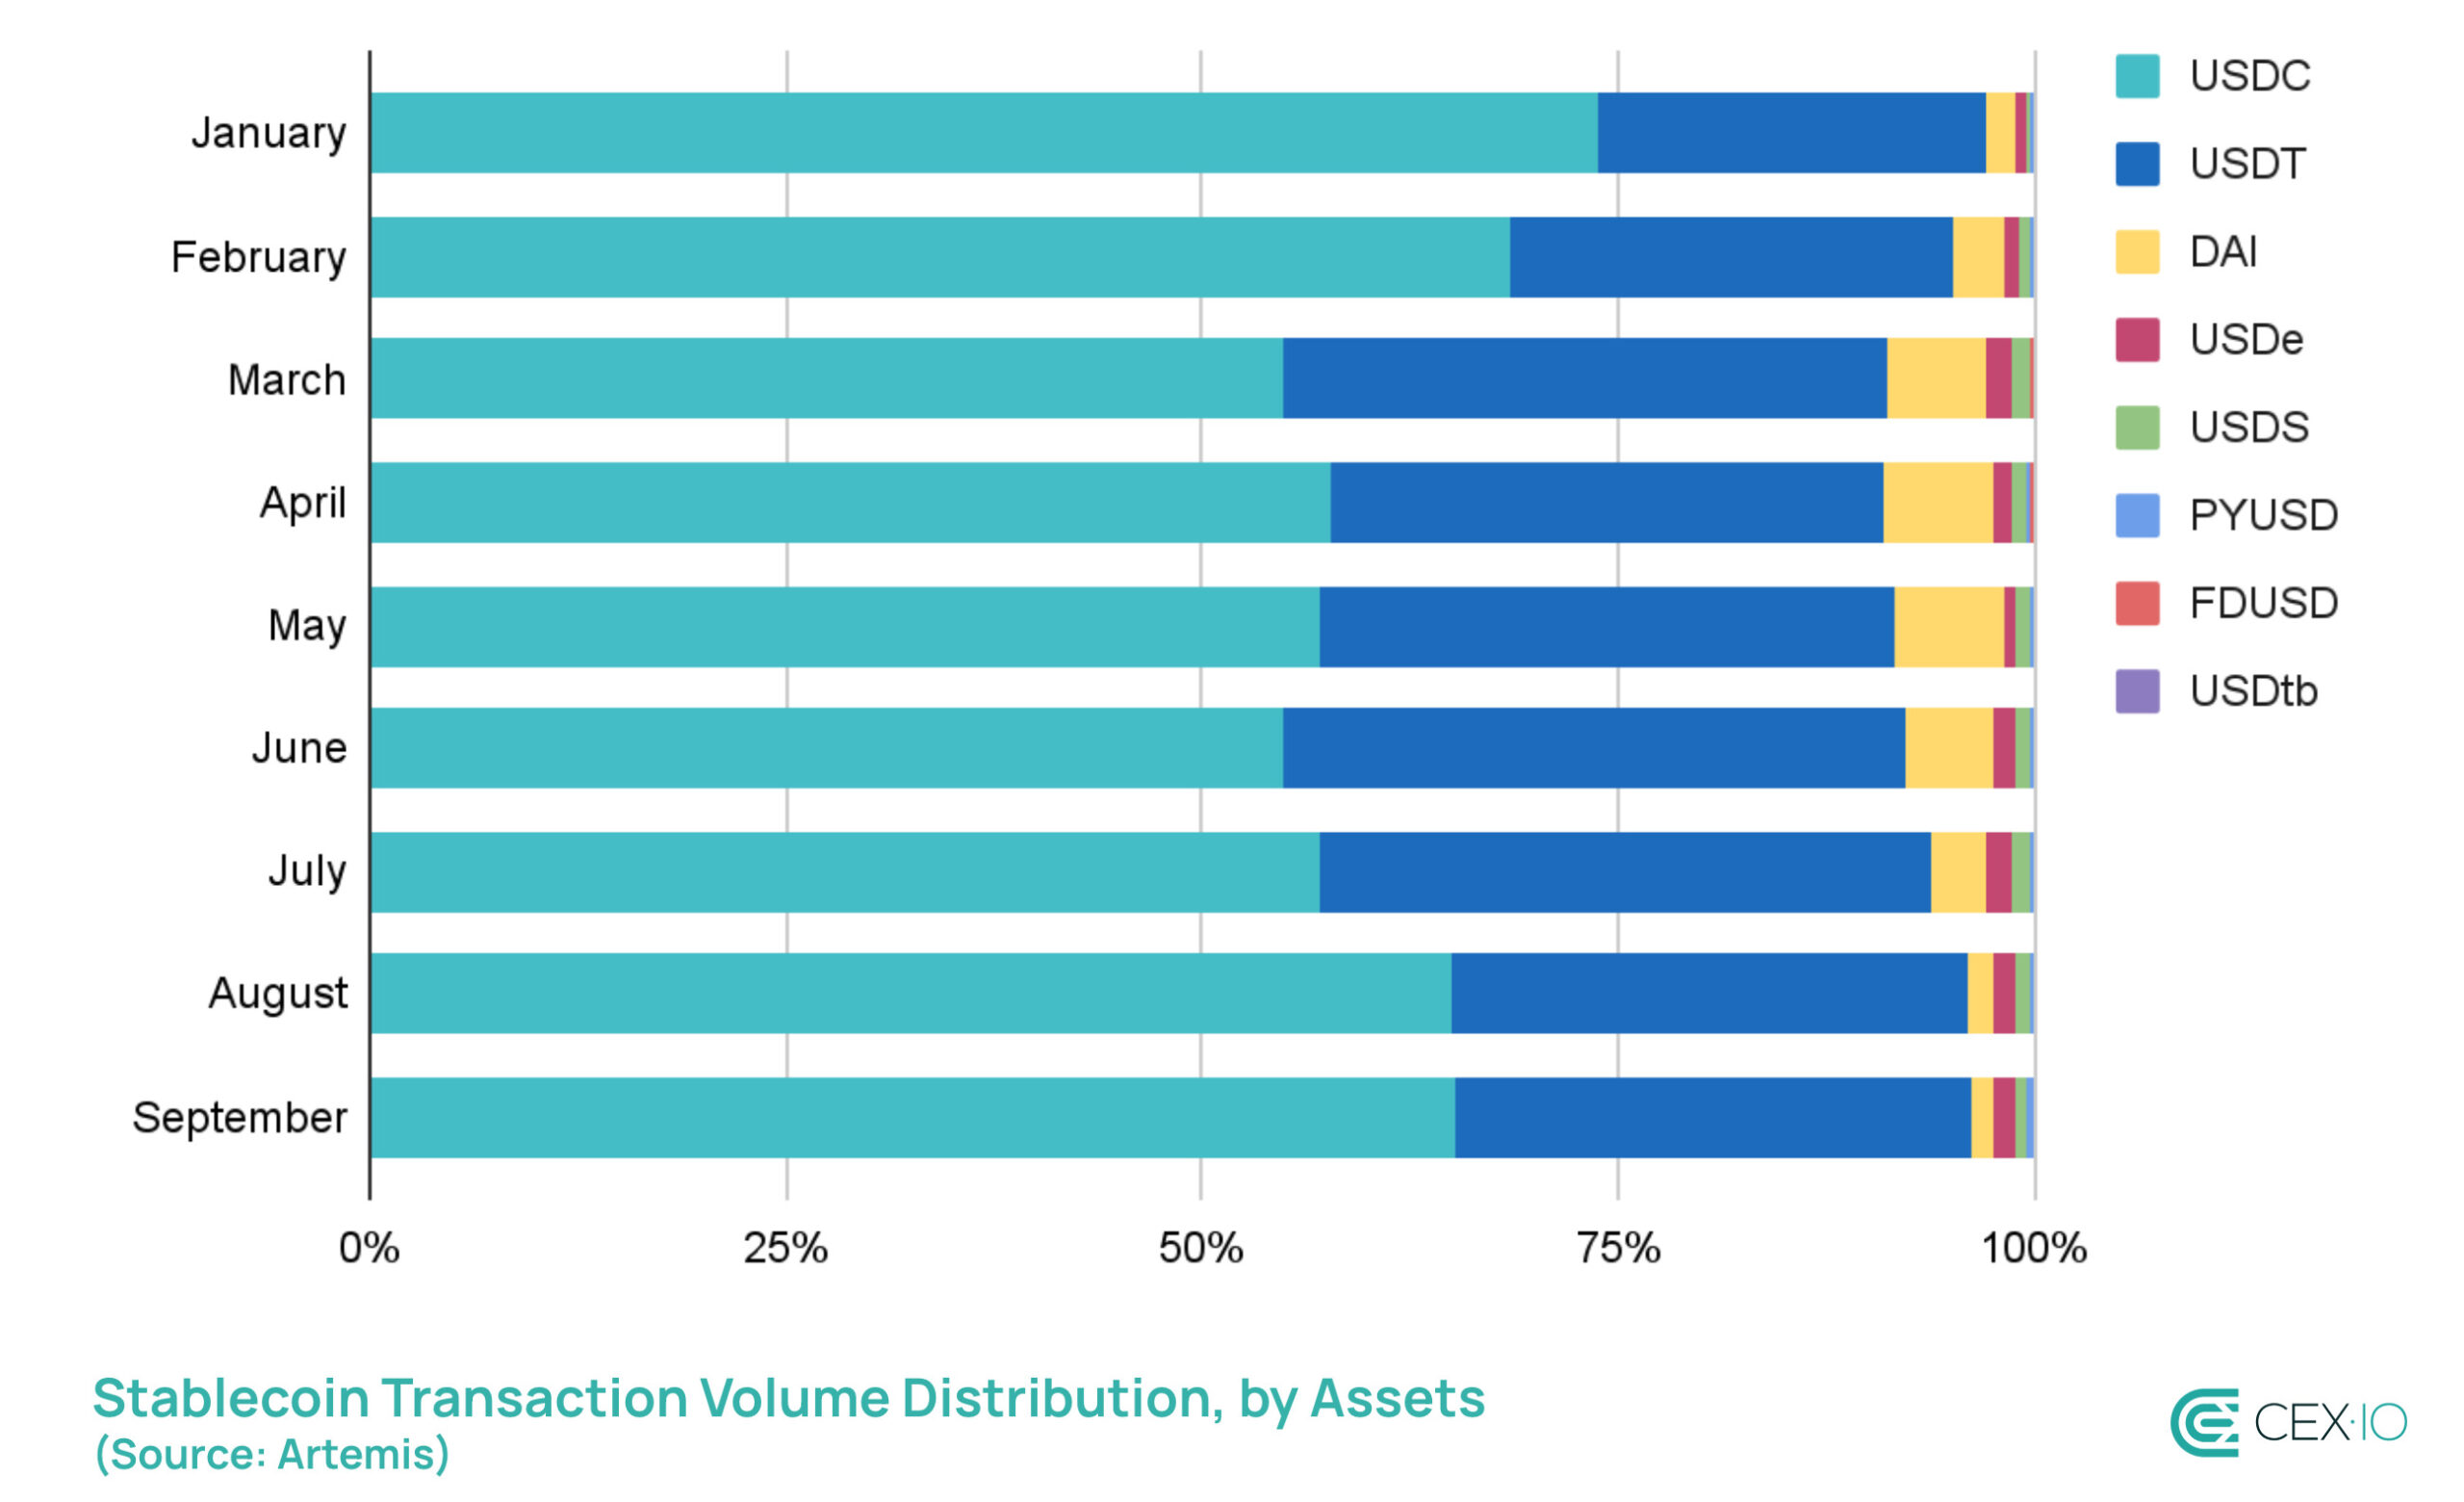
USDC extended its lead, accounting for nearly 63% of total stablecoin transaction volume in Q3, while USDT slipped to 32.5%, down from 35.2% in Q2. However, most of this surge in USDC activity has been fueled by bot activity, which increased from 80% to 83% over the past three months. In turn, USDT has been the main driver of the organic transfers volume increase.
For the industry, this divergence highlights both the efficiency and risks of algorithmic liquidity versus the stickiness of retail and trading adoption.
Among smaller stablecoins, DAI’s share diminished sharply, falling from over 6% of volumes in Q2 to just 2% in Q3. Meanwhile, PayPal’s PYUSD quietly gained ground, tripling its transaction volume and share in Q3, albeit from a small base.
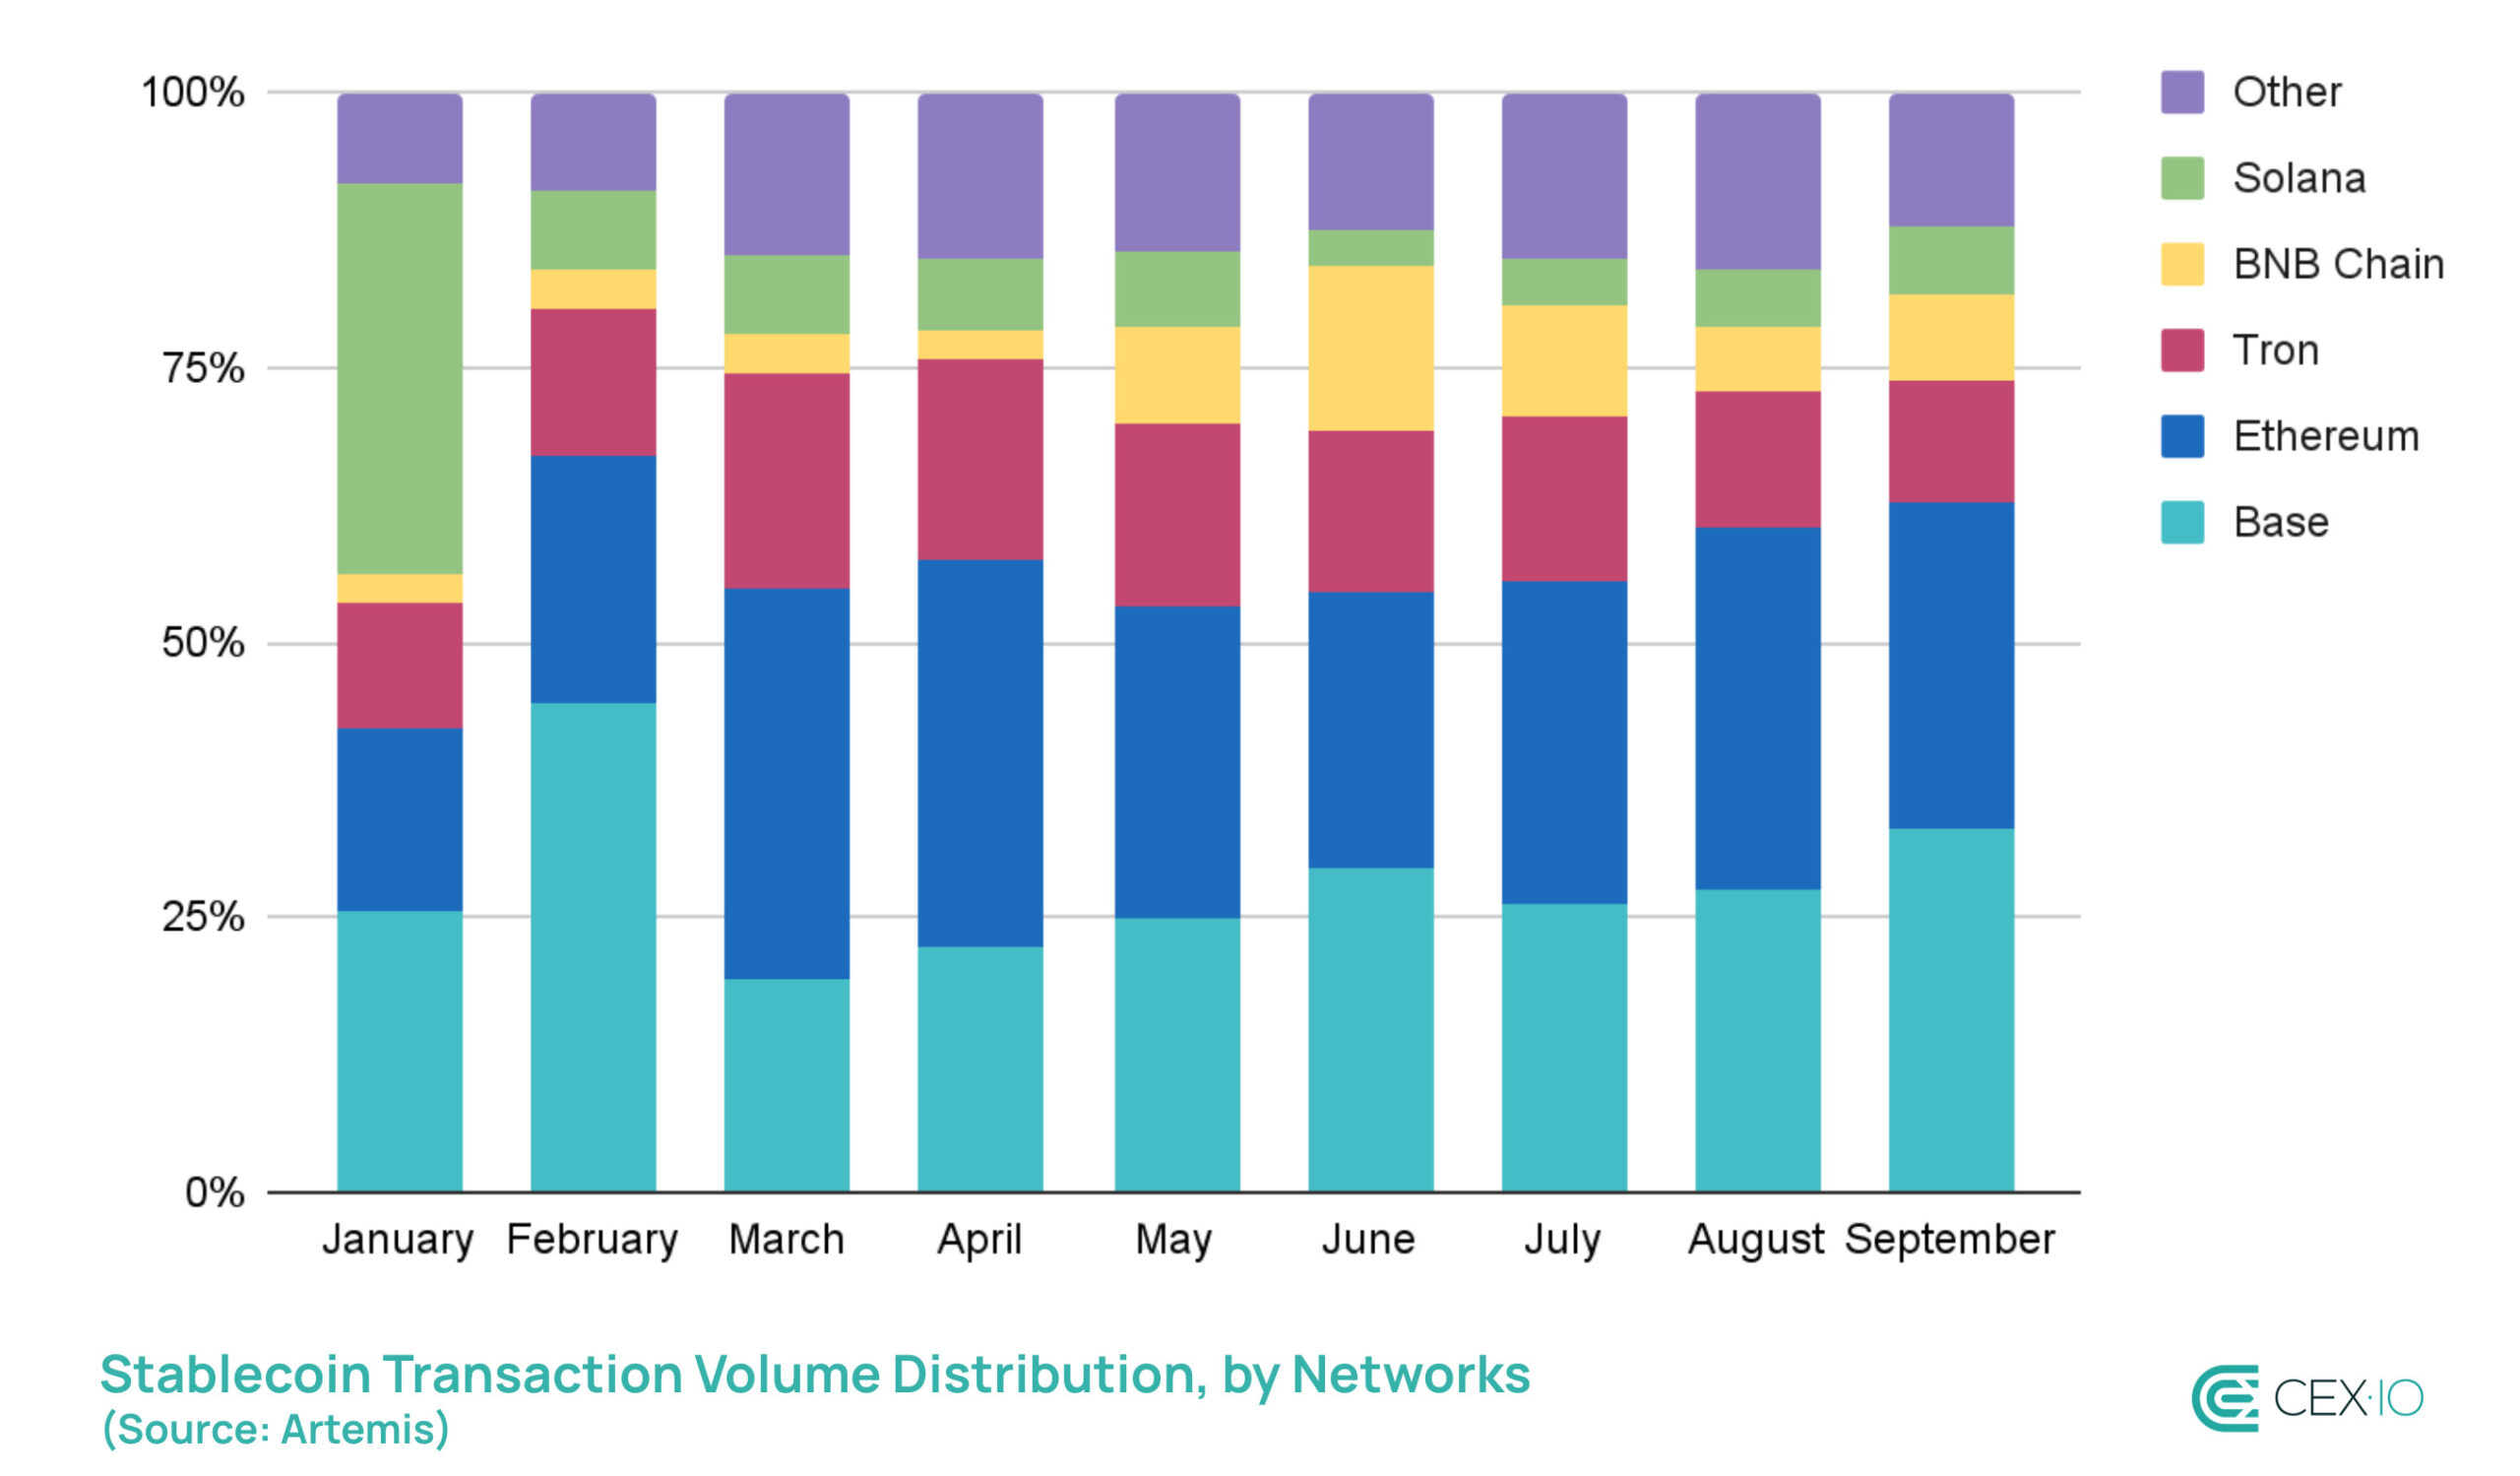
On the network side, Ethereum and Base together processed more than $9 trillion in stablecoin transfers in Q3, increasing their dominance to 60%, up from 55% in Q2. In turn, Tron’s share slipped from 16% to 13%, indicating increased users rotation from the network to the Ethereum ecosystem.
Retail-Sized Transfers
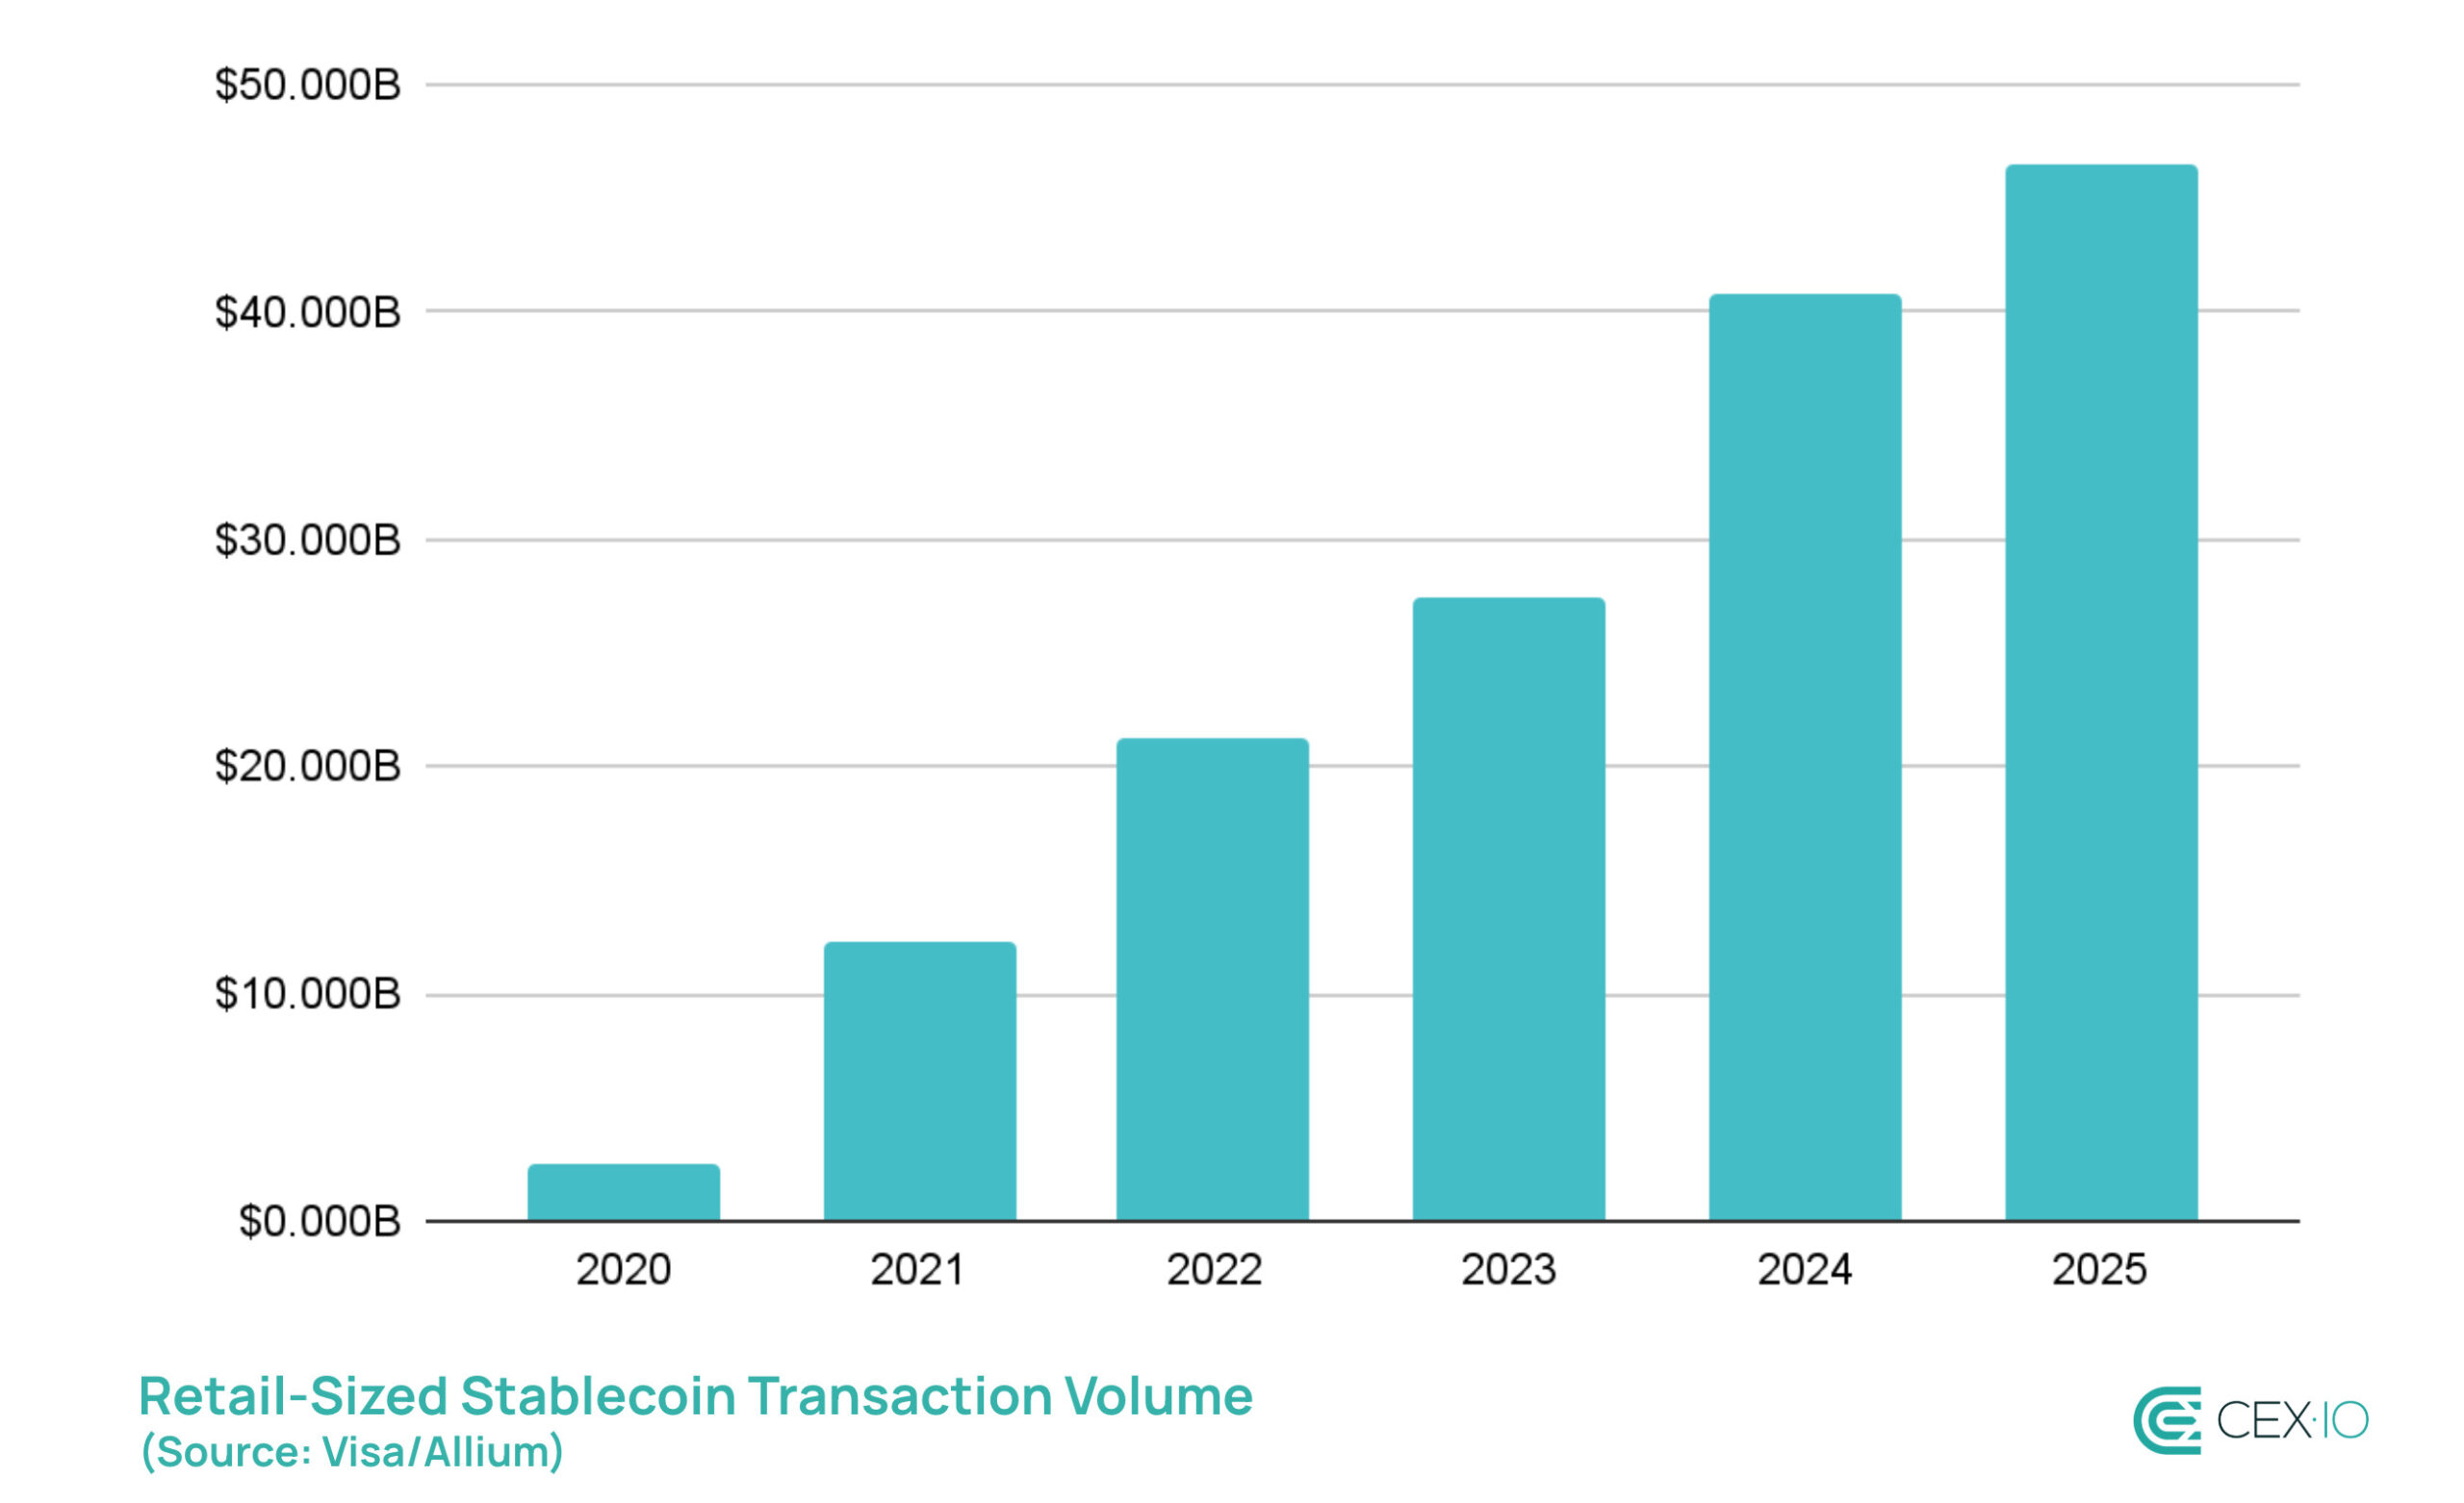
One of the most notable trends in organic stablecoin volume was a consistent increase in retail-sized transfers, or those below $250. In September and Q3, they reached a new all-time high, helping 2025 become the most active year ever for retail stablecoin usage. Considering that Q4 typically keeps the rising momentum, this puts retail-sized stablecoin volumes on track to exceed $60 billion by year’s end.
At the same time, USD is the primary gateway into crypto for users worldwide. As a result, as stablecoin adoption increases and the above-mentioned divergence in use cases between USDT and USDC is becoming more pronounced, this increases the retail demand for asset conversions. However, such switching can introduce friction and additional costs.
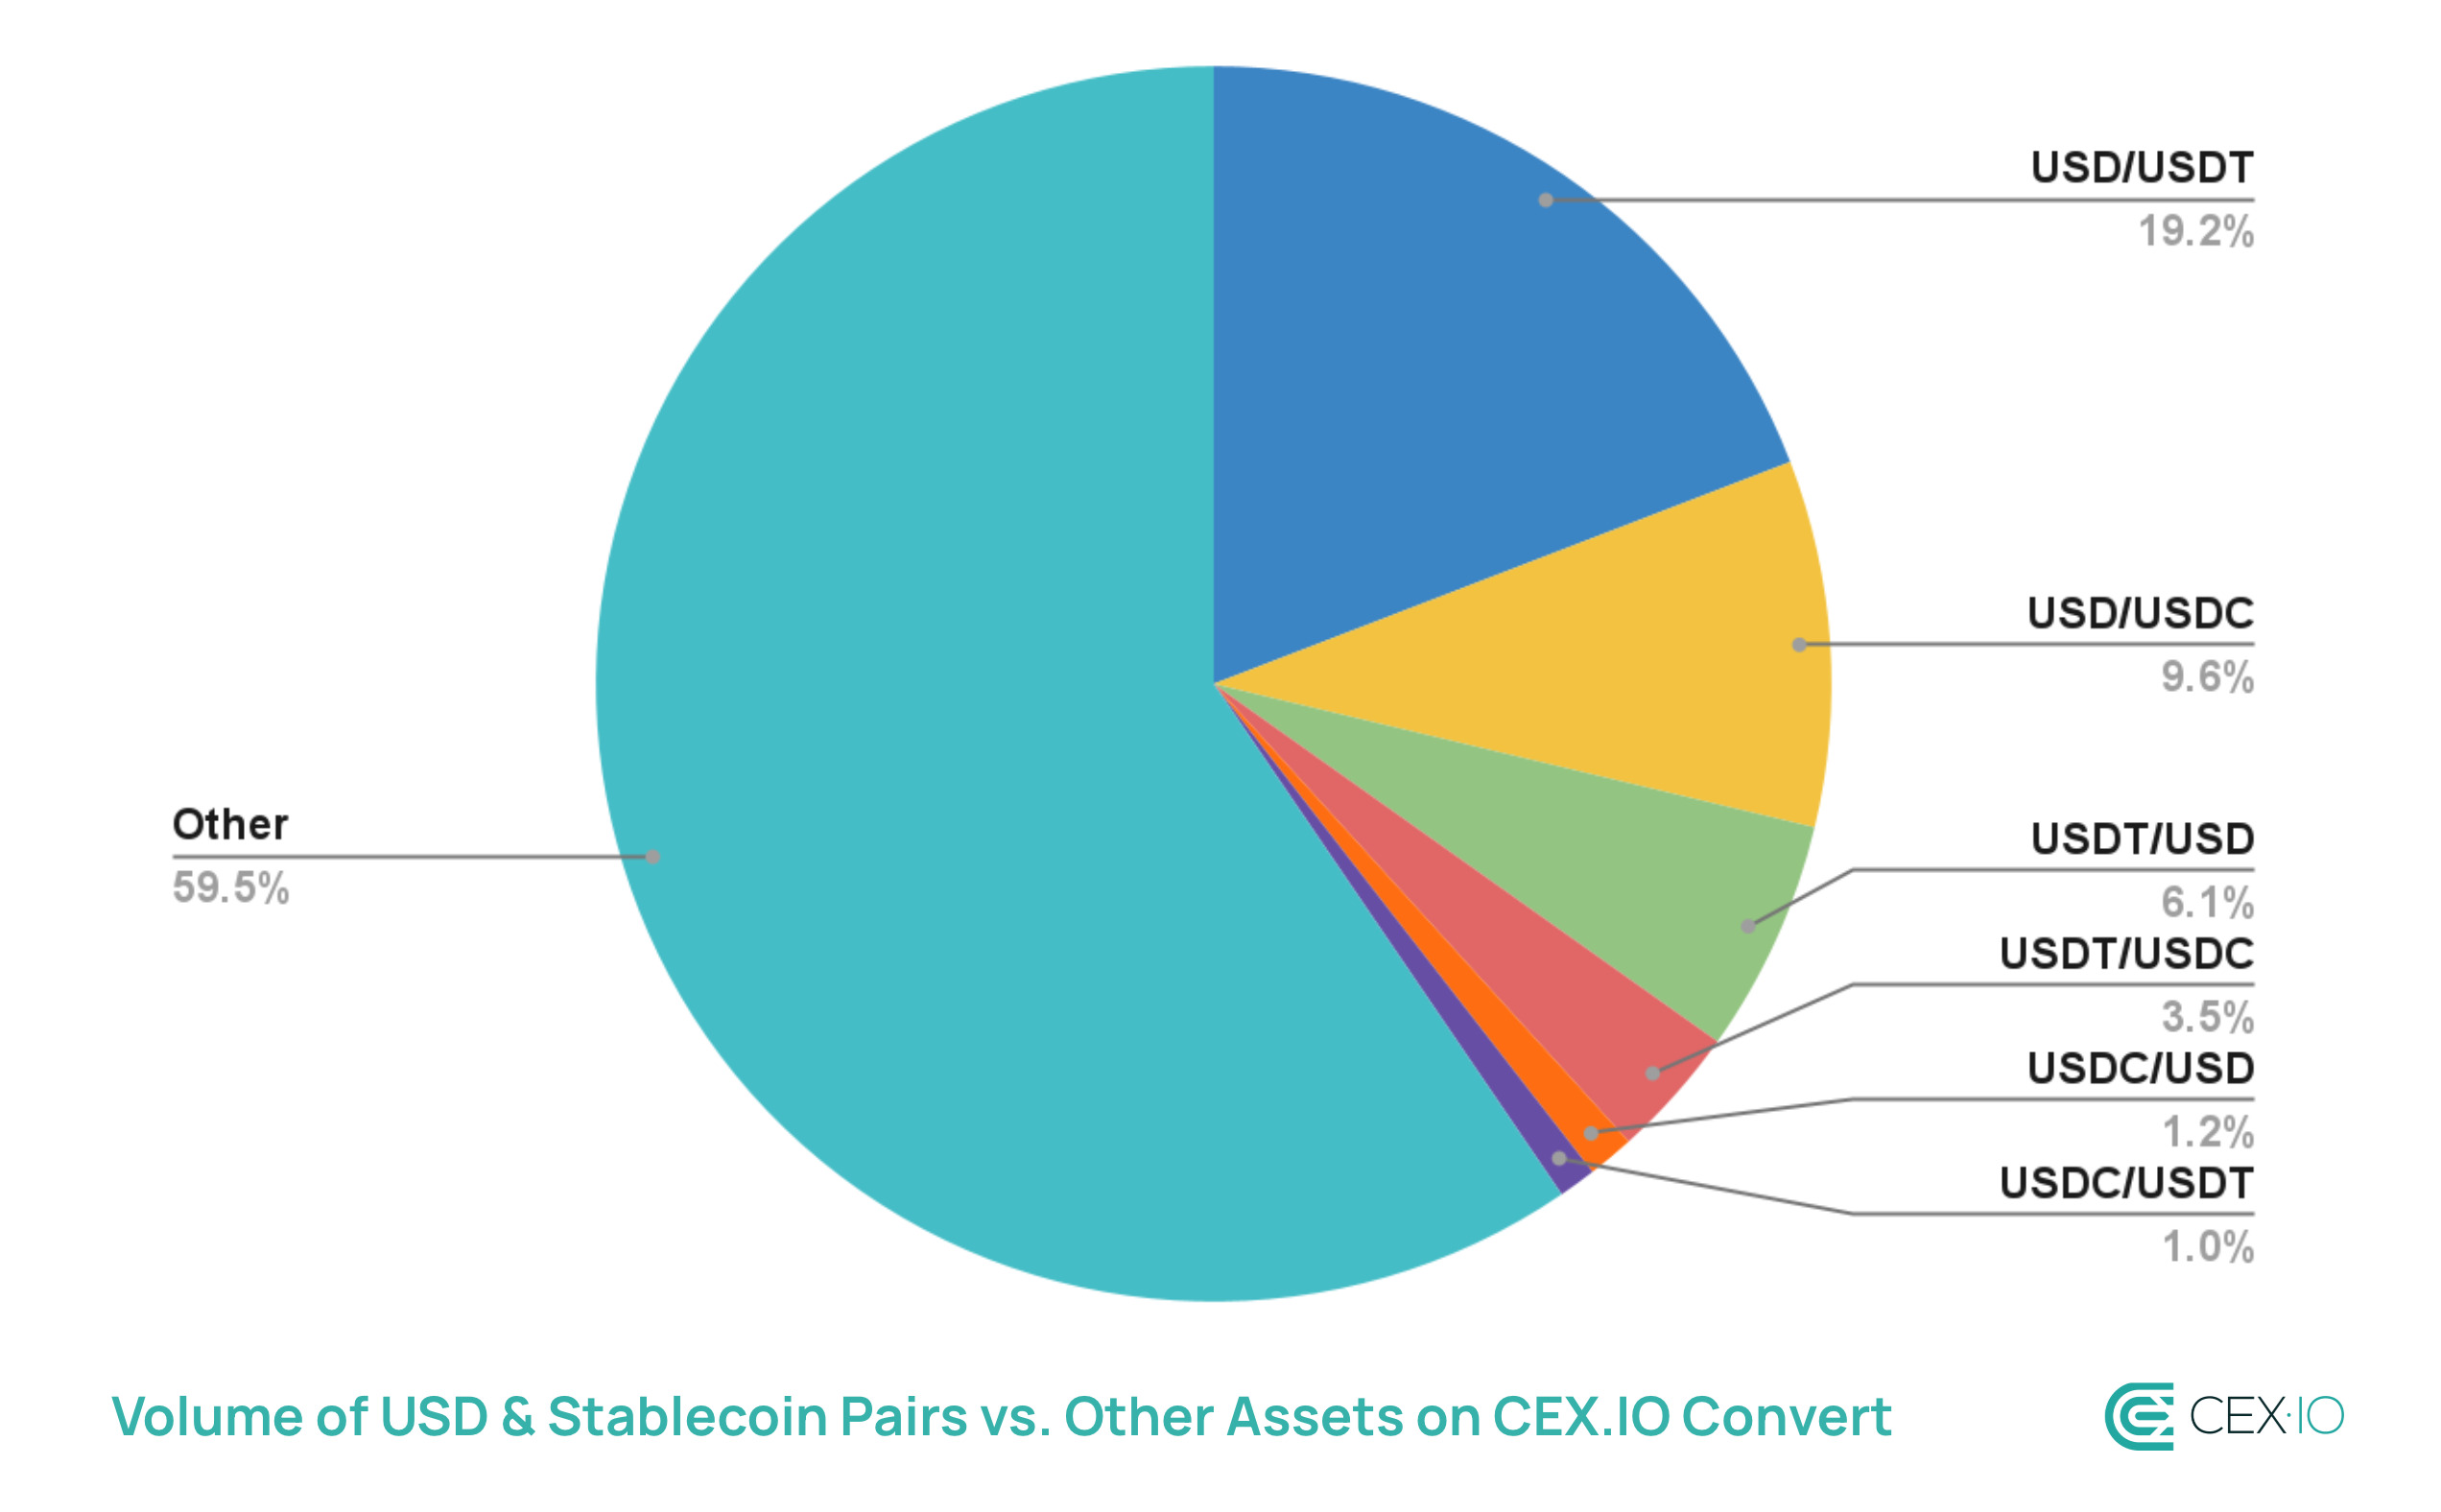
CEX.IO’s internal figures illustrate the scale of this demand: on its Convert terminal, USD remains the most frequently converted asset globally, with its pairs to USDT and USDC alone accounting for about 40% of total volume. That’s why to reduce this barrier, CEX.IO recently introduced zero-fee, 1:1 conversions between USD, USDT, and USDC.
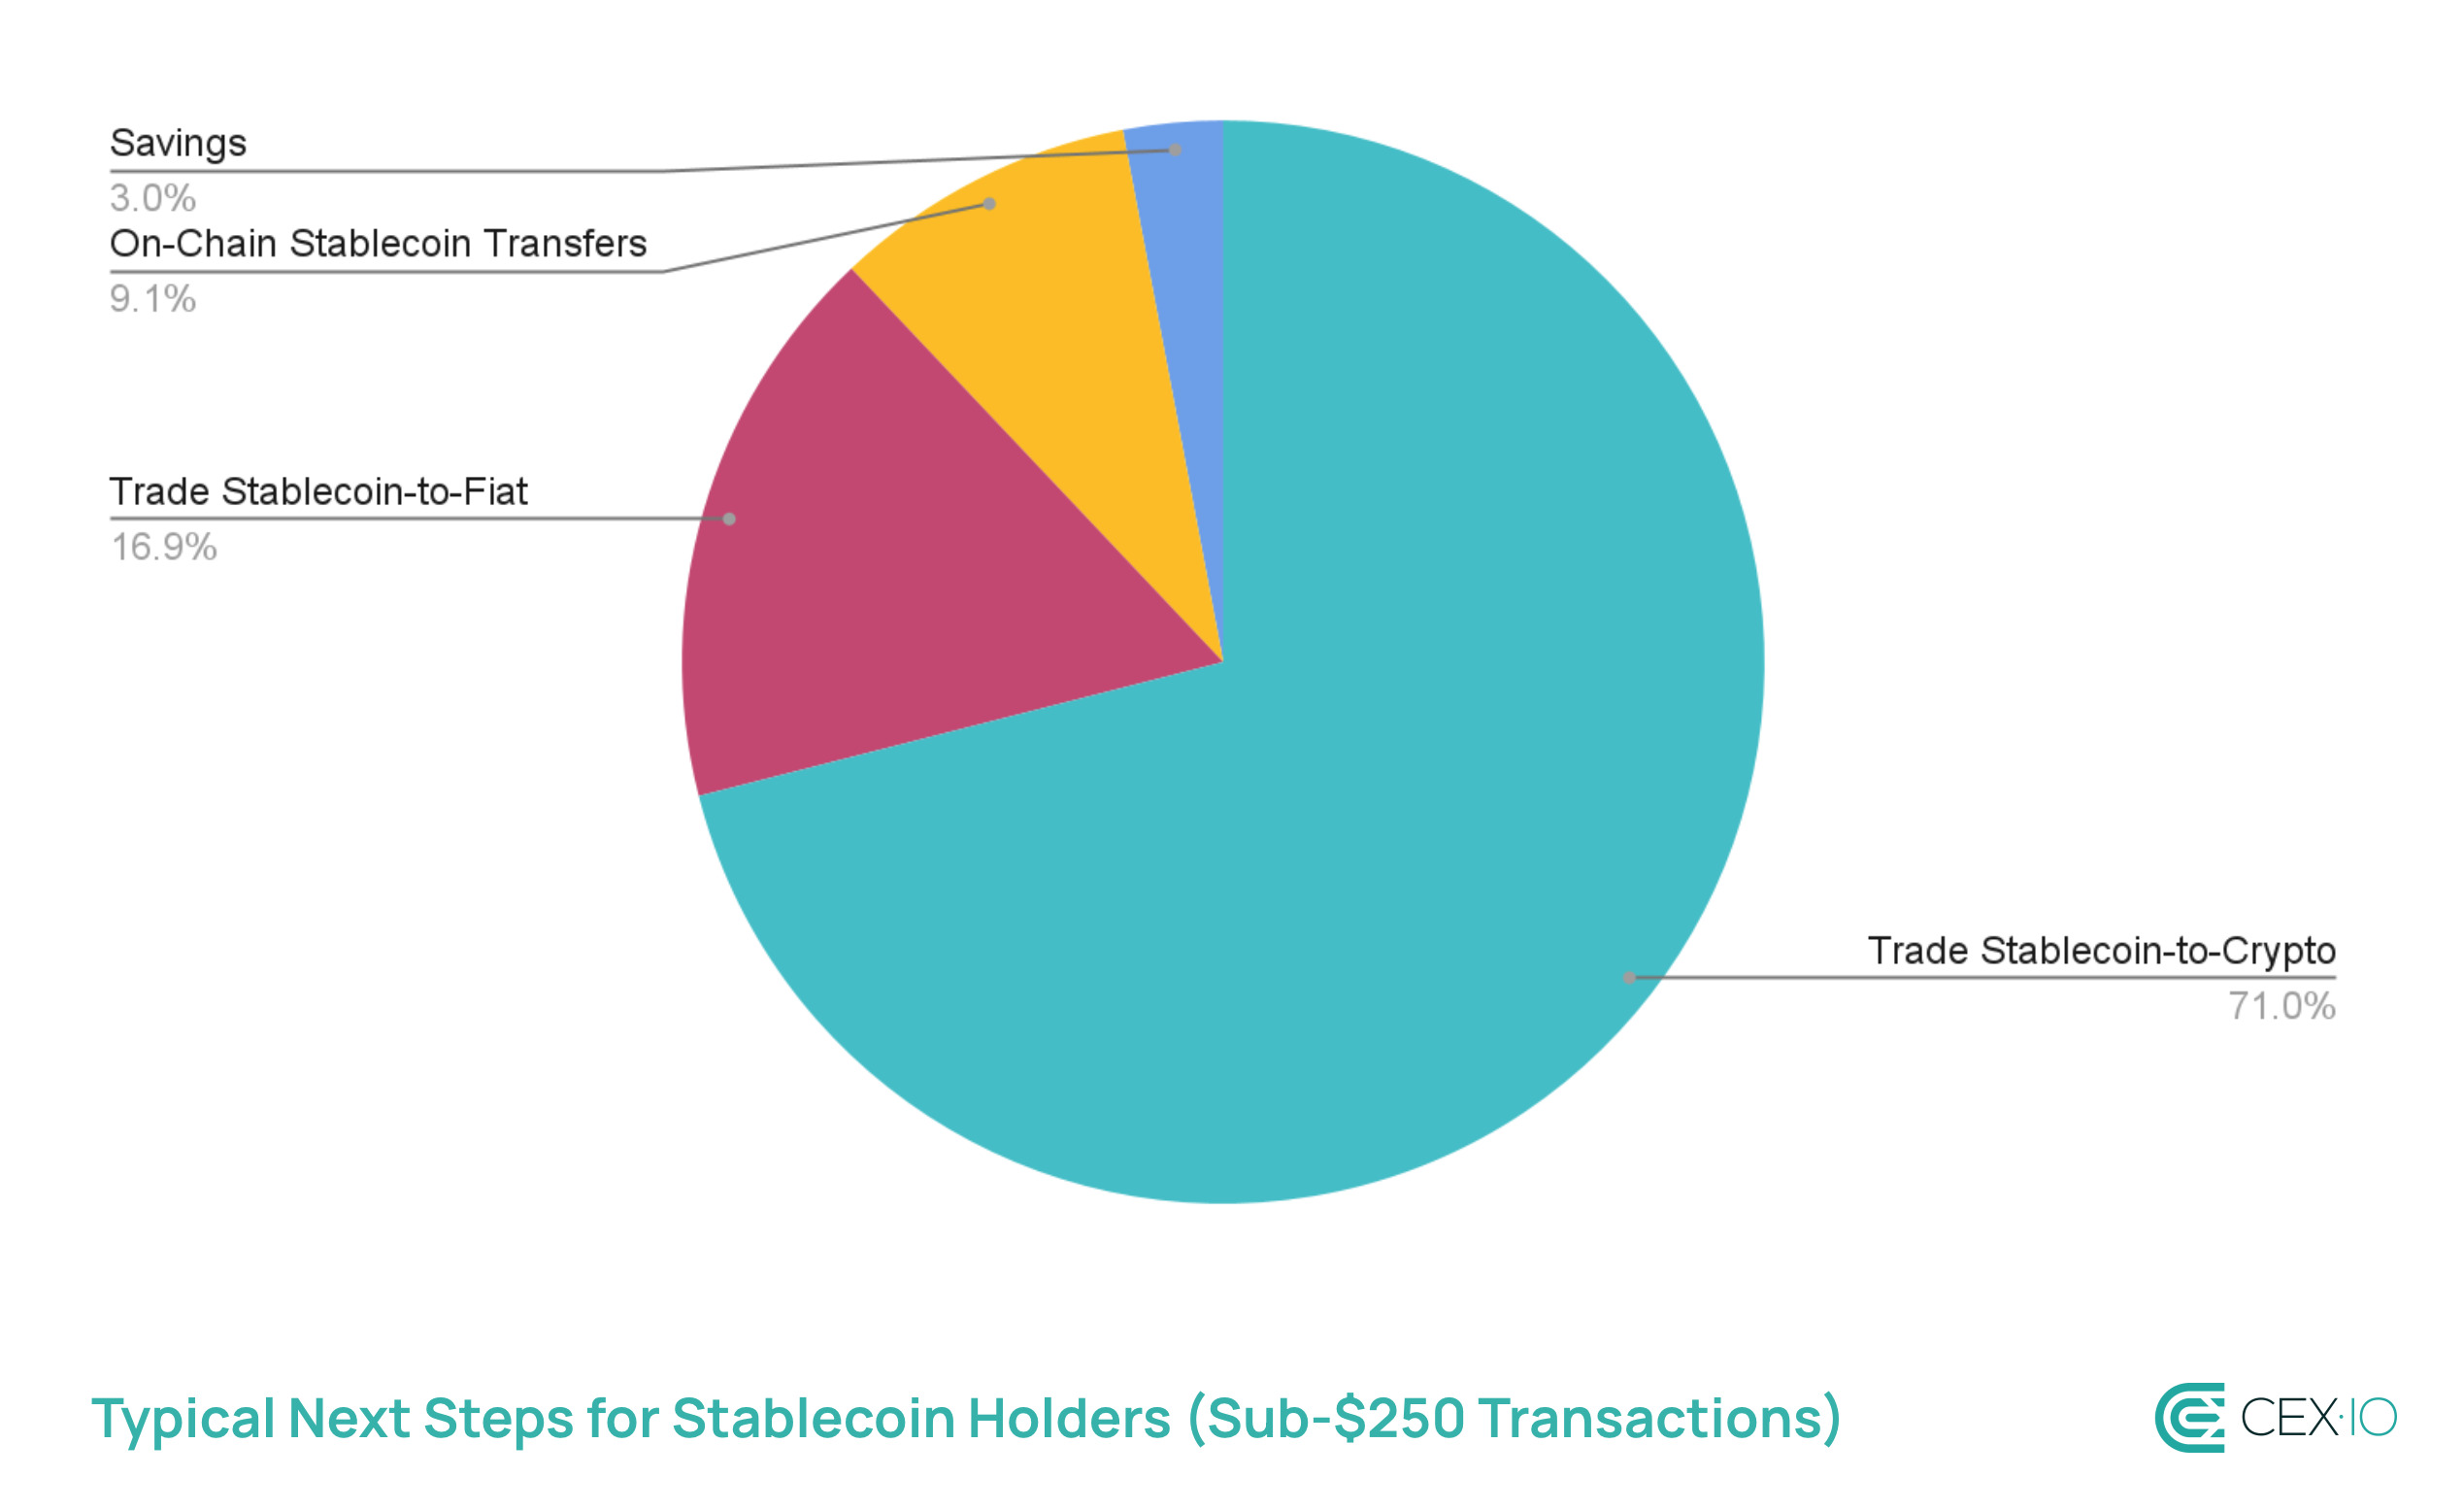
After obtaining stablecoins, CEX.IO internal data shows that trading remains the dominant use case among retail stablecoin users, with nearly 88% of sub-$250 transactions involving such operations.
At the same time, a meaningful share of activity is tied to stablecoin-to-fiat trades and on-chain transfers. Both categories point to stablecoins’ growing role in facilitating payments, remittances, and cashing out earnings. Finally, a smaller but steady portion of users engage in savings products, reflecting the appeal of yield-generation and value preservation.
While still a minority of overall transactions, non-trading activity saw an over 15% increase in 2025, highlighting that stablecoin adoption is gradually expanding into functions beyond trading.
Conclusion
Q3 confirmed that stablecoins are no longer just a supporting tool for crypto markets — they are becoming the core of settlement and even a gateway for retail adoption. Looking ahead to Q4, this momentum is likely to continue, as stablecoin usage has historically climbed in the final quarter for five years in a row. The bigger question now is whether growth will stay concentrated in a few dominant assets and networks, or if signs of broader diversification will emerge. For now, Q3 highlighted an even stronger tilt toward USDT and USDC, alongside Ethereum’s ecosystem, and these trends show no indication of slowing.
Source
The data used for this research consists of publicly available information from DeFiLlama, Visa/Allium, Artemis, Coingecko, Blockworks Research, and GrowThePie. Retail-sized transactions are defined as adjusted (non-bot) transactions that are less than $250, according to Visa’s methodology. In turn, CEX.IO’s internal data was based on the same sample of 3,000 active users to preserve consistency. The observation period for this study was focused on Q3 and 2025 year-to-date performance, with data points ending September 30, 2025.