With Bitcoin down roughly 45% from its all-time high and derivatives funding deeply negative for weeks, knowing how people feel about the market matters less than knowing what they are actually doing. The Bitcoin Impact Index is built around this question: it tracks which groups of holders are under real financial stress, how severe that stress is, and whether it’s large enough to drive the next move.
It draws from three blocks: on-chain holder behaviour (which cohorts are moving coins and at what profit or loss), ETF and derivatives activity (institutional flows, liquidations, funding rates, and liquidation directionality), and exchange-level liquidity (BTC inflows, stablecoin flows, and realised loss density). The index is updated weekly, on a scale of 0 to 100, with the following bands:
- Normal Rotation (0–24) — routine profit-taking, no structural shift.
- Elevated Repositioning (25–49) — meaningful cohort shifts, limited institutional stress.
- High Impact (50–74) — LTH and STH both under pressure, ETF/derivatives de-risking.
- Critical Impact (75–100) — LTH capitulation, large ETF outflows, major liquidations, heavy exchange inflows.
Below are readings for all 10 completed weeks of 2026, followed by what the latest data suggests about the current situation.
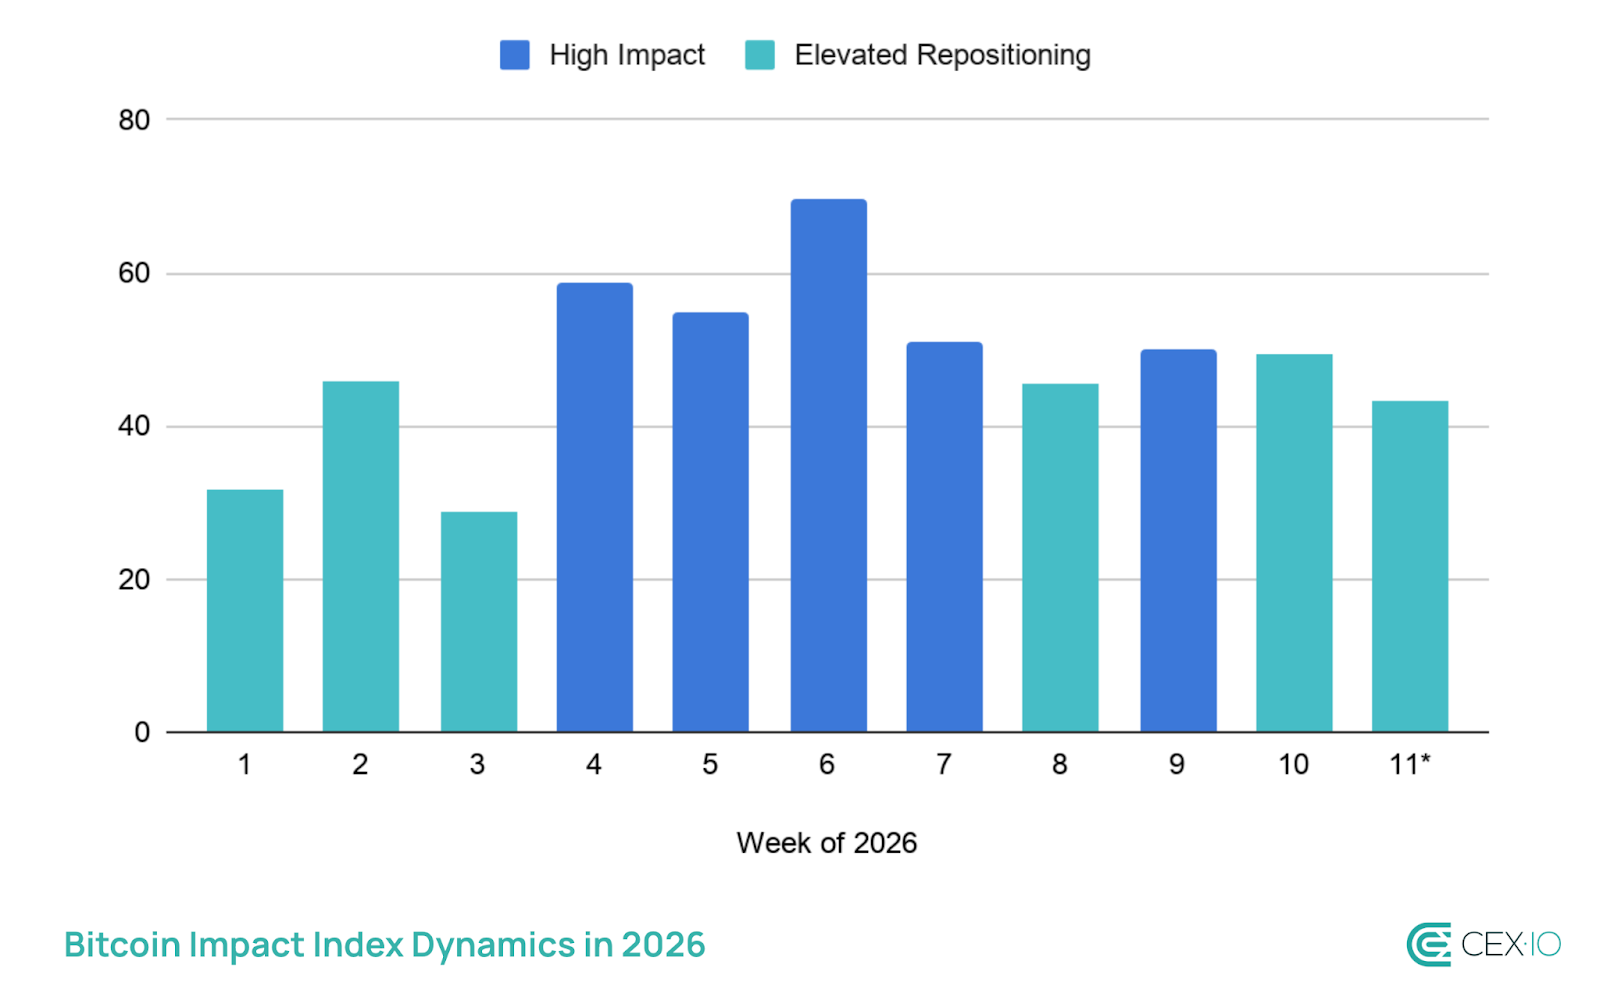
The lowest index reading in 2026 was 28.8 in mid-January, when ETF inflows were strong and holder stress was moving down. A week later, a sharp selloff began, which illustrates an important point about how to read the index. The headline score reflects what already happened, but the signals inside it can indicate where pressure is building before it fully shows up in price. The highest reading was 69.7 in early February, when long-term holders were selling at a loss, ETFs were bleeding capital, and liquidations peaked. Current readings are sitting roughly in the middle of that range.
*Note: Week 11 figures are partial because the week has not yet ended.
Week 11 (March 9–15): A Fragile Recovery
The index opens the new week at 44.8, continuing in Elevated Repositioning and moving further from the High Impact threshold compared to last week’s 49.4. This continues a broader trend of gradual easing. Although the direction is positive, the improvement is uneven across different parts of the market.
Short-term pressure easing, but long-term holders are the new concern
Short-term holders have scaled back selling at a loss, with their realized P/L ratio recovering close to breakeven. Long-term holders, however, moved in the opposite direction. LTH SOPR dropped to 0.762, the lowest reading in three years. Long-term holders typically distribute coins during strong rallies, when they can lock in profits. When they instead sell at a loss, it usually reflects weaker conviction in further upside.
At the same time, the short-term holder picture can change quickly. Last week, as Bitcoin approached $74,000, STH SOPR briefly reached 1, and many short-term holders used that moment to exit positions at breakeven rather than hold for further gains. Now the market is facing a similar test again. With STH SOPR back to 1 and Bitcoin trading close to $70,000, the key question is whether short-term holders will treat this level as another exit opportunity. If they do, it would suggest that confidence in a sustained recovery remains limited.
Liquidity signals send a mixed message
Despite the improvement in short-term holder behaviour, the liquidity picture moved sharply in the wrong direction. Stablecoin flows to exchanges turned deeply negative at –$187.9M daily average, reversing the positive readings of the past two weeks. Exchange BTC inflows stayed low, which is a positive, but the stablecoin reversal suggests that the buyer interest seen in early March has not yet turned into consistent accumulation.
Derivatives positioning remains deeply negative
Funding rates are still negative at -0.0044, meaning leveraged traders continue to pay a premium to hold short positions. This signal has now persisted for over a month without a decisive resolution, and this week brought no meaningful change in either direction. The divergence between improving spot conditions and persistently bearish derivatives positioning remains the defining unresolved tension in the market.
However, it is worth putting this in context. Although today’s derivatives positioning looks similar to early February, the most intense period in 2026, the spot market stress is far lower. That divergence historically preceded sharp moves in either direction. Episodes of extreme negative funding without corresponding spot deterioration have sometimes resolved as short squeezes, where shorts are forced to cover and price moves sharply higher. But that outcome requires sustained spot buying to hold firm, which the stablecoin data does not yet confirm.
What could happen next
At this point, continued price decline or sideways movement is the more likely outcome. The key thing to watch is whether short-term holders sell again the moment they break even, just like they did near $74,000 last week. If that happens again, it means every price bounce is being used as an exit opportunity, not a reason to hold. Add deteriorating long-term holder conviction, the stablecoin drain, and persistently negative funding rates, and the pressure is pointing firmly downward.
For the picture to genuinely improve, long-term holder SOPR would need to stop falling and recover back above 1, confirming that veteran sellers are exhausting rather than accelerating. Stablecoin inflows would need to return in a sustained way, and short-term holders would need to hold through breakeven rather than selling into it. Right now, none of those conditions are in place. Until they are, any price recovery is more likely to stall than to stick.
The web content provided by CEX.IO is for educational purposes only. The information and tools provided neither are, nor should be construed as, an offer, or a solicitation of an offer, or a recommendation, to buy, sell or hold any digital asset or to open a particular account or engage in any specific investment strategy. Digital asset markets are highly volatile and can lead to loss of funds.
The availability of the products, features, and services on the CEX.IO platform is subject to jurisdictional limitations. To understand what products and services are available in your region, please see our list of supported countries and territories. This page includes additional links to information about individual products, and their accessibility.