
Signal of the week: Bitcoin’s 7-day average realized losses climbed to $1.03 billion, the highest level since early June. Short-term holders drove most of the selling: their realized profit/loss ratio fell to −0.89 on a weekly average, also the lowest reading since early June. In June, a similar spike in losses came about three weeks before Bitcoin set its 2026 closing low near $58,400.
Bitcoin fell 13% last week and closed at $65,243, its lowest weekly close since mid-August. The price lost the 200-week SMA near $67,900 on November 14 and posted its sixth straight weekly decline. A hotter-than-expected October CPI print raised the odds of a Fed rate hike in December and added macro pressure. Short-term holders, ETF investors, and leveraged longs all took losses at the same time, so the BII climbed to 70.9, its highest reading since early June.
About the Bitcoin Impact Index
The Bitcoin Impact Index measures which groups of Bitcoin holders face financial stress, how severe that stress is, and whether it can shake confidence in the market’s direction. The index merges on-chain holder behavior, ETF and derivatives activity, and exchange liquidity flows into one weekly score from 0 to 100. It excludes social media and volume data, so the score tracks what market participants do with their coins and capital.
Score bands:
- Normal Rotation (0–24) — routine profit-taking with no structural change
- Elevated Repositioning (25–49) — specific groups change positions, and pressure stays uneven across the market
- High Impact (50–74) — broad stress hits multiple holder groups and institutional flows at the same time
- Critical Impact (75–100) — full capitulation: LTH losses, large ETF outflows, major liquidations, and heavy exchange inflows at once
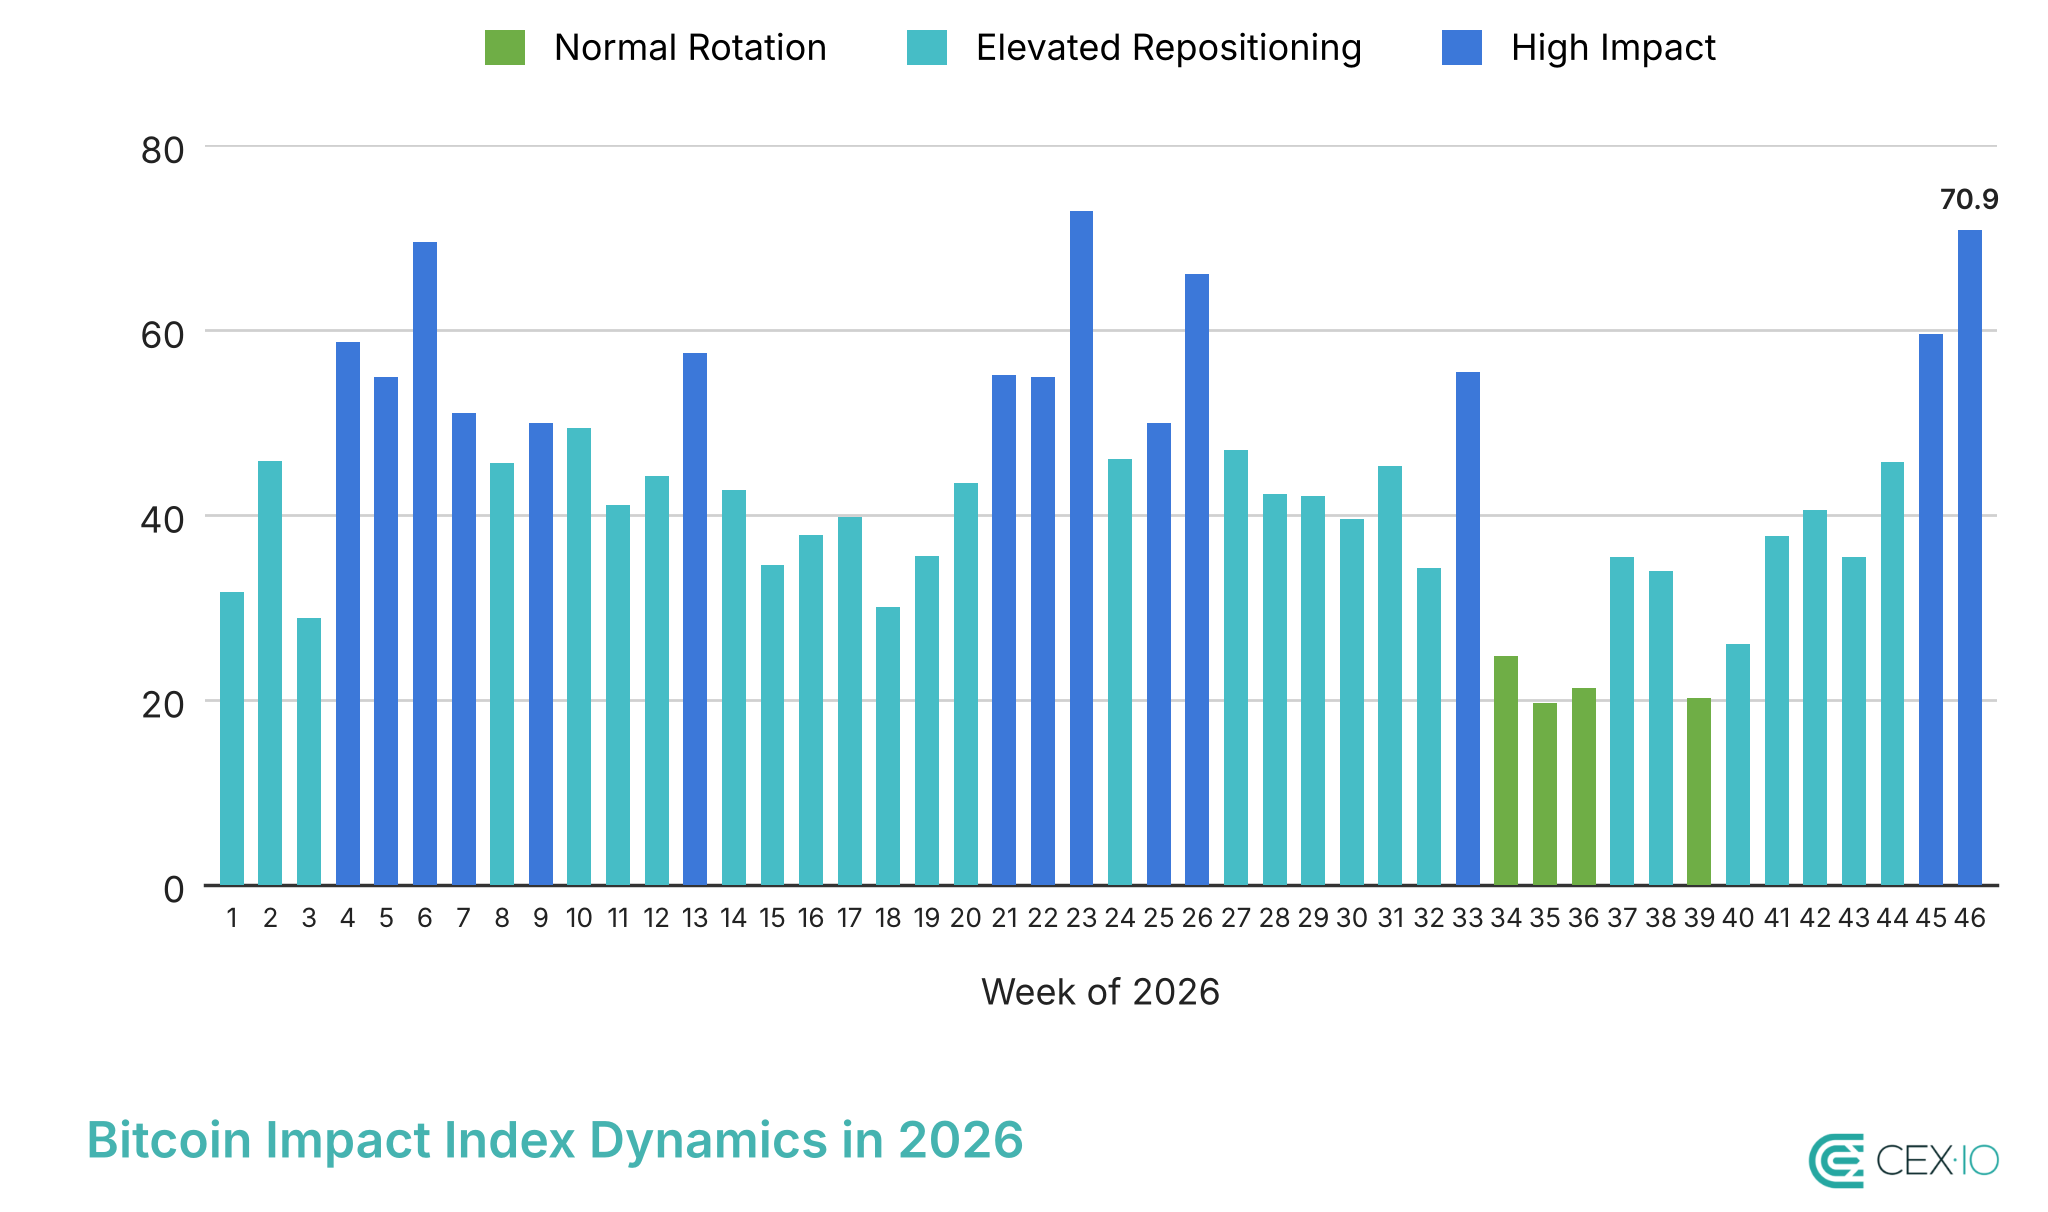
Week 46 (November 9–15): BII 70.9 — High Impact
Negative signals: short-term holders sell at the deepest losses since June
Short-term holders carried most of the stress. Their realized profit/loss ratio dropped to −0.89 on a weekly average, down from −0.29 a week earlier. This is the lowest reading since the first week of June. STH-SOPR averaged 0.982, so recent buyers sold their coins at an average loss of nearly 2%.
Bitcoin’s 7-day average realized losses reached $1.03 billion on November 15, almost double the $557 million of a week earlier. Around 77% of short-term holder supply now sits at a loss, the highest share since mid-August. The short-term holder cost basis sits near $74,700, about 14% above the current price. Many recent buyers may use any recovery toward that level to exit at break-even.
Long-term holders also cut their exposure. Their supply fell by about 69,000 BTC to 16.24 million BTC, the seventh straight weekly decline. LTH-SOPR averaged 0.966, which means the long-term holders who moved coins last week sold them below their purchase price on average.
Negative signals: ETF outflows and long liquidations drive institutional stress
Spot Bitcoin ETFs recorded $1.07 billion in net outflows, the second straight week above $1 billion. Every trading day of the week ended with net outflows. Over the last two weeks, ETFs lost $2.35 billion, the largest two-week outflow since late May and early June. As a result, net ETF flows for 2026 now stand at −$1.99 billion.
Forced selling returned to the derivatives market. Average daily long liquidations jumped to $180.6 million, up from $88 million a week earlier and the highest level since early June. Short liquidations averaged only $34.8 million per day, so longs accounted for 84% of all liquidations, the largest share since mid-May. The drop below the 200-week SMA on November 13–14 triggered most of these forced closures.
Funding rates show that the leverage reset remains incomplete. The 7-day average funding rate stayed positive at 0.0092%, so longs still paid shorts to keep their positions open. This remaining long-side leverage can fuel another round of liquidations if the price drops again.
Mixed signals: exchange flows stay calm during the sell-off
Exchange data shows no panic among spot holders. Bitcoin exchange netflows averaged −269 BTC per day, so more coins left exchanges than arrived. Holders did not rush to send their Bitcoin to exchanges during the 13% drop.
Stablecoin flows send a weaker signal. Stablecoin netflows to exchanges stayed negative at −$77 million per day. This is the ninth negative week in the last ten. Fresh buying power keeps leaving exchanges, so the market has less capital ready to absorb selling.
Loss-taking also grew relative to exchange activity. Each dollar of Bitcoin sent to exchanges came with about 43 cents of realized losses, the highest ratio since late July. A week earlier, the ratio stood at 22 cents.
What could happen next?
Bitcoin now trades near $64,000. The 200-week SMA at about $67,900 and the short-term holder cost basis near $74,700 both sit above the price and now act as resistance.
If Bitcoin reclaims $68,000 and holds above the 200-week SMA, recent buyers would face less pressure, and the price could move toward the $74,000–$75,000 zone. ETF flows remain the key confirmation. A return to weekly inflows would show that institutional demand can absorb the selling from short-term and long-term holders.
If the price fails at $68,000, Bitcoin could retest $62,800, the mid-August closing low. Below that level, the June closing low near $58,400 becomes the next major support. The realized price at about $53,700 marks the average cost basis of all circulating Bitcoin and forms the deepest support zone.
Macro events add risk. The Fed meets on December 8–9, and markets now price a high chance of a rate hike. A hawkish decision could extend ETF outflows and keep pressure on Bitcoin into year-end.
The web content provided by CEX.IO is for educational purposes only. The information and tools provided neither are, nor should be construed as, an offer, or a solicitation of an offer, or a recommendation, to buy, sell or hold any digital asset or to open a particular account or engage in any specific investment strategy. Digital asset markets are highly volatile and can lead to loss of funds.
The availability of the products, features, and services on the CEX.IO platform is subject to jurisdictional limitations. To understand what products and services are available in your region, please see our list of supported countries and territories. This page includes additional links to information about individual products, and their accessibility.