
Markets across the board have reduced their exposures as much as they could before the Federal Open Market Committee (FOMC) meeting on May 3-4 which caused uninterrupted sell-offs throughout the entire of April. Bitcoin and most other cryptocurrencies lost their gains from the March rally and now they are back on major long-term support levels with many starting to lose those levels as well.
Although multiple warning signs are emerging for the cryptocurrency market now, it is never wise to time the markets as there can be multiple short squeezes or open interest resets before a big, major move takes place either to the upside or downside.
In this crypto ecosystem update, we provide the latest outlook on the on-chain activities of Bitcoin and Ethereum along with a detailed technical analysis for both. We also share the altcoins to watch based on the recent news and developments.
BITCOIN ANALYSIS
Price Overview (From April 29 Close)
- Last 7-day change: -2.2%
- 7-day low: $37,701.00
- 7-day high: $40,791.20
- Last 30-day change: -15.3%
- 30-day low: $37,701.00
- 30-day high: $47,625.00
Network Overview
- Blocks Mined (7-day): 1,088 blocks
- Average Block Interval (7-day): 560 seconds
- Coins Discovered (7-day): 6,800 BTC
- TX Count (7-day): 1.8 million
- TX Volume (7-day): 44.7 million BTC
- Net Change in Exchange Balance (7-day): -12,865 BTC
- On-Chain Activity:
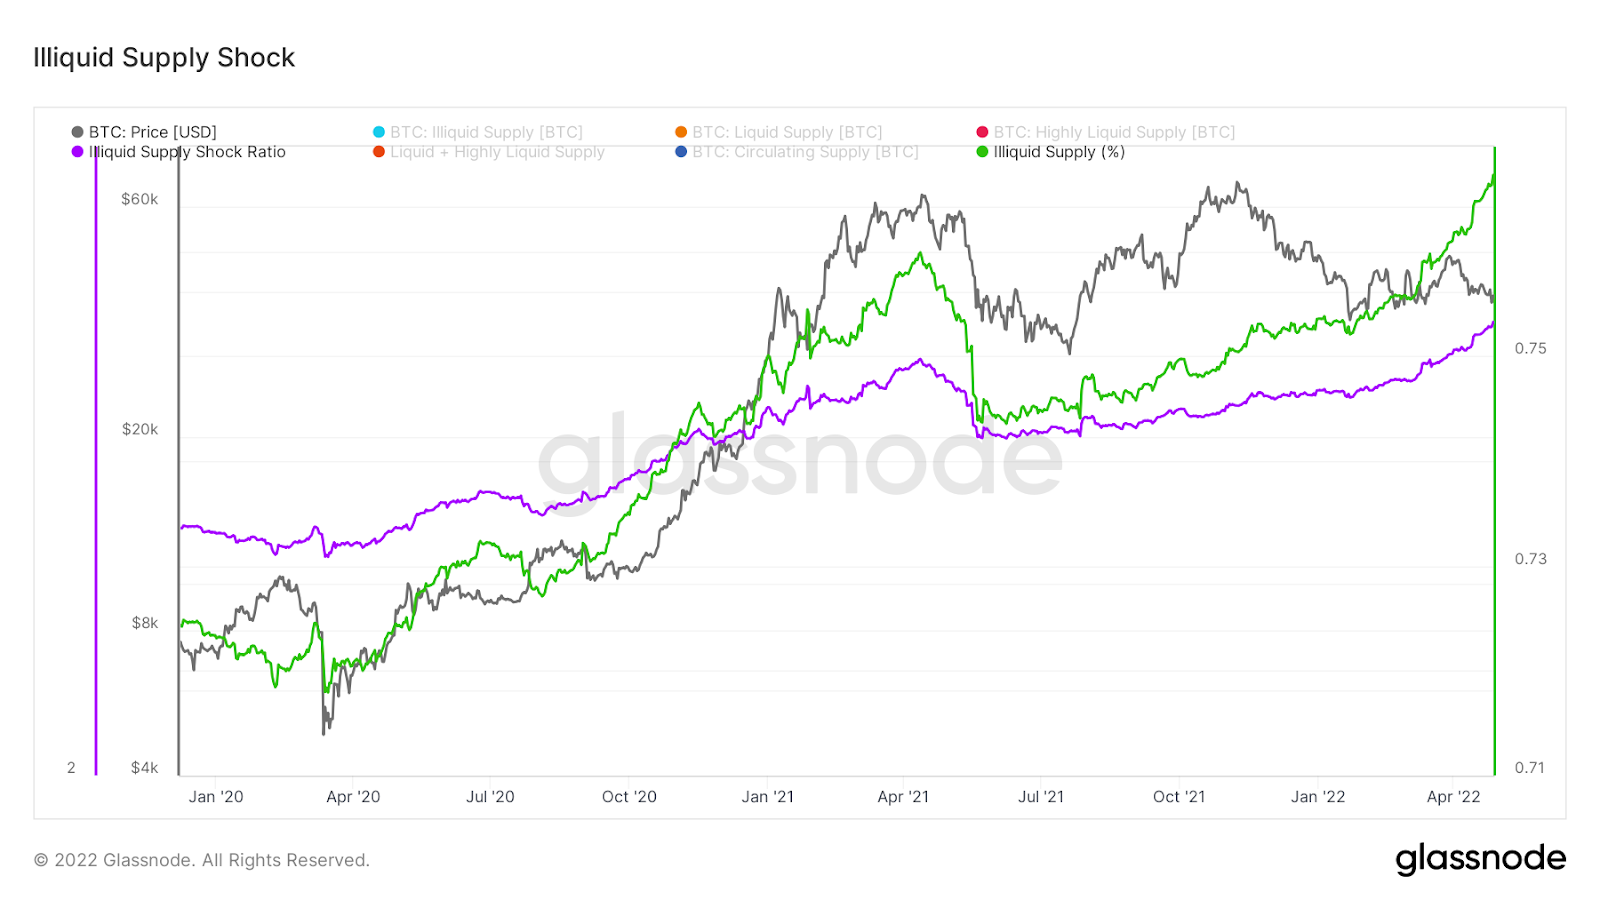
Bitcoin’s price has been choppy and trending downwards over the last month. Headwinds stemming from global financial uncertainty have intensified the sell-off of risk assets across the board. The Nasdaq is down 7.4% over the last 30 days, with FAANG stocks being down 16% on average. Despite the negative price action, illiquid supply continues to mount and trends in network health remain positive.
The divergence between price and illiquid supply is becoming more apparent as bitcoin has been range-bound since the start of the year. Nearly 77% of bitcoin’s circulating supply is deemed to be illiquid, which is a level that hasn’t been observed since late 2017. The price of Bitcoin is down 16.5% since January 1, while the portion of illiquid supply has grown by nearly 2%. Additionally, the portion of supply that hasn’t moved in one or more years has pushed to an all-time high of 64.5%.
Source: Glassnode
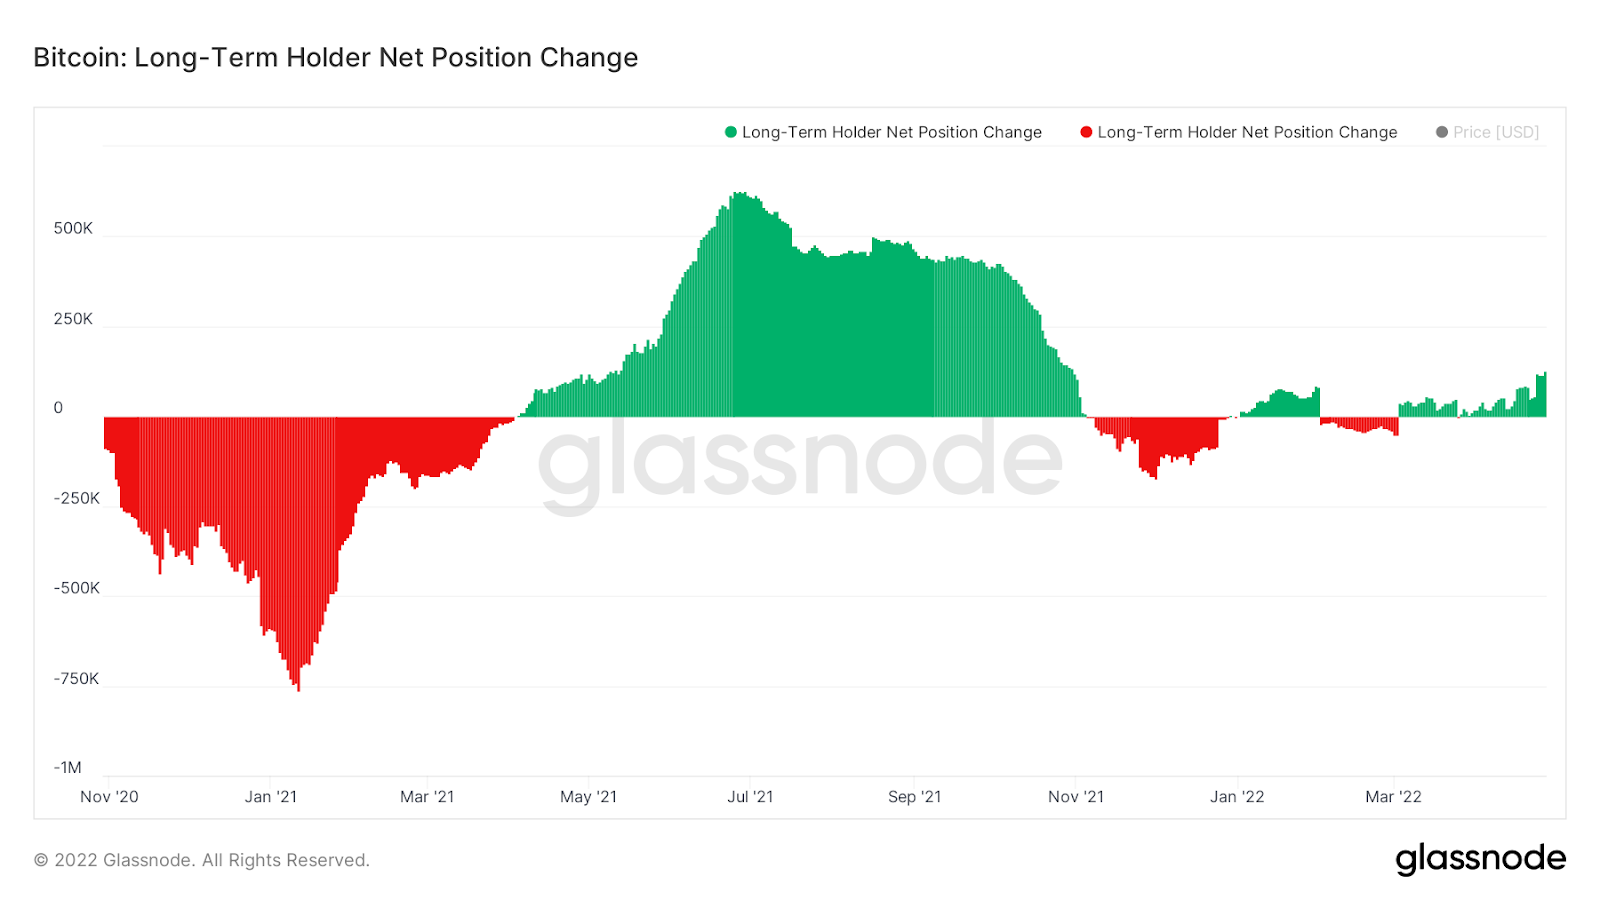
Expanding illiquidity and the stagnation of older coins suggest that coins are being distributed to hodlers as negative price action has escalated. This notion is present in long-term holder (LTH) balances. Since the turn of the new year, LTHs have primarily been adding to their holdings. Though they aren’t adding to their positions as aggressively as they had after the sell-off in Spring 2021, the current trend in LTH accumulation is a positive signal. LTH supply is currently sitting level with the previous ATH achieved in October 2021 of 13.52 million BTC.
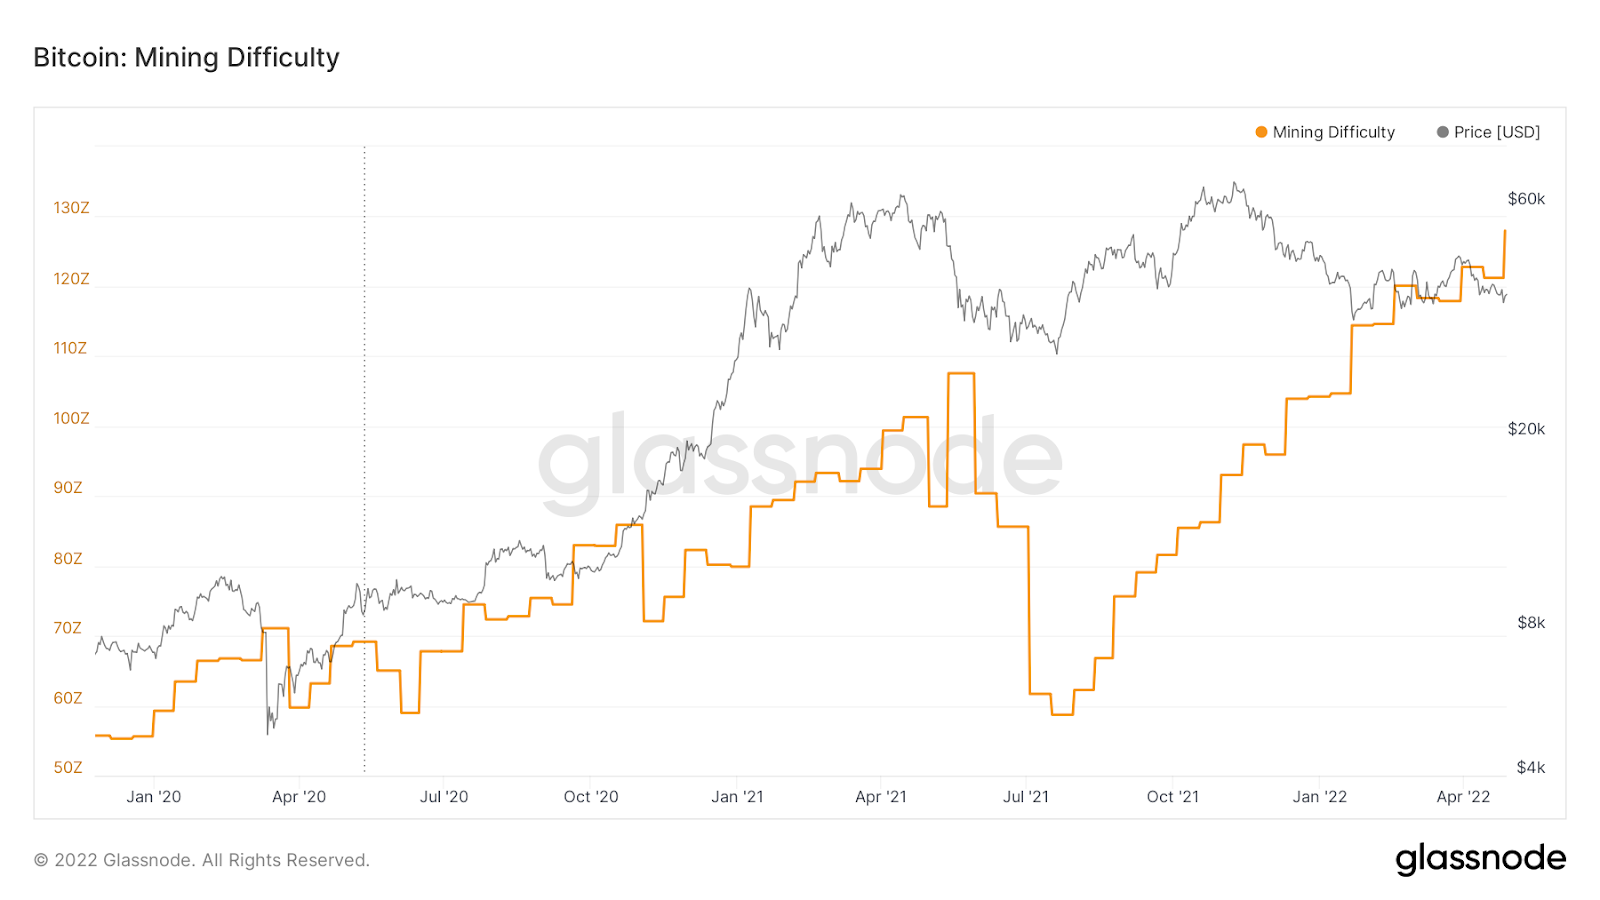
Growing illiquidity and LTH accumulation are healthy signs on the network level. The 14-day simple moving average in hash power broke out to a new ATH of 213.7 Eh/s. Miners have been piling into the network since the Great Mining Migration of Spring 2021. Western capital markets, specifically the United States, have played an integral role in this explosive rebound. It gave miners an outlet to raise hundreds of millions of dollars to start and expand their operations.
More recently, Riot Blockchain (a publicly-traded Bitcoin mining group based in the United States) announced the development of a one-gigawatt mining facility in Navarro County Texas. There are many Bitcoin miners in Texas. Political support, along with renewable and cheap energy sources have attracted the biggest miners in North America to the state. Riot’s facility, which will be completed by Q3 2023, will bring 250 new jobs to Texas and make the company the largest known mining operation in the world.
Riot’s efforts, along with many others around the world, will likely take time to manifest themselves on-chain. Growth in hash power will be a key metric to follow as new operations come online.
The steep growth in hash brought a new all-time high in mining difficulty. This means it has never been more difficult to mine a new bitcoin throughout Bitcoin’s history. A positive adjustment of 5.56% pushed difficulty to a new high on April 27. Rising difficulty translates to rising competition among miners.
Although Bitcoin’s on-chain activity can foreshadow its future price action, it does not give you any indication about when that activity will be reflected in the price. It could take years for what you see on-chain now to impact the price. Until then, the price of Bitcoin could just head in the other direction, leaving you with significant opportunity costs if you take positions based on on-chain activity only.
If you want to keep an eye on what could happen in between the short and long-term, you can benefit from technical analysis, which we will discuss for Bitcoin in the following section.
- Bitcoin Technical Analysis:
After getting rejected at its 200-day simple moving average (SMA) resistance on March 28, Bitcoin lost its short-term support levels and pulled back to where it had fallen during the January market bottom, which is the 600-day SMA support.
Former long-term support levels are starting to turn into resistance now and multiple warning signs are emerging regarding Bitcoin’s next possible major move.
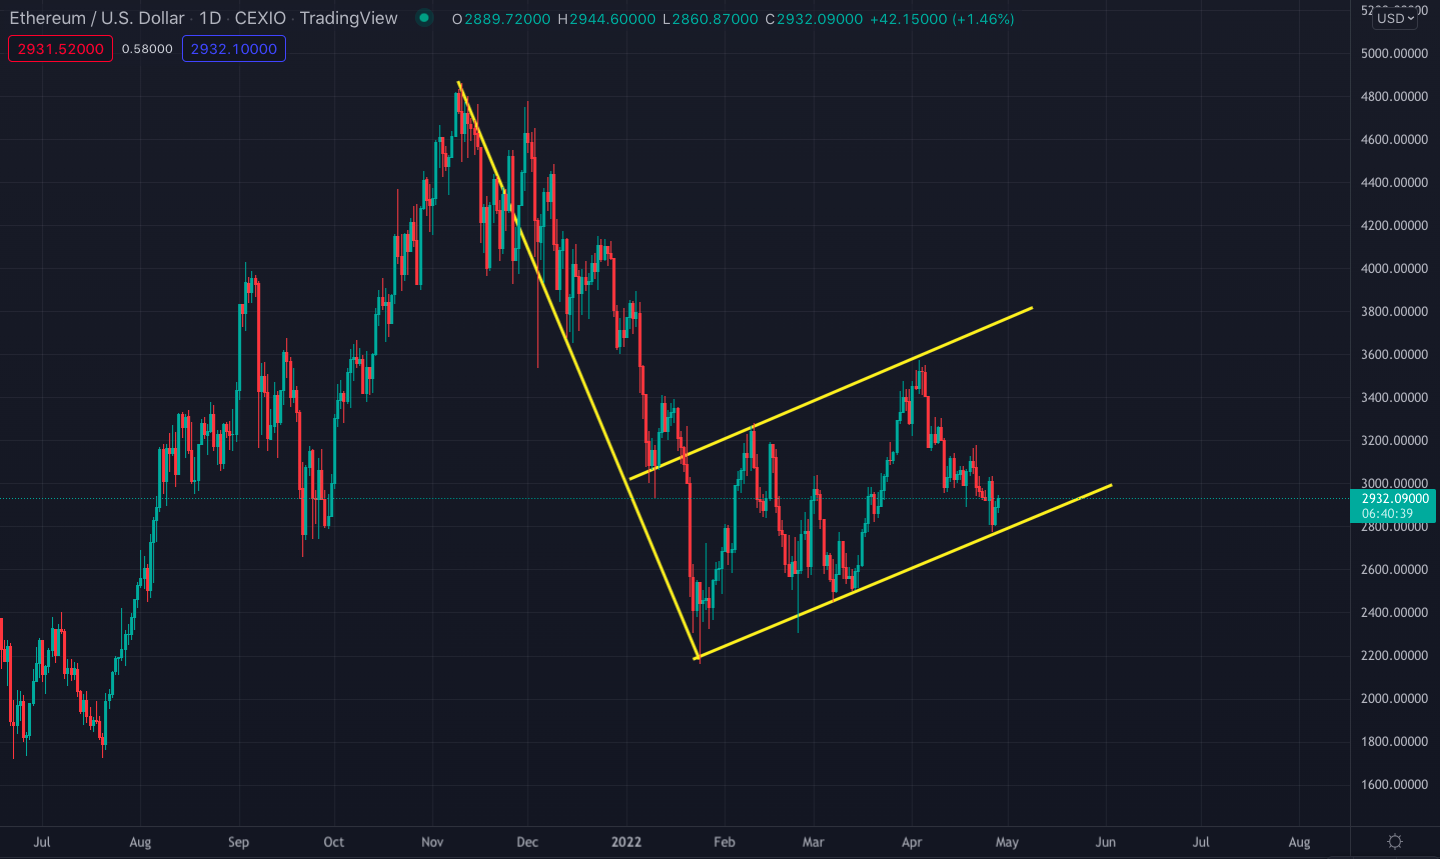
- Rising channel
Bitcoin has been moving inside a rising channel since its January 24 bottom at $33,000. So far, it has touched the upper resistance twice, getting rejected at both attempts to break the channel to the upside. Although rising channels are often interpreted as bullish patterns, they may end up as bear flags during downtrends. In other words, they may act as a mere bounce in the middle of a bear market followed by a new leg to the downside to lower low prices.
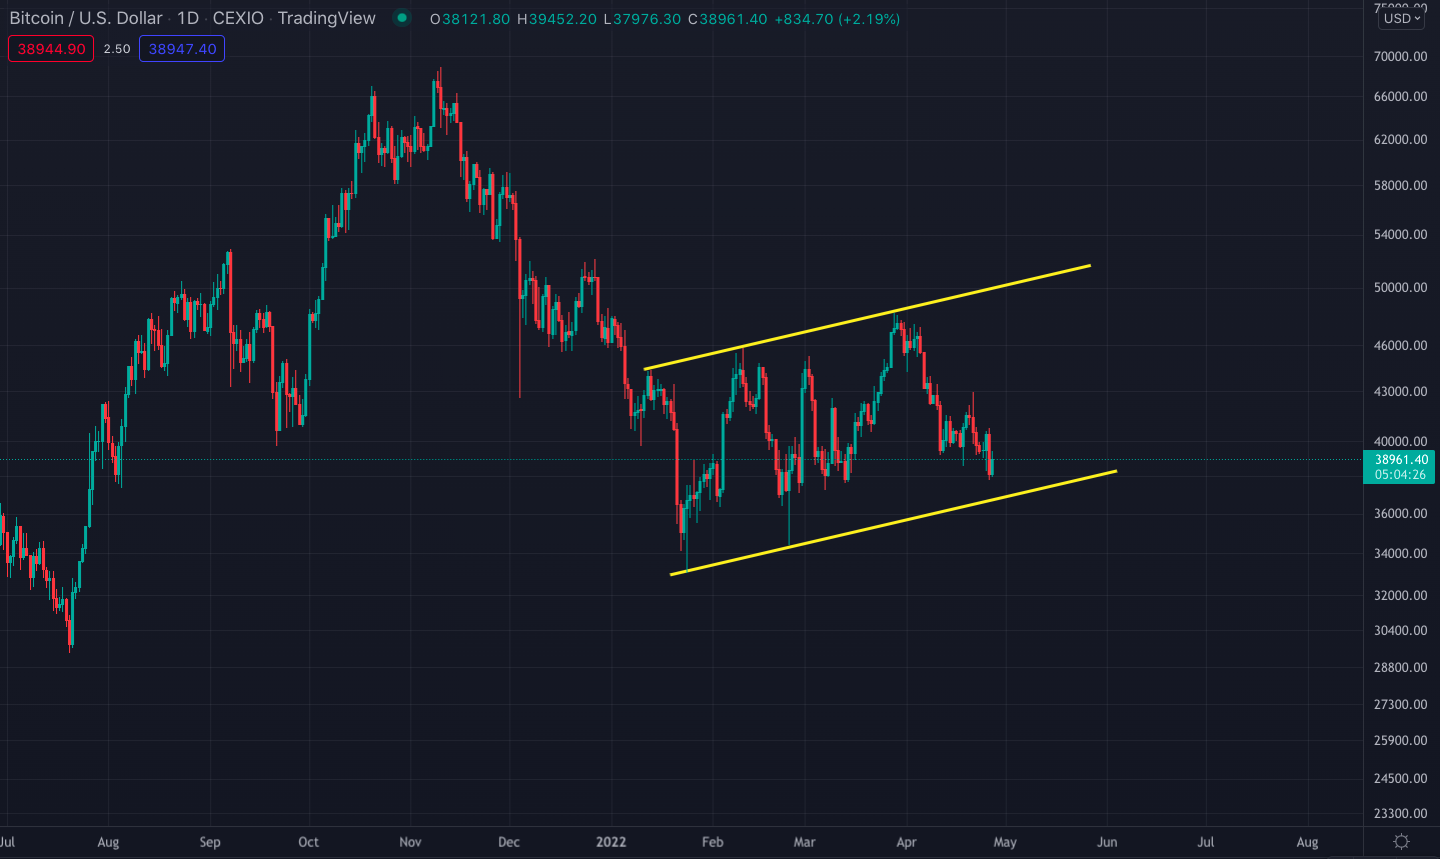
Bitcoin/U.S. Dollar price chart on a daily time frame. Each candlestick represents a single day.
Source: Tradingview
Following the March 28 top at $48,000, Bitcoin pulled back to its lower channel support, and now it is breaking down its 600-day simple moving average support for the first time since the March 2020 Covid crash (see the chart below).
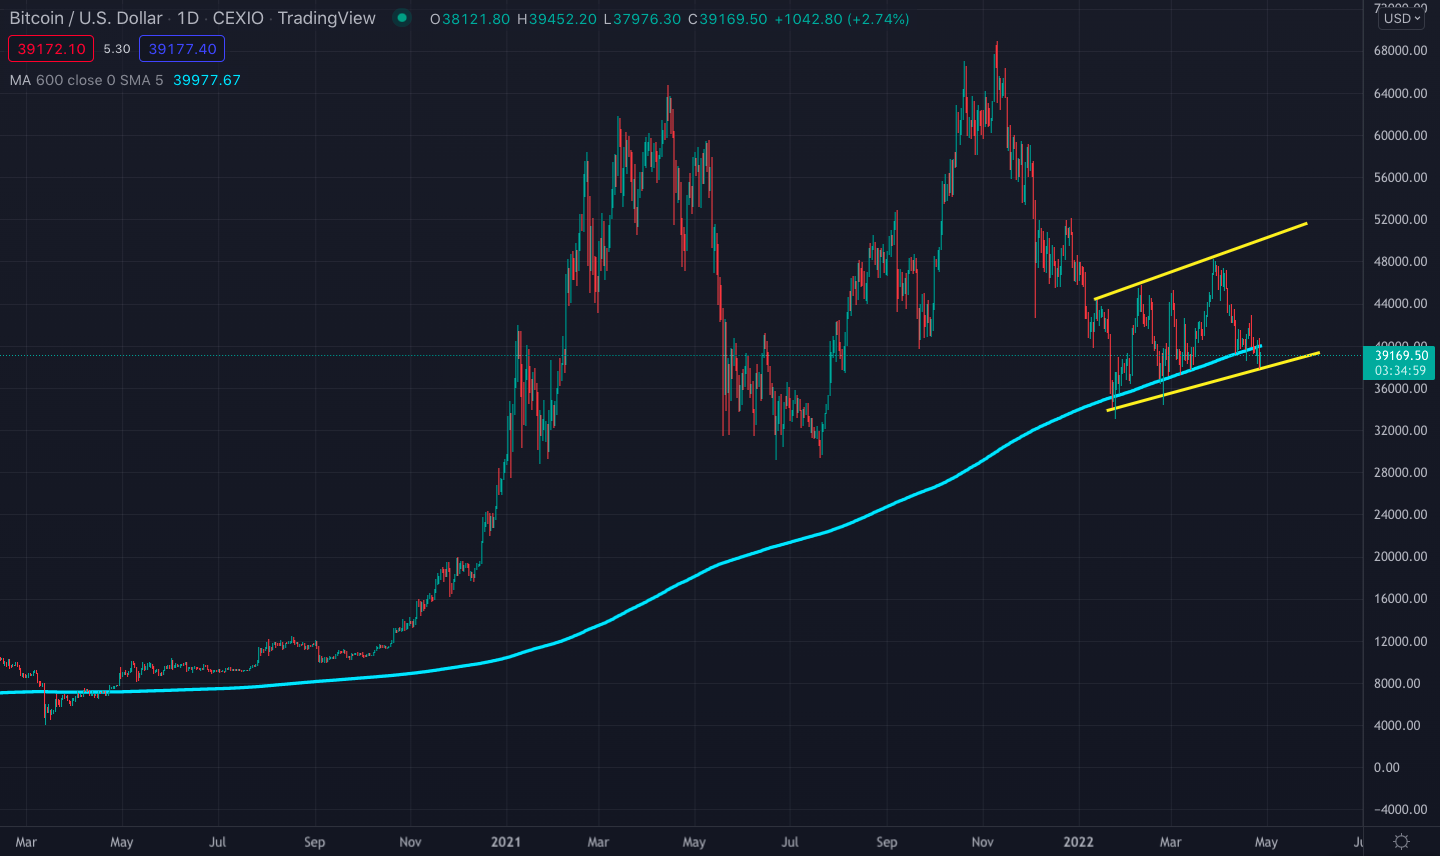
Bitcoin/U.S. Dollar daily price chart. The blue line represents the 600-day SMA.
The 600-day SMA is a make-or-break support level that has separated a Bitcoin bull market from a bear market in the past. Breaking down the 600-day moving average has always resulted in a capitulation event for Bitcoin.
- Possible bear flag
Bear flags are the exact opposite of bull flags in terms of their formation. The pole of the flag is downwards instead of upwards and the flag is tilted upwards. Therefore, a breakout from the flag is a downside movement instead of an upside.
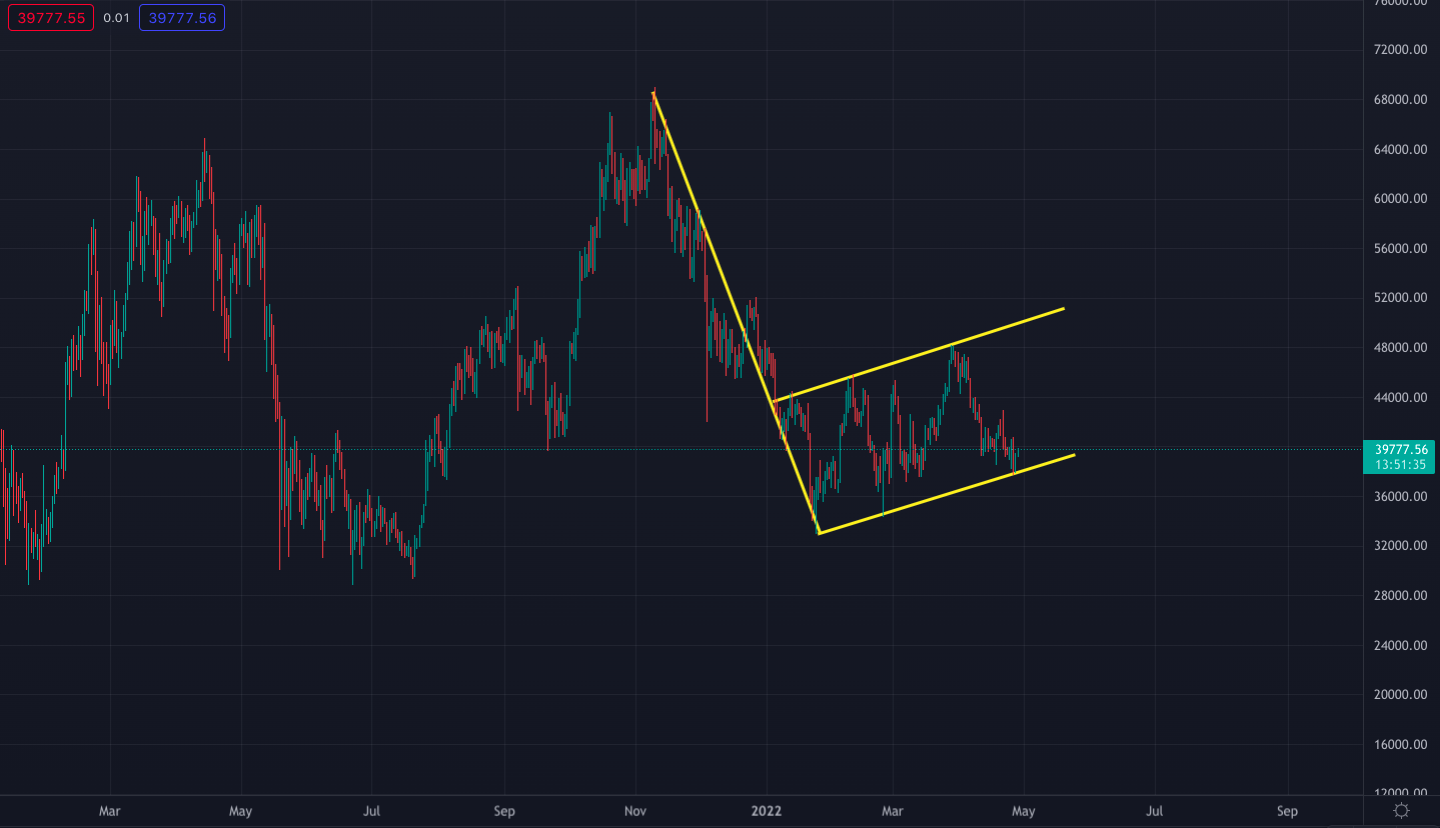
Bitcoin/U.S. Dollar price chart with the bear flag formation
If you invert the Bitcoin chart, this bear flag would look like a textbook bull flag as you can observe in the below chart:
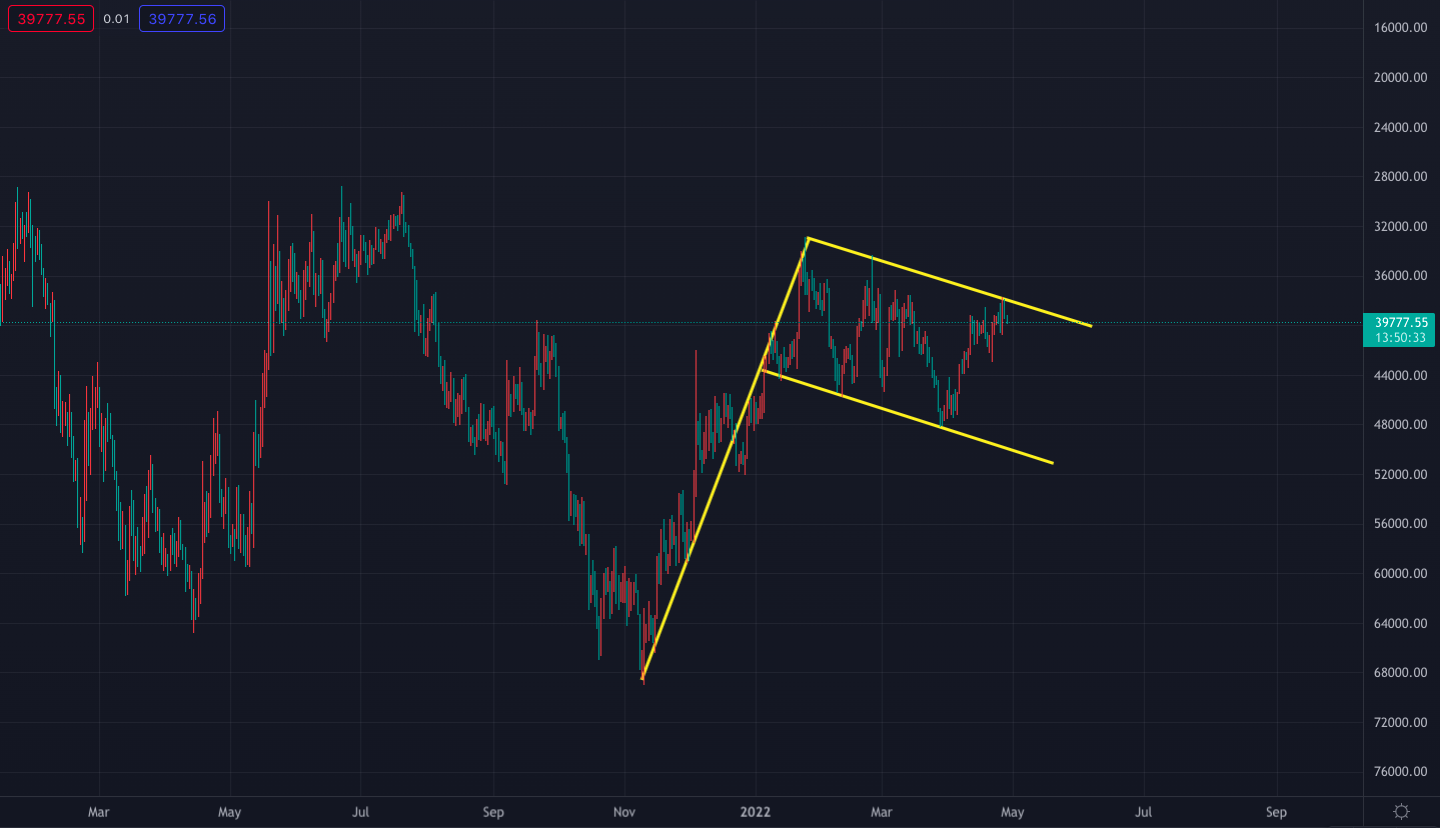
Inverted Bitcoin/U.S. Dollar chart with the bull flag
When market players see a chart like the above, most would likely identify it as a bull flag at first glance. What we are having now with Bitcoin is the exact opposite of this – a bear flag.
- The channel turns into resistance
If you draw Bitcoin’s current rising channel from the daily candle closes instead of their wicks, you will see that the bottom channel support has started to turn into resistance following the bearish engulfing candle recorded on April 26 (see the chart below).
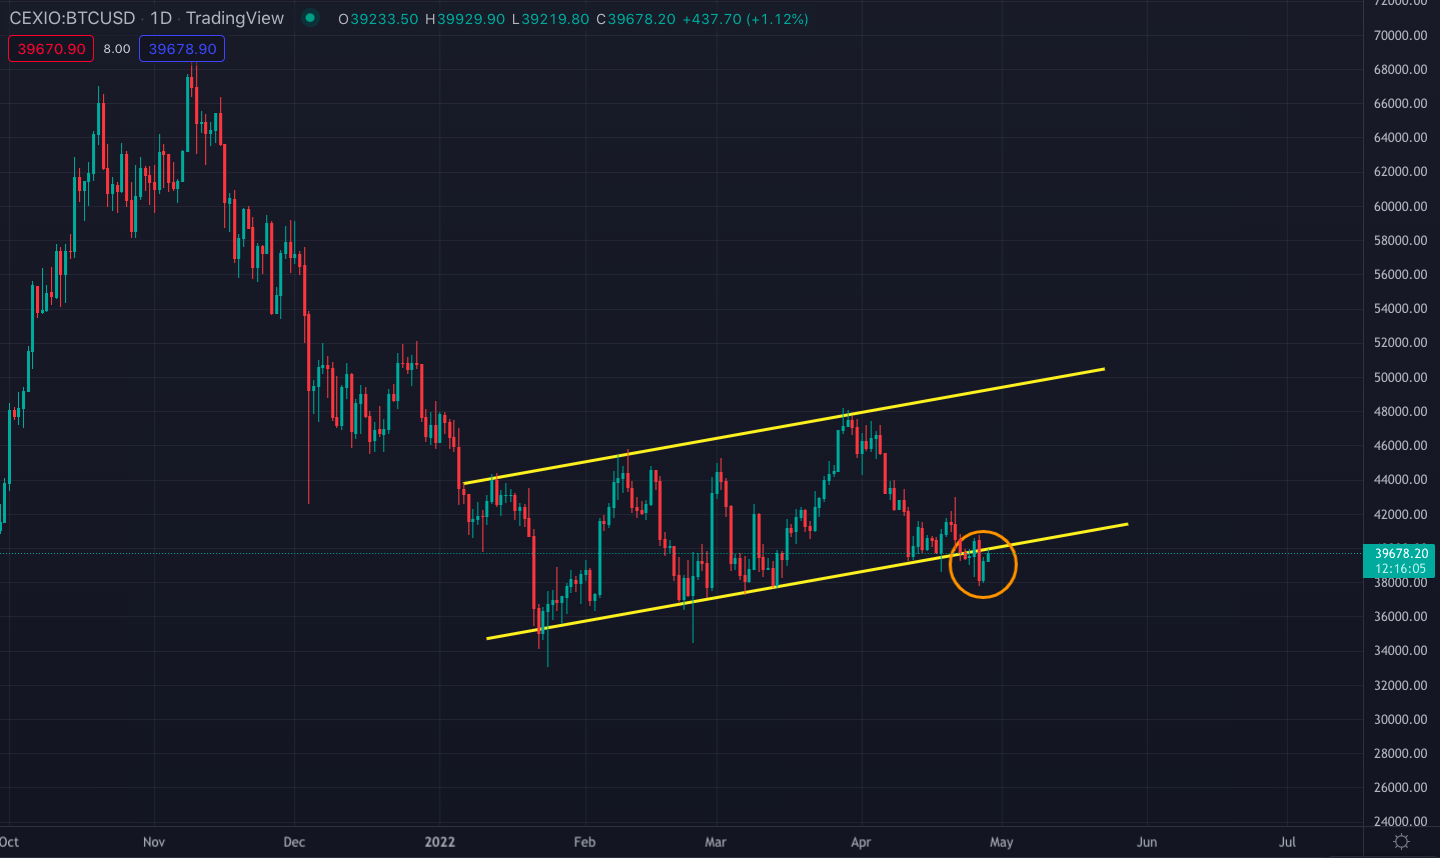
It is normal for prices to droop under a support level for a short period as long as they do not close below that level on a weekly or monthly time frame. What is concerning here is that Bitcoin got rejected very heavily at $40,800 on April 26 and closed the day with a bearish engulfing candle (the red candle circled in orange) which has statistically been a bearish candle formation, especially during downtrends.
- 3-day 200 SMA turning into resistance
The 200 SMA on the 3-day time frame has started to turn into resistance for the first time since the January lows (excluding the wicks). Bitcoin needs to climb above this resistance as soon as possible to avoid falling to new lows and it needs to print actual candle bodies above the resistance line on the 3-day chart, not just wicks.
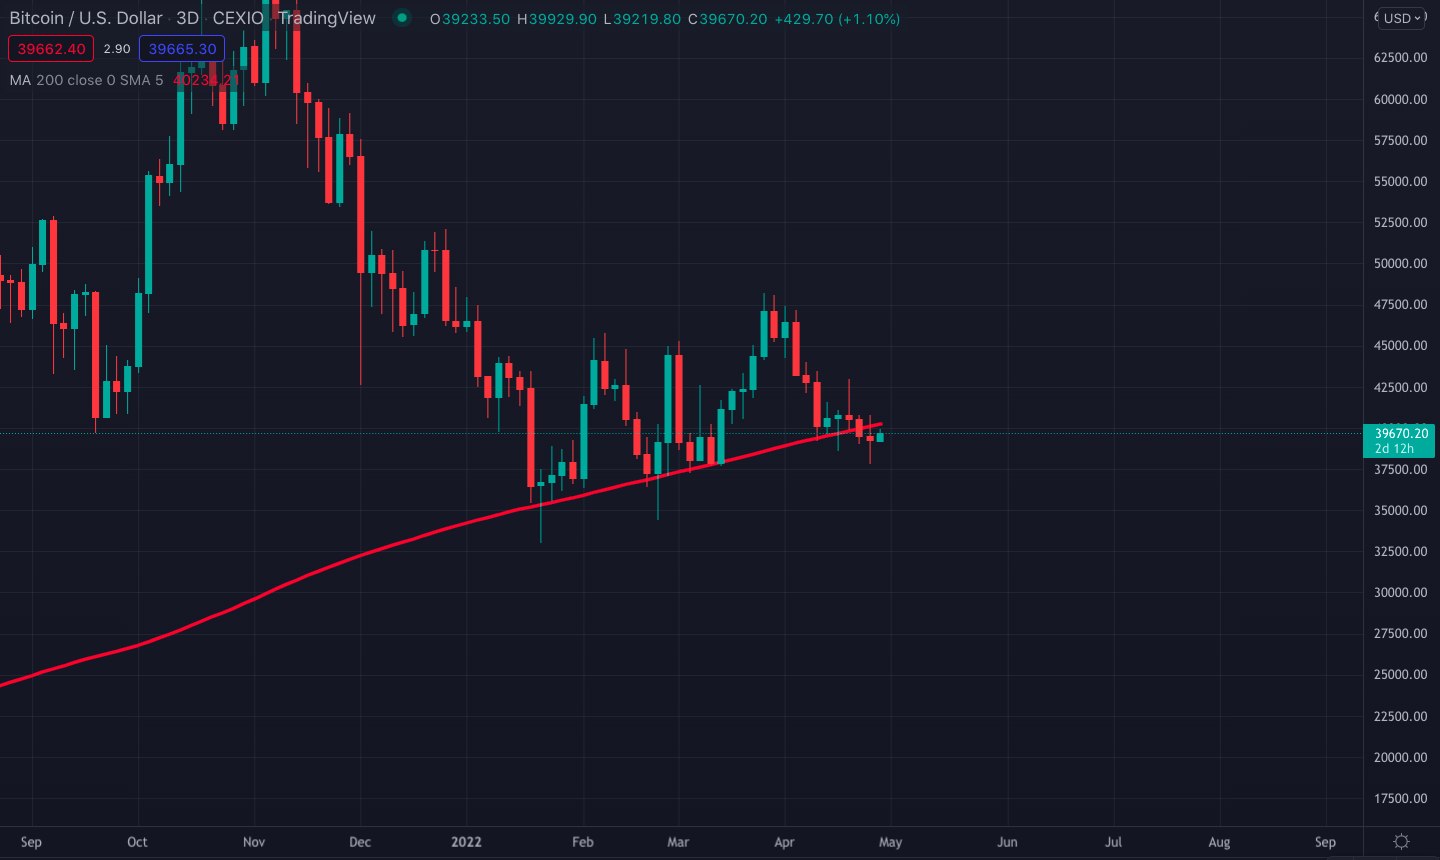
Bitcoin/U.S. Dollar 3-day price chart. The red line represents the 200 SMA.
- Impending 3-Day Death Cross
The 3-day death cross for Bitcoin is imminent now unless Bitcoin rockets through $50,000 in the next few weeks. The 3-day death cross is the crossing down of the 50 SMA (the yellow line in the chart below) and overlapping the 200 SMA (red line).

Bitcoin/U.S. Dollar 3-day price chart. The yellow line represents the 50 SMA and the red line represents the 200 SMA.
As you can see in the above chart, Bitcoin got rejected at the 3-day 50 SMA resistance on March 28. Following that, it retraced to the 200 SMA support for the third time after touching it in January and February and now candles are starting to close below this support level.
Extrapolating the two moving average lines on the horizontal time scale, the lines are expected to cross each other by May 10.
In Bitcoin’s history, 3-day death crosses have always ended with mega crashes and each time capitulation happened very quickly. For example, Bitcoin crashed by 50% in only one month following the 3-day death cross in November 2018 (see the chart below) which marked the end of the year-long downtrend.
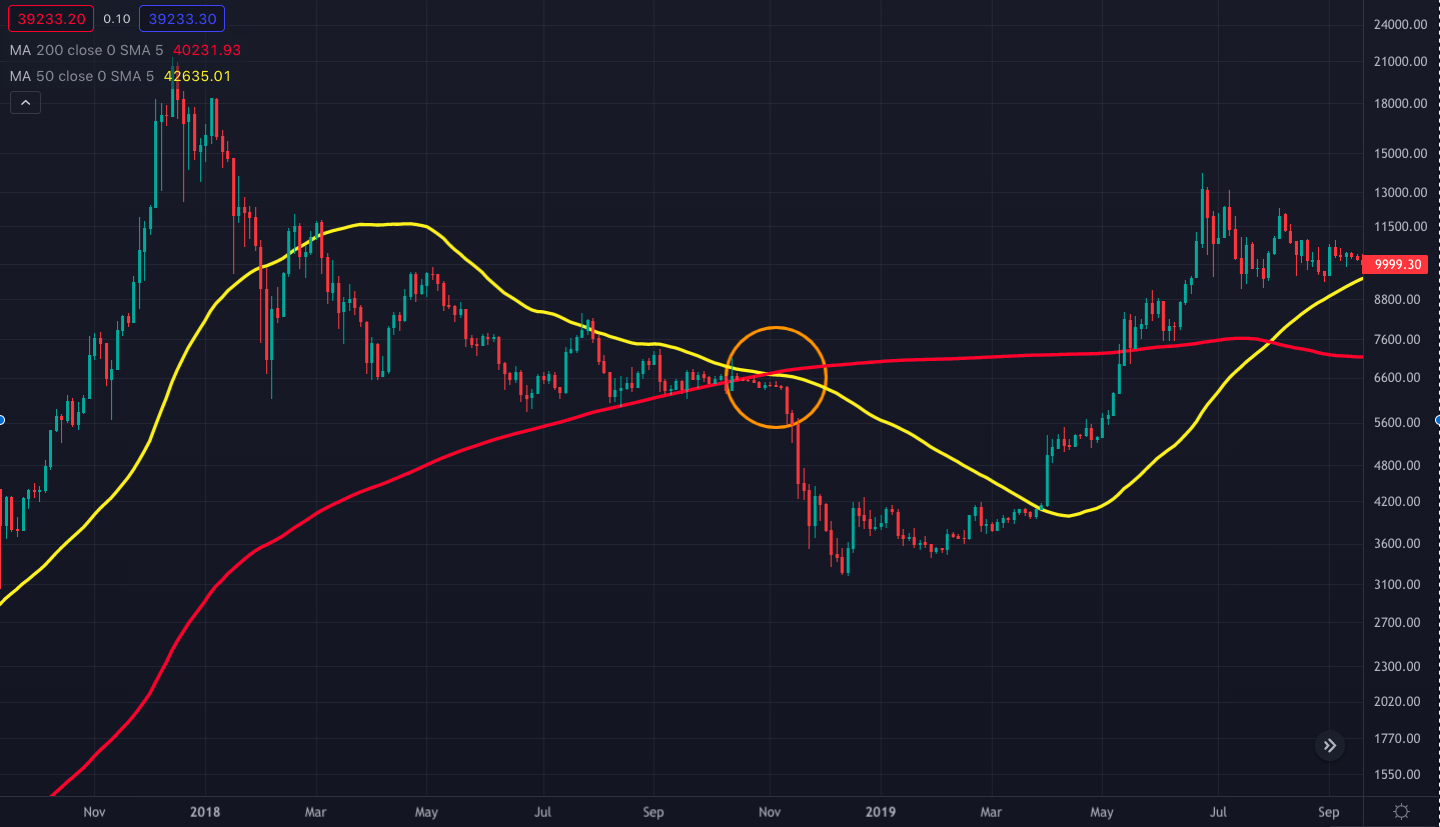
Bitcoin/U.S. Dollar 3-day price chart. The yellow line represents the 50 SMA and the red line represents the 200 SMA.
- Positive divergence on shorter time frames
Although there may be multiple warning signs in higher time frames, Bitcoin’s price was falling with consistent divergences throughout April.
For example, there has been a positive divergence in the relative strength index (RSI) in the 6-hour time frame. As Bitcoin’s price was falling (the yellow line on the below candlestick chart), the RSI momentum indicator was rising (the green line on the RSI indicator) which means the price drop was not accompanied by an equivalent selling pressure. This usually happens when everybody in the market becomes bearish and expects further price drops but there are not many sellers left to push the price down in the short term.
The ongoing positive divergence could hint at a possible short squeeze before Bitcoin’s next major move either to the upside or downside. This would put Bitcoin back into its rising channel.
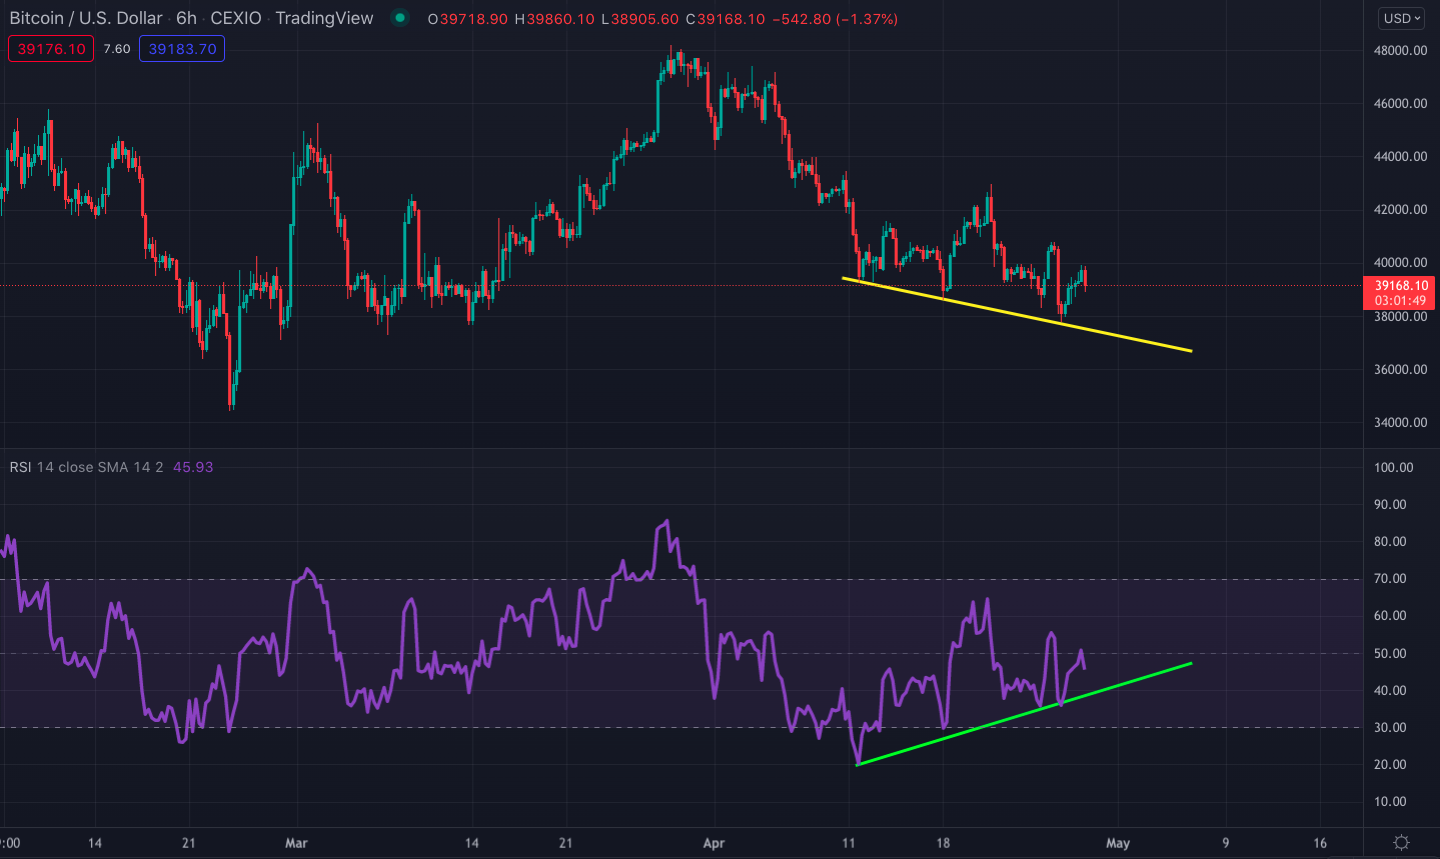
Bitcoin/U.S. Dollar 6-hour price chart. Each candlestick represents 6 hours.
ETHEREUM ANALYSIS
Price Overview (From April 29 Close)
- Last 7-day change: -2.2%
- 7-day low: $2,764.60
- 7-day high: $3,037.60
- Last 30-day change: -15.3%
- 30-day low: $2,764.60
- 30-day high: $3,581.40
Network Overview
- ETH Burned (7-day): 25,682.98 ETH
- TX Count (7-day): 7.6 million
- TX Volume (7-day): 10.9 million ETH
- ETH Moved in/out of Smart Contracts (7-day): -50,507 ETH
- Net Change in Exchange Balance (7-day): -29,717 ETH
Ethereum Technical Analysis:
Throughout the history of cryptocurrencies, Bitcoin has managed to drag Ethereum and other altcoins along with itself, either to the upside or to the downside.
Although many positive developments are going on in the Ethereum ecosystem such as switching to a new proof of stake blockchain, they have not been reflected in the price action because expectations about the crypto ecosystem’s future are still centered around Bitcoin and not enough funds are entering the crypto market now due to Bitcoin’s shaky outlook.
During downtrends or indecisive ranging periods, it becomes difficult for major crypto assets like Ethereum to move independently from Bitcoin because only new and large fund entries can usually move the price of such large assets substantially. In the past, it was usually the smaller cap coins that benefited from indecisive ranging periods since comparatively smaller funds could be enough to surge prices when they had a positive catalyst.
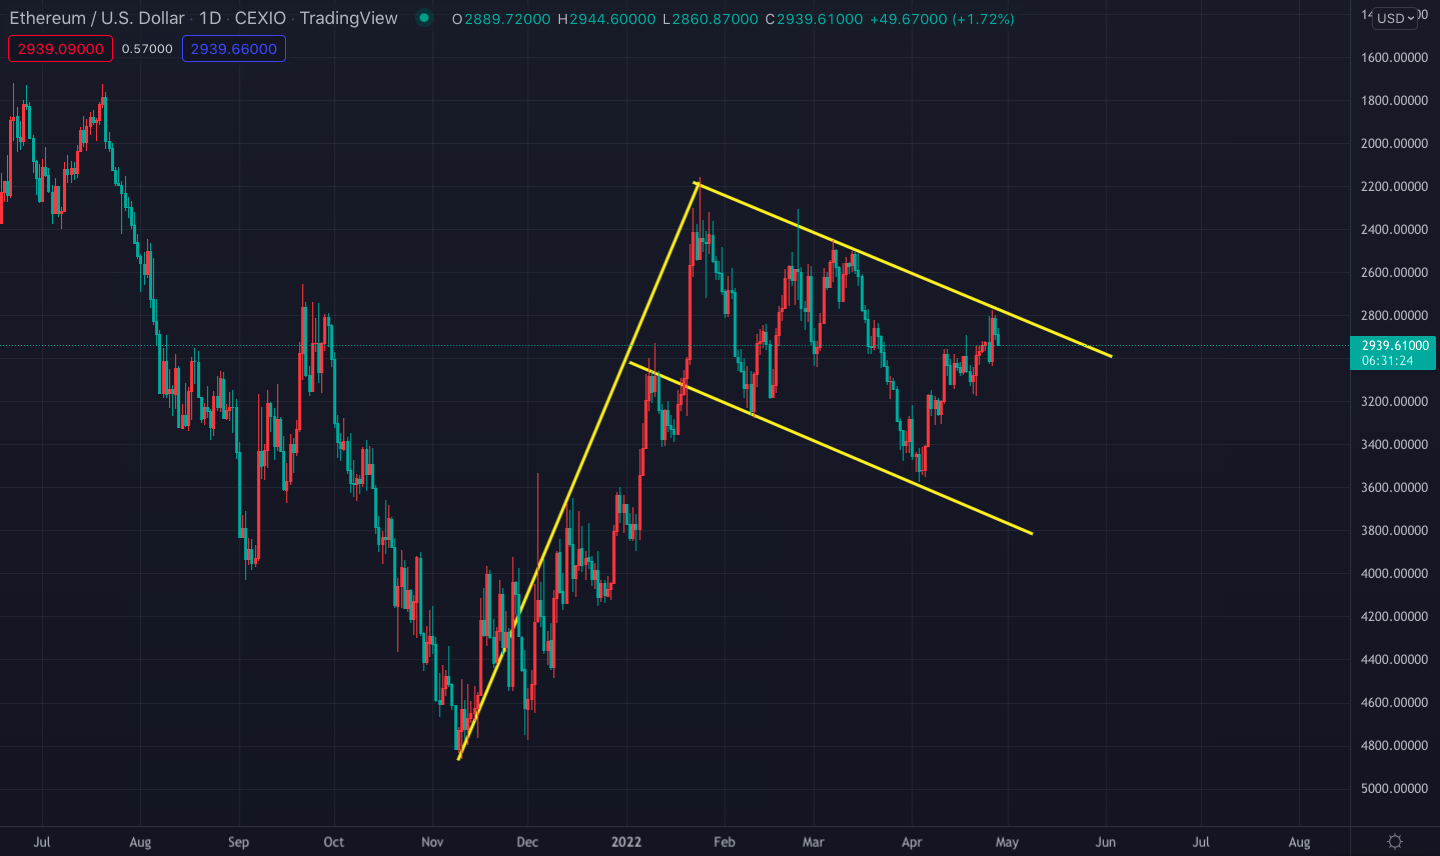
- Same bear flag forming on Ethereum
Bitcoin’s bear flag formation is also present in the Ethereum/US Dollar parity as you can see in the below chart.
Ethereum/U.S. Dollar daily price chart with the bear flag formation
Likewise, if you invert the Ethereum chart, you would see an identical bull flag formation to that of Bitcoin:
Inverted Ethereum/U.S. Dollar chart with the bull flag
- Positive divergence on shorter time frames
Since the early April top, Ethereum’s price has also been falling (the yellow line in the below chart) with a positive divergence from its RSI indicator (green line) on shorter time frames:
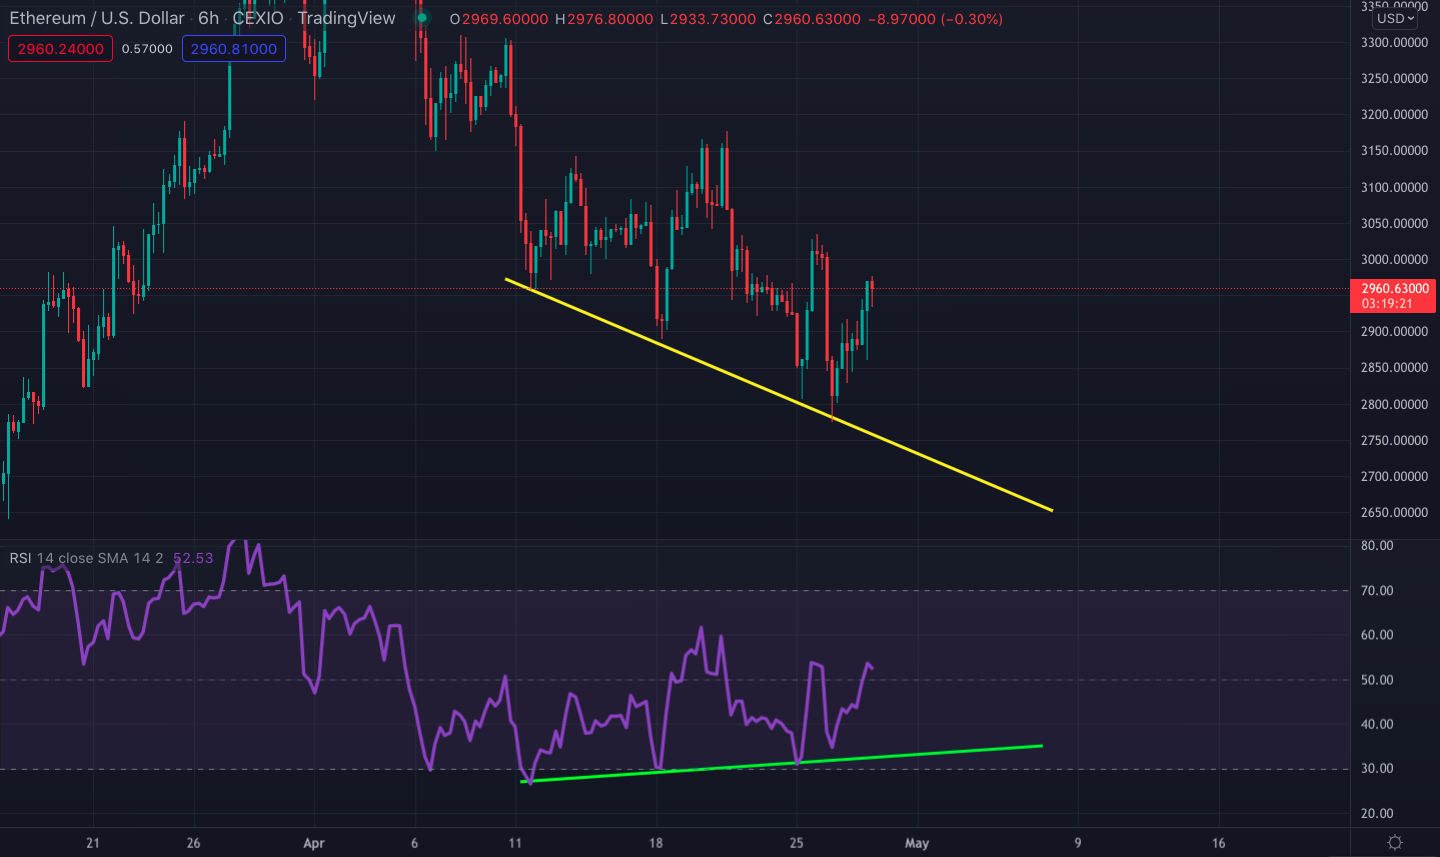
A short-term positive divergence like the 6-hour usually happens when everybody in the market is bearish and expects more price drops but there are not many sellers left to push the price further down in the short term. This ongoing positive divergence with Ethereum could hint at a possible short squeeze before Ethereum’s next major move either to the upside or downside.
ALTCOINS TO WATCH
- Twitter boost on Dogecoin
Elon Musk officially struck a deal on April 24 for taking over Twitter at a total valuation of $44 billion. The acquisition became the internet’s most trending topic within a few hours.
All eyes naturally turned to Dogecoin to see whether DOGE would become the payment currency of the Twitter ecosystem. In a TED interview the following day, Musk has voiced the idea of accepting DOGE as payment for Twitter’s premium subscription services.
The value of Dogecoin has surged by almost 30% following Musk’s comment. Traders and investors have seemingly piled into the dog-inspired cryptocurrency because they believe Musk will bring DOGE to Twitter.
- Tron launches algorithmic stablecoin
Tron founder Justin Sun announced that the blockchain will launch its stablecoin, USDD on May 5.
According to Sun, USDD will not operate like the standard stablecoins, Tether (USDT) and USD Coin (USDC), which are backed by physical US Dollars and other physical assets.
Instead, USDD will join the popular algorithmic stablecoin trend just like Terra’s UST and Frax Finance’s FRAX stablecoins. USDD will have a similar working principle to these algorithmic stablecoins to keep its peg against the US dollar.
When USDD’s price is lower than 1 USD, traders and arbitrageurs can send 1 USDD to the network and receive 1 USD worth of TRX. When USDD’s price is higher than 1 USD, traders and arbitrageurs can send 1 USD worth of TRX to the decentralized system and receive 1 USDD.
This mechanism seeks to maintain the algorithmic stablecoin’s US dollar peg regardless of changing market conditions.
Tron DAO will also provide custody reserves of up to $10 billion in highly liquid assets to serve as collateral backing for USDD. This is similar to Terraform Labs founder and CEO Do Kwon’s plan to acquire $10 billion of bitcoin to serve as reserves for UST.
- SAND breaking down from a massive descending triangle
Despite the positive developments in the Sandbox ecosystem such as the company’s plans to raise $400 million for its next funding round, technicals may be suggesting otherwise regarding the price action for the SAND token.
Given the market’s shaky outlook, all crypto assets are strongly correlated to Bitcoin’s moves nowadays and what is forming on the Sandbox chart may be something to follow closely:
As you can see in the above chart, SAND has reached the very end of a massive descending triangle that has been forming since November 2021 and started to break down from this triangle.
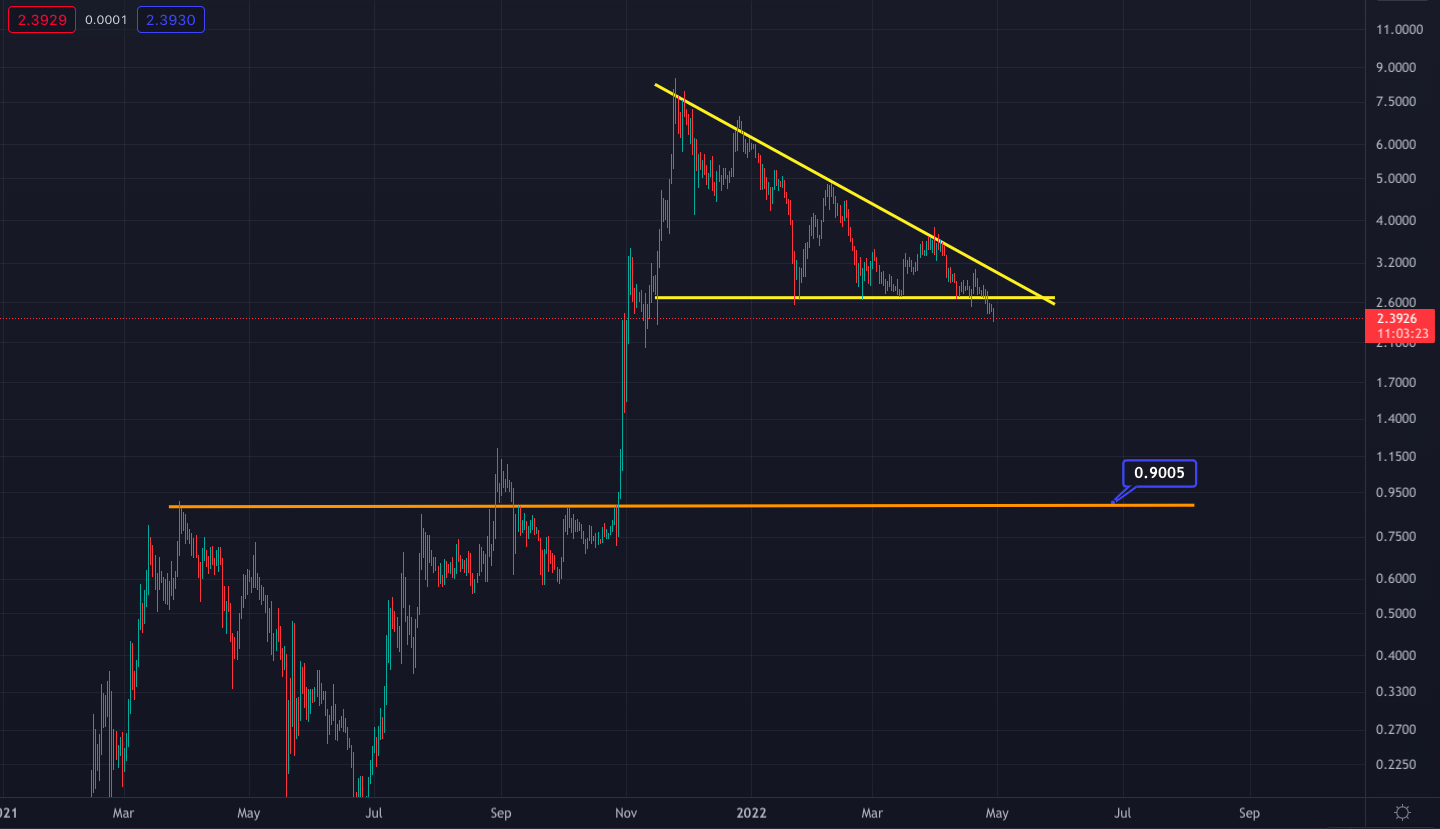
SAND/U.S. Dollar daily price chart
If SAND cannot break out of this triangle as soon as possible, the next major support on the downside will be $0.90 which corresponds to a 63% drop from the current price.
- Optimism launches DAO and airdrops tokens to users
Optimism announced the launch of the Optimism Collective, a decentralized autonomous organization (DAO), and the airdrop of OP tokens on April 26. The DAO will be used as a governance mechanism for the layer 2 network. As the name of the DAO suggests, Optimism seeks to tap into its many users to build a scalable future for digital assets. The DAO will be governed by two “houses;” the citizens’ house and the token house. The citizens’ house will cater to public goods funding and will be used as a defense mechanism against plutocratic attacks.
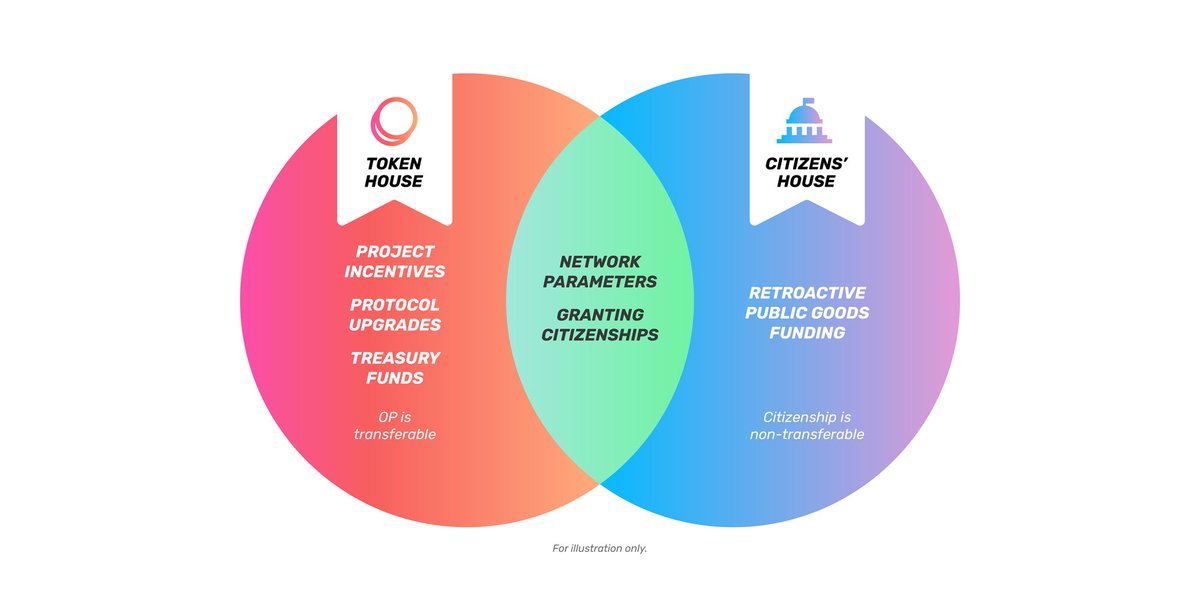
Source: Optimism
The token house includes the Optimism token ($OP) holders. OP tokens will be used to govern the protocol, project incentives, and more. It will serve as a primary driver of growth in the Optimism ecosystem. OP tokens will be airdropped to users. The Optimism team has made it clear that this is the first of several rounds of airdrops.
REGULATORY DEVELOPMENTS
CAR and Panama embrace Bitcoin
The Central African Republic (CAR) and Panama passed laws that make Bitcoin legal tender and give it legal status.
The CAR became the second country in the world, after El Salvador’s move in September 2021, to recognize Bitcoin as legal tender. The move by the CAR came as a surprise to many. There are a lot of questions now regarding the country’s infrastructure to support the law because only 10% of the country has access to electricity. Some possible motives for the country’s passing of the law include substituting its current reliance on the CFA franc for foreign trade and using the law as a foundation for further regulations related to economic development.
On the other hand, Panama’s new legislation constitutes an industry first because it is the first country that defines not only Bitcoin but also other cryptocurrencies as a medium of payment for civil and commercial transactions. To fulfill that purpose, the country accepts the issuance of new digital assets and excludes cryptocurrencies from capital gains taxes.