Every week, CEX.IO plunges into the cryptocurrency ecosystem to explore the cause and effect of recent price actions. In the 28th edition of the Crypto Ecosystem Update, we take a deep dive into Bitcoin’s recent price crash from $25,000 to $20,800 and lay out alternative scenarios about where Bitcoin could be headed in the short-to-mid term.
Additionally, we provide a concise review of important developments that could reverberate throughout the ecosystem in the weeks or months ahead.
Read along for in-depth price analyses and enjoy reviews of correlated markets to help you make the most informed decisions along your crypto journey.
Bitcoin scares its holders
On August 17, Bitcoin broke down from the rising wedge that it had followed since July 26. The release of the Federal Reserve’s July meeting notes seemed to trigger the drop which indicated that interest rate hikes will continue until inflation comes down substantially.
A market-wide sell-off has dominated all asset classes since then. What is more concerning for Bitcoin is that by breaking down the rising wedge, it also broke down the parallel ascending channel it has been following since June 18. With the bottom line of the channel having acted as resistance since August 19, this deviation raises concerns about whether the channel will turn into a new bear flag.
The next few daily price candles, as well as the August monthly close, will be very critical in determining Bitcoin’s next major move. If the ascending channel keeps playing as resistance and ends up as a bear flag, the downside target price for Bitcoin could be around $12,000.
On the contrary, if Bitcoin climbs back into the channel soon and starts a trend to the upside, the crash from the rising wedge could end up as a bear trap for FOMO buyers who bought at $25,000 earlier in the month.
A double bottom structure could also be in the cards at around $17,600 (June 18 bottom) to create an even deeper bear trap for Bitcoin holders. Considering the sharp drop from $25,000, a zigzag A-B-C correction could well play out. This would put the downside target price at $18,000 and make an almost-perfect double bottom for Bitcoin.
Of course, crypto’s correlated assets that are higher up in the hierarchy could have the final say in the crypto market’s next big move. If the S&P 500, the asset class that Bitcoin has been most closely correlated with, can break above its descending resistance line, it could enable Bitcoin to march towards its major resistance at $29,000. If the downside pressure continues on U.S. stocks, Bitcoin could eventually capitulate another leg down towards the $12,000 level.
Breakdown from the rising wedge
Bitcoin broke down from the rising wedge that it followed since July 26. The drop ended at the late-June and early-July tops where Bitcoin had earlier formed an Adam and Eve reversal pattern.
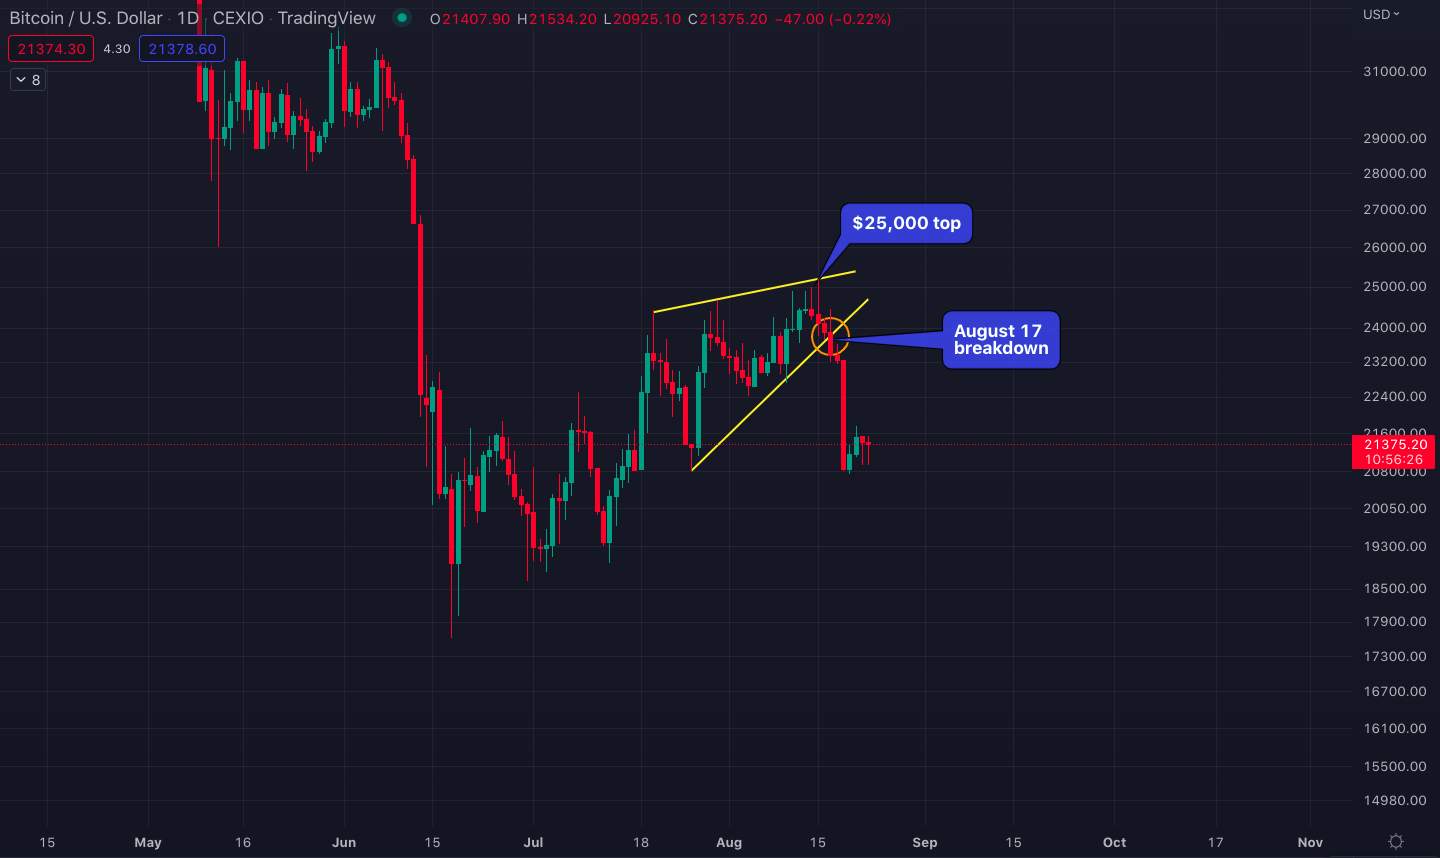
Bitcoin/U.S. Dollar breaking down from the rising wedge. Source: Tradingview
Breakdown from the parallel ascending channel
Unfortunately, the breakdown from the wedge also cratered the ascending channel’s lower support line (see the chart below).

Bitcoin/U.S. Dollar breaking down from the ascending channel
Despite multiple attempts in shorter time frames to climb back into the channel, the lower line has consistently acted as resistance so far:
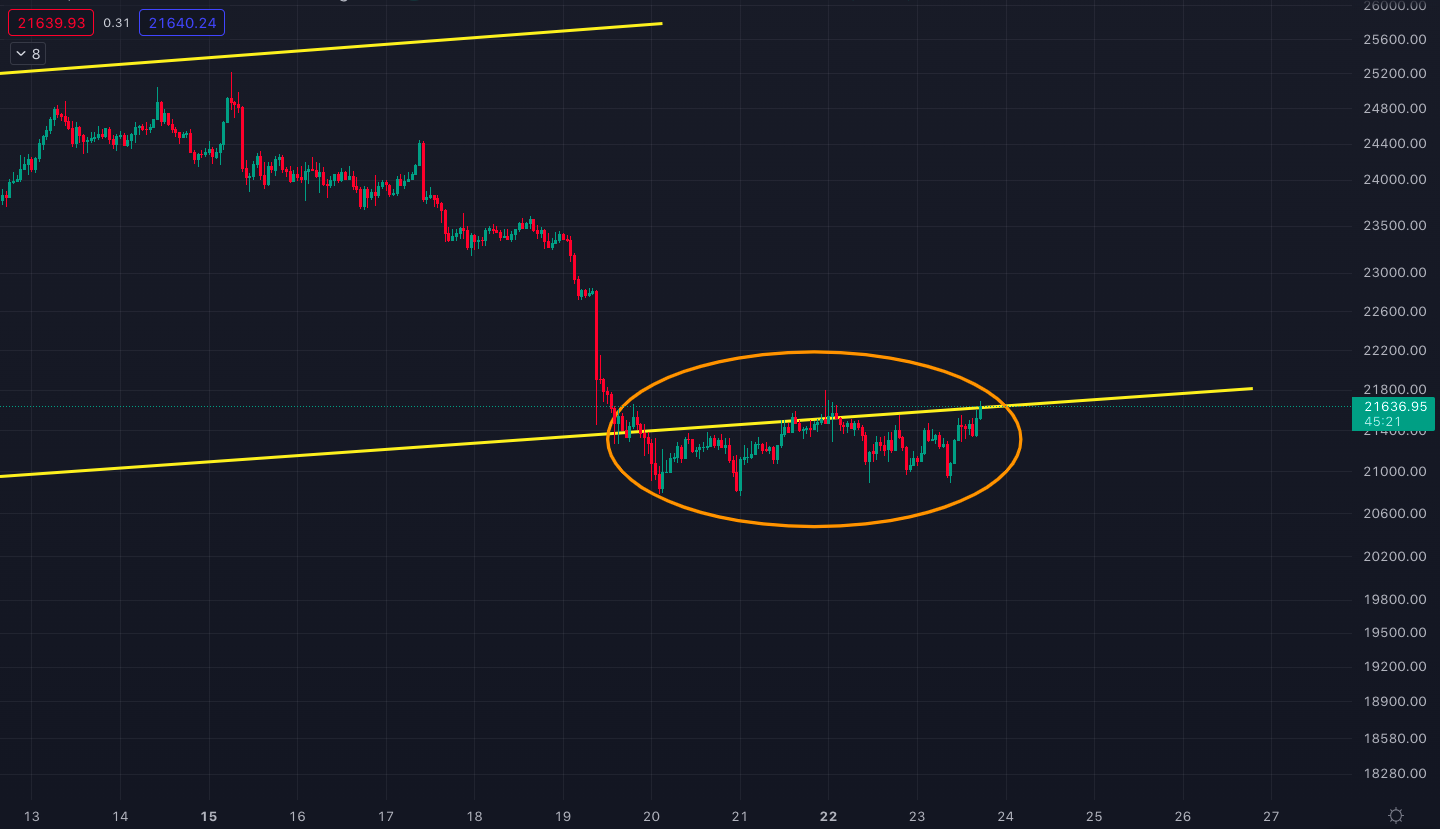
Every hour that BTC remains below this resistance line, the probability of the channel turning into a bear flag increases.
Target price if a bear flag plays out
A bear flag target price is estimated by taking the length of the retracement that precedes the ascending channel (the flag) and extrapolating the same length below a possible breakdown point (the two blue lines in the chart below):
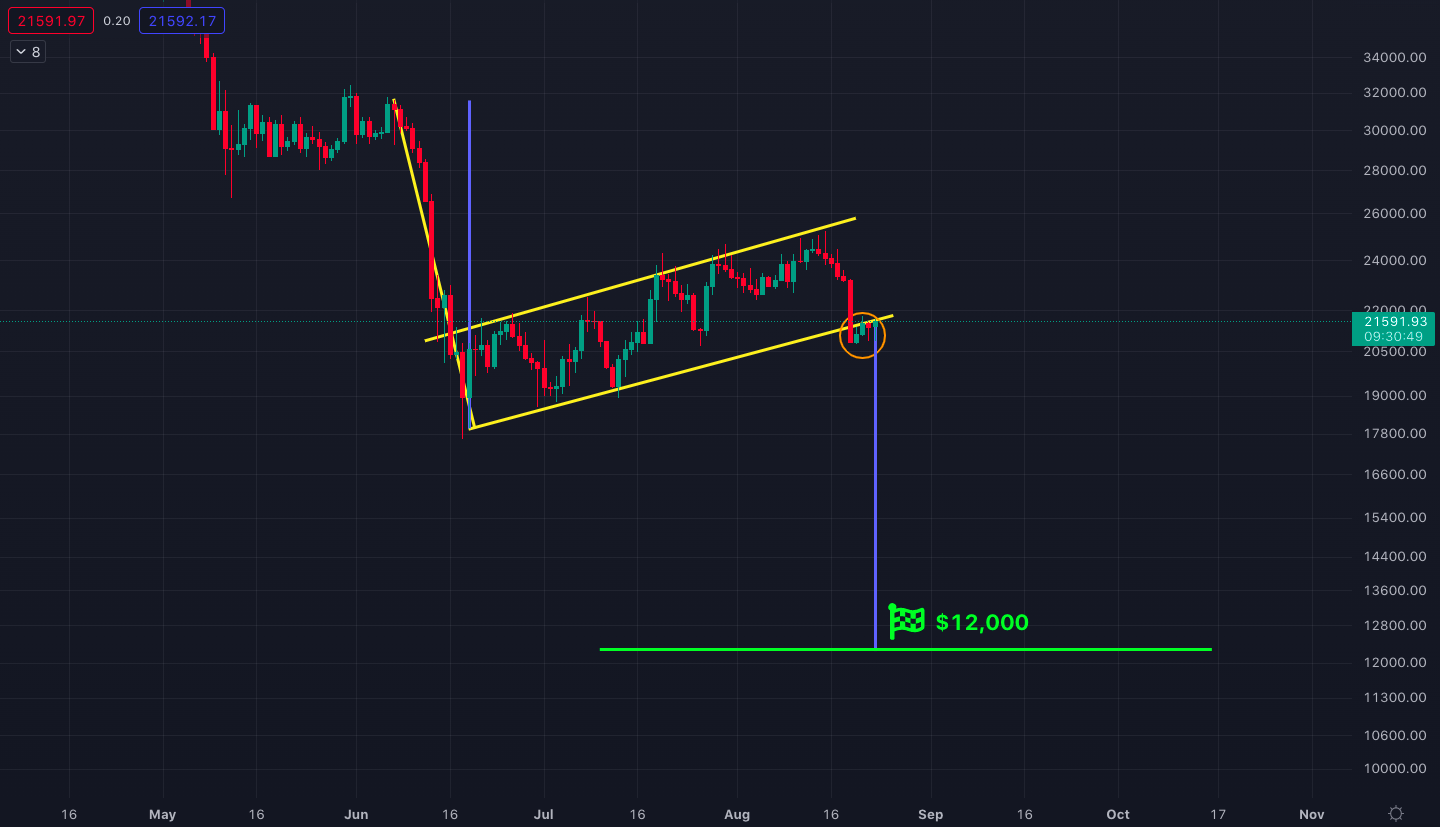
Bitcoin/U.S. Dollar price chart with the bear flag target at $12,000
Double bottom scenario
As an alternative scenario, the crash from the rising wedge could evolve into an Elliott zigzag correction wave which would put the price target at around $18,000.
A zigzag correction typically starts with a rapid price drop (wave A), followed by a corrective wave to the upside (wave B). Once wave B peaks, a second impulse wave to the downside (wave C) joins the band making a new low price. In a zigzag correction, the length of wave C is typically the same as the length of wave A.

Bearish zigzag waves with the A-B-C structure
In that sense, Bitcoin’s sharp drop from $25,000 on August 17 to $20,800 on August 19 could be Wave A, which could in turn mean that we’re moving inside of Wave B at this very moment. If the price fails to break back into the channel, a wave C could soon follow from the current price levels.
Since Wave A constituted a 17% drop, a similar drop from the $21,800 high on August 21 could end at approximately $18,000 creating a perfect double bottom:
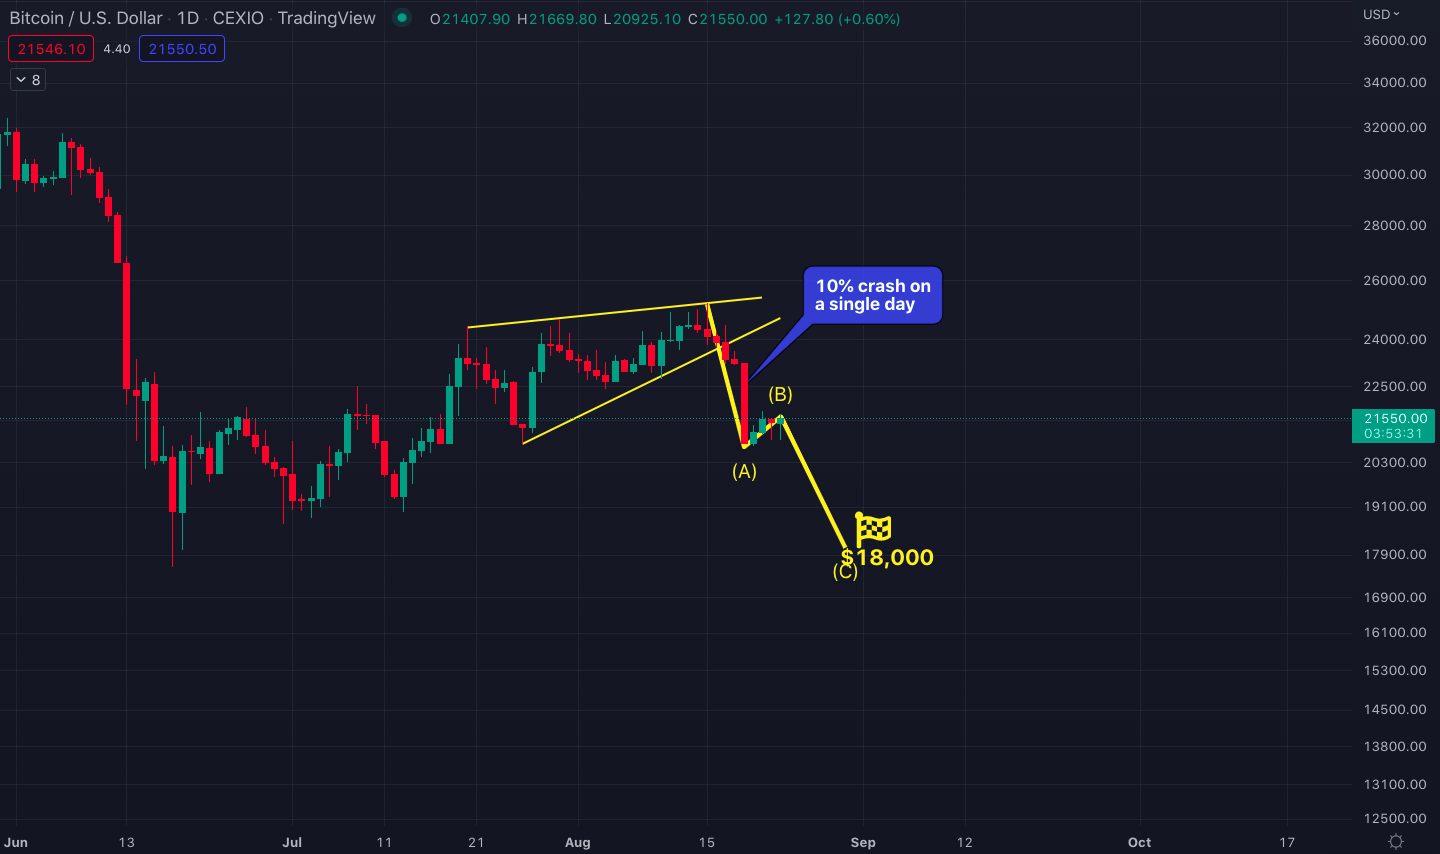
Bitcoin/U.S. Dollar price chart with the A-B-C zigzag wave
S&P 500 rejected at descending resistance
Following the bounce from its June low, the S&P 500 stock index got rejected at the descending resistance line that has been intact since the January market top. The descending resistance intersects with the major horizontal resistance at $4,300, so the rejection happened exactly at that price level.
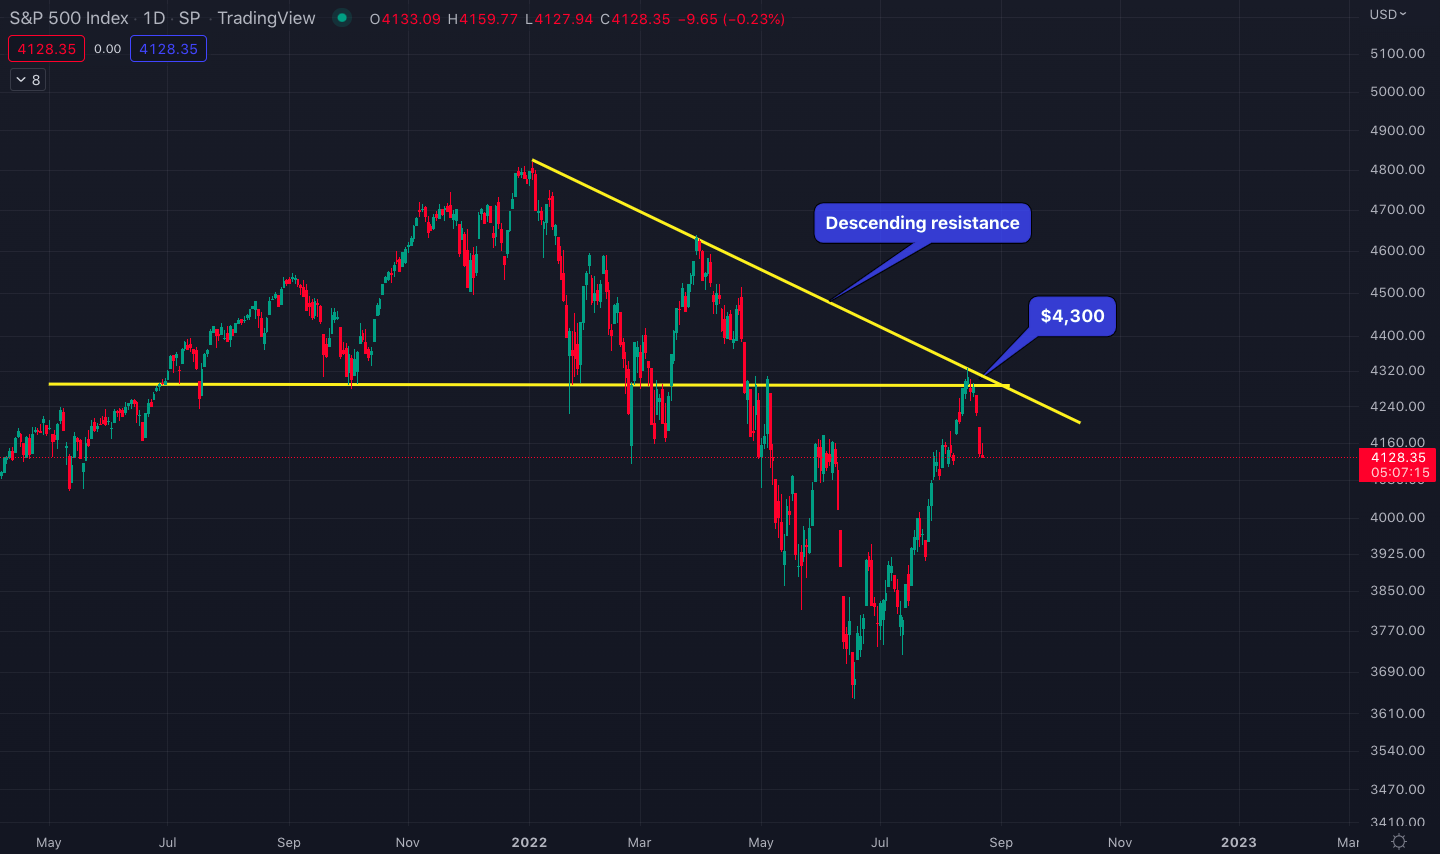
S&P 500 price chart with the descending and horizontal resistances at $4,300
We need to wait and see if the index breaks the descending resistance to the upside without getting caught up in a bull trap. The presence of another major resistance at approximately the same price level could make it difficult for the index to decisively break above $4,300.
Bitcoin, a highly volatile asset compared to the S&P 500, was able to rise by the same percentage as S&P since the June market bottom (around 20%). This hints at a weakness in Bitcoin and suggests that a new breakdown in the S&P index could cause Bitcoin to drop significantly more.
Market sentiment
Although price charts have been looking grim lately, it is worth noting that the overall sentiment in the market is inarguably negative due to the ongoing economic problems, and the anticipation of future rate hikes. Rallies usually do not end with such negative sentiment.
The S&P 500 index started its most recent rally with one of the most negative sentiments known to date, after dropping 25% from its all-time high.
But even after an 18% price surge, it is difficult to claim that the sentiment in the market has changed to positive. The same can be argued for the crypto market. There is still a lot of talk on social media about significantly larger price drops. In the long run, that could be the truth. But in the short term, it raises some suspicions as well.
The recent price corrections since August 17 could end up as bear traps and markets could rally significantly higher turning more and more people bullish before eventually running out of steam at some major resistance.
$29,000 resistance if Bitcoin rallies
If Bitcoin rallies to the upside and breaks above the parallel ascending channel, a natural resistance would be at $29,000 which was the major bull market support from 2021. But regardless of how it breaks, we’ll be keeping watch and are committed to providing timely future updates on any movements.

Bitcoin/U.S. Dollar price chart with the $29,000 major resistance
Ethereum staking breaks new records
Ethereum had a dazzling rally during July and August which outran Bitcoin by around 60%. Since topping out on August 14 at $2,000 per coin, Ethereum’s price action has generally converged with that of Bitcoin, with both tending to increase and decrease at similar percentages.
The price of Ethereum dropped from $2,000 to a low of $1,550 on August 22, while Bitcoin dropped from $25,000 to $20,700 during the same period.
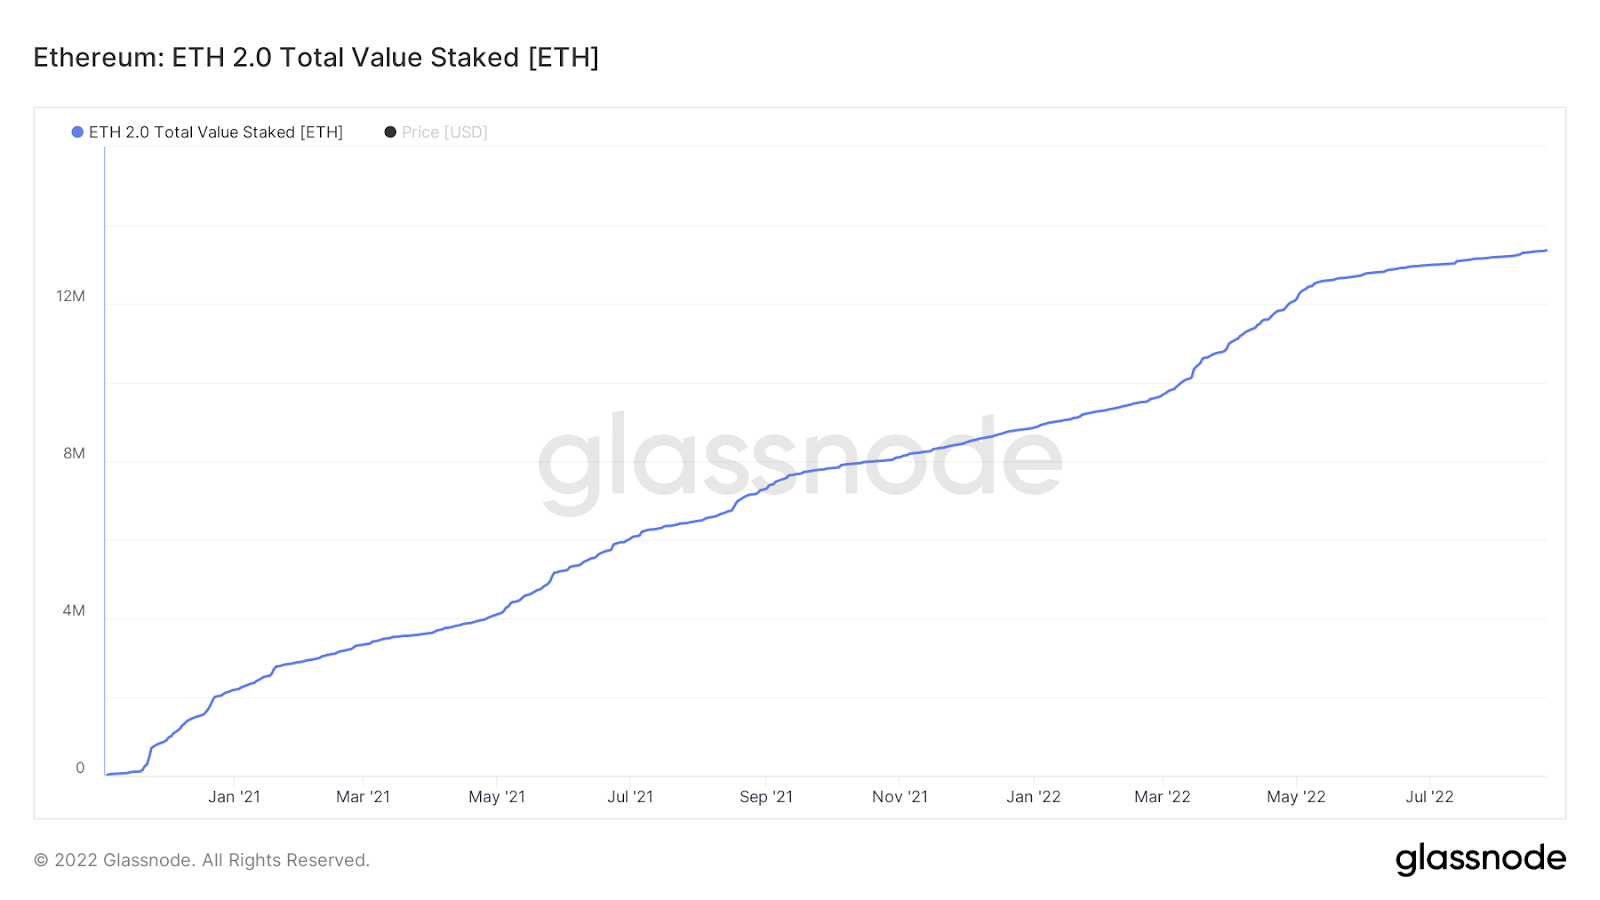
In the meantime, the number of ETH staked on Ethereum’s new proof of stake blockchain is continuing to break daily records. At the beginning of the year, around 8 million ETH were staked on the network. Now that figure has grown to surpass 13 million as of August 25.
As you can observe in the chart below, the staked ETH supply is continuously rising. Because staking takes coins or tokens out of circulation, the growing deflation in the Ethereum ecosystem could eventually help its token price despite the ongoing bear market.
Mass liquidation hazard for BAYC NFTs
Following the May and June liquidity crises among lending platforms, a new liquidity crisis could be brewing in the NFT space.
The crypto ecosystem has recently seen the emergence of new lending platforms that offer loans in return for NFT collaterals. According to crypto analyst DoubleQ, many of these platforms are on the verge of becoming illiquid as the floor prices for NFT collections have tanked.
Floor prices tank due to dropping demand for NFT collections. Due to that, the value of an individual NFT given out as collateral most likely drops as well.
BendDAO, one of the prominent lending platforms for NFT collaterals, makes the most of the headlines for this anticipated liquidity crisis. BendDAO allows users to deposit Bored Ape Yacht Club (BAYC) NFTs to receive short-term loans of up to 40% of the NFT’s value.
There are currently 20 BAYC NFTs on the platform with a health factor of less than 1.1 and dozens more under 1.2. Fears related to low health factors resulted in liquidity providers removing the majority of the wrapped Ethereum (wETH) tokens they have been providing to the protocol.
According to researcher NFTStatistics.eth, there are only 15 wETH left on BendDAO in return for the 15,000 ETH deposited to the protocol to buy NFTs on leverage. This could potentially trigger a liquidation of approximately $55 million worth of NFTs.
Uniswap blocks crypto addresses
Decentralized exchange Uniswap has recently blocked 253 wallet addresses due to their connections with stolen funds or transaction mixing services like Tornado Cash, which was earlier sanctioned by the U.S. Treasury.
Uniswap is comprised of three core elements: Code running on the blockchain, a front-end website for users to interact with the code, and a U.S.-based company that both develops the code and runs the front-end website. Blocking crypto addresses happens on the front-end level.
Although blocking hackers, scammers, or other malignant accounts seems like a positive development, criticisms subsequently followed claiming that a decentralized exchange renouncing its neutrality is against the core principles of decentralized transacting.
Keep an eye out for future updates and analysis from CEX.IO as the crypto ecosystem continues to evolve. To always stay informed, follow us on social media, or sign up for our mailing list to never miss a beat.
Disclaimer: Information provided by CEX.IO is not intended to be, nor should it be construed as financial, tax or legal advice. The risk of loss in trading or holding digital assets can be substantial. You should carefully consider whether interacting with, holding, or trading digital assets is suitable for you in light of the risk involved and your financial condition. You should take into consideration your level of experience and seek independent advice if necessary regarding your specific circumstances. CEX.IO is not engaged in the offer, sale, or trading of securities. Please refer to the Terms of Use for more details.