This weekly piece of cryptocurrency price analysis and thought leadership is brought to you by the expert team at CEX.IO, your crypto guide since 2013. We’re committed to helping users identify trade setups with the maximum number of confluences, all from a single resource.
In this edition, we discuss how Bitcoin is getting squeezed into an overly tight price range which could soon burst out. In the 33rd edition of our Crypto Ecosystem Update, we lay out the factors that could shape Bitcoin’s next major move.
Plus, enjoy detailed price analysis for Chainlink, Dogecoin, and XRP, in light of their recent developments.
Read along for in-depth break downs and enjoy reviews of correlated markets to help you make the most informed decisions along your crypto journey.
Bitcoin: nowhere left to go — could an explosive move be coming?
Markets have been trying to find their direction since the Federal Reserve’s funding rate hike on September 21. The Job Openings and Labor Turnover (JOLT) numbers for August were released on October 3 showing that job openings plunged by over 10% compared to the July figure.
Despite the major drop, job openings still remain high in relation to workers with the ratio currently resting at 1.7. Other measures of labor market stress remain historically low.
The positive data resulted in the New York Stock Exchange index ($NYA) making one of its strongest monthly openings with a 6.30% increase in only two trading days (October 3 and 4).
Twitter stock jumped by 22% on October 4 in response to Elon Musk’s tweet and has been an additional contributor to this week’s stock market recovery.
However, it is possible that the recent bounce could just be a relief rally before a new major leg down.
Bitcoin on the other hand bounced by only 6% during the same period. Being a highly volatile asset, Bitcoin typically moves in larger magnitudes compared to the U.S. stock indices. Considering this, a price increase that is similar to what we’re seeing in stocks could indicate weakness for Bitcoin.
To make things worse, Bitcoin recorded the highest trading volume in its history last week (including volume with stablecoins), albeit with a minuscule 1.33% price increase. Record buying crypto volumes that barely move the price of an asset could suggest that sellers are still in control. Alternatively this could also suggest that sellers are getting more and more exhausted as temporary drops in price are constantly getting bought up.
However, during bear markets, it’s not usually a good sign for a support level to get tested over and over again. Contrary to popular belief, hitting a support level multiple times can wear the support away instead of making it stronger. Bitcoin has bounced from the $18,500 support six times since the June low, followed by a lower high price at every bounce.
The falling resistance line that has been intact since May is adding further pressure on the $18,500 support. The price of Bitcoin is now reaching falling resistance once again.
How Bitcoin will behave when it hits the falling resistance line could seal the alpha cryptocurrency’s fate for the next 3-4 months. It could result in an explosive move to the upside or to the downside as there is almost no space left to move between the support ($18,500) and the falling resistance ($20,700).
S&P 500 knocking on the channel resistance
The S&P 500 stock index, the asset class that Bitcoin has been most closely correlated with, took a strong bounce early this week in response to the positive JOLT data. Following the 5.60% bounce, the index hit the rising channel resistance from summer 2022 (see the chart below).
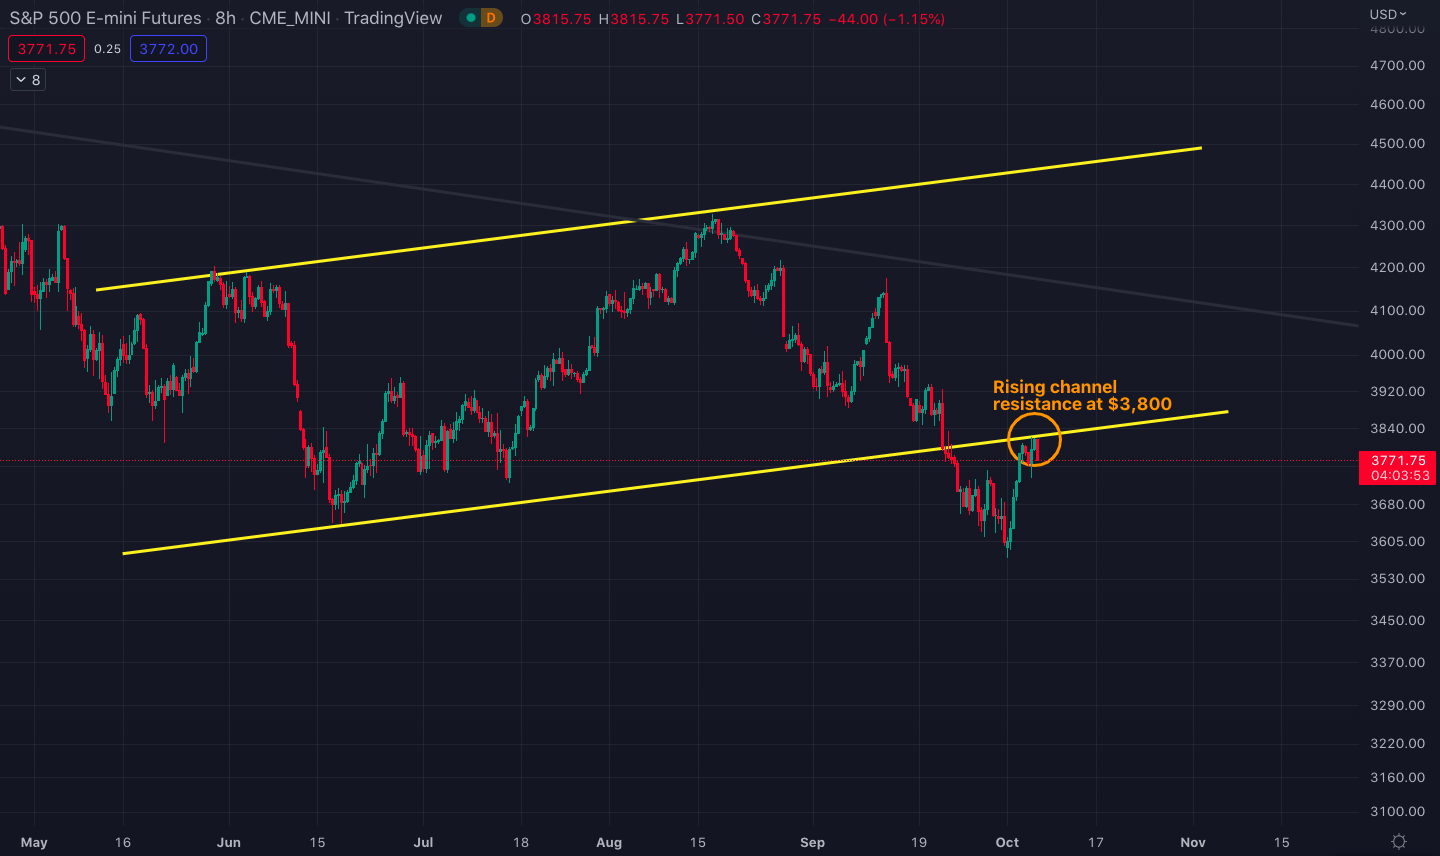
S&P 500 stock index chart with the rising channel resistance. Source: Tradingview.
If the index price can pass the resistance line, it could then climb to the $4,000 resistance, although this could likely take a few shots to accomplish such a move. In the meantime, the index could range between the $3,800 local high and the $3,600 local low.
Horizontal ranging of the S&P 500 index could give Bitcoin the freeway to climb back to the $22,000 strong resistance.
Highest trading volume in history
The week of September 26 saw Bitcoin record the highest trading volume in its history, including the volume with stablecoins. However, all the activity barely moved the price (+1.33%).
This could be concerning for the bulls as it could indicate sellers are still in control. In the past, this level of buying bitcoin activity would have translated to double-digit gains for that week.
Bitcoin/USD price chart on the weekly time frame.
Alternatively, sellers pushing that hard to suppress the price could also mean that they may soon run out of coins to sell.
Consistent testing of the $18,500 support
Since the June 18 low, Bitcoin has bounced from the $18,500 support six times. The majority of financial and social media interpret this as a positive development in the belief that it shows strength for this support level.
However, support levels have not always worked that way in past bear markets. Even after strong downtrends, assets can still get overbought just by horizontal ranging. Getting overbought during these consolidation periods while testing the lower support repeatedly typically weakens the support instead of strengthening it.
Bitcoin’s crash from $6,000 to $3,000 in 2018 is a great example of this phenomenon. After crashing from $20,000 to $6,000 in February 2018, Bitcoin cruised between $6,000 and $10,000 for the next nine months. During this period, the $6,000 support was tested almost a dozen times (see the chart below). This led more and more people to believe that $6,000 was the bottom.
However, the support was weakened and worn away due to excessive friction at that level. The horizontal ranging period ended with a mega crash from $6,000 to $3,000.
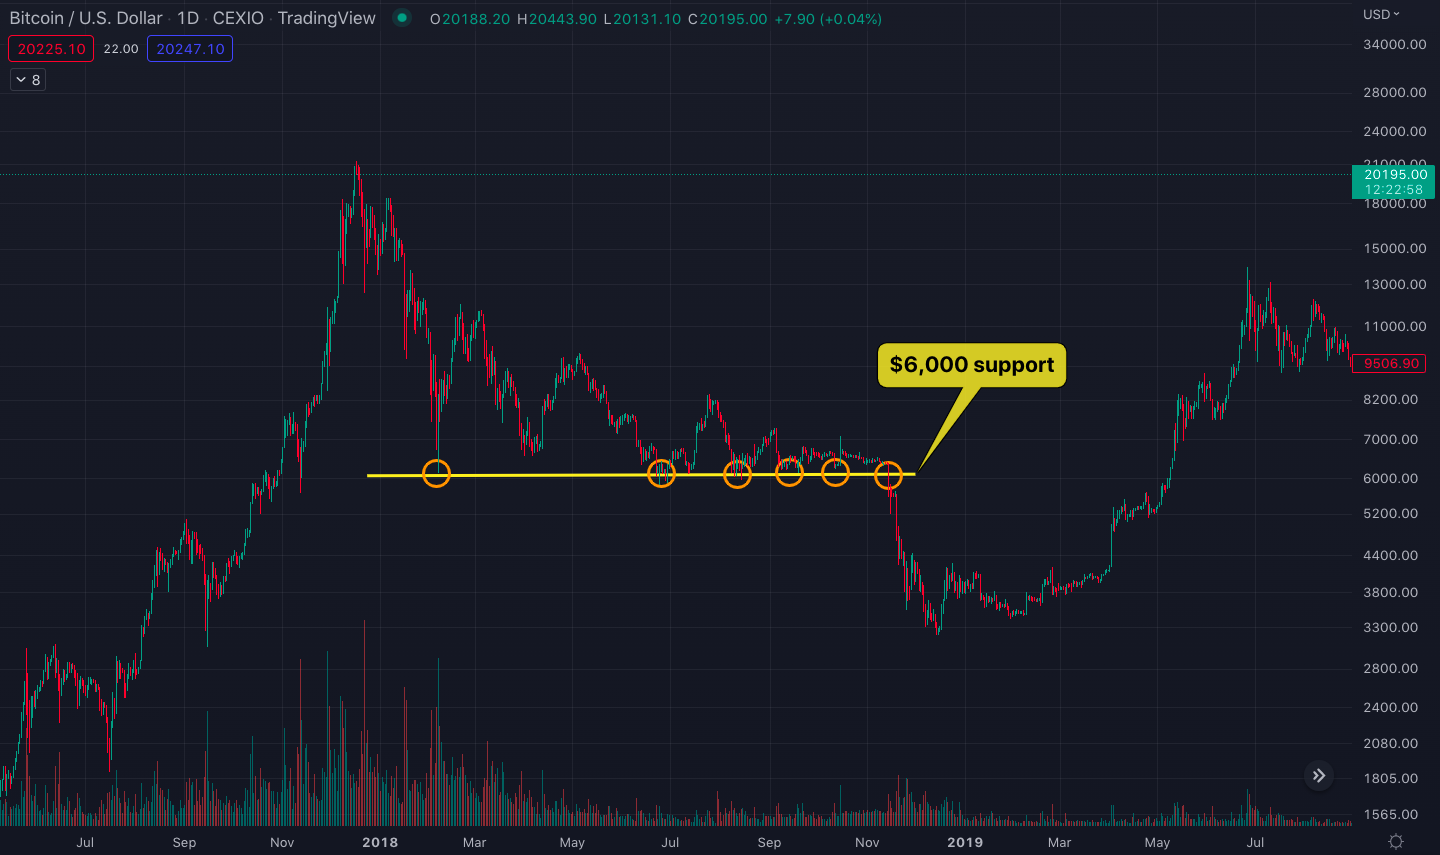
Bitcoin testing the $6,000 support multiple times in 2018 before breaking down to $3,000.
A more recent example of failed support following a flat consolidation period is the Shiba Inu ($SHIB) price chart below. After recording its all-time high in October 2021, the popular meme cryptocurrency entered a consolidation period in January 2022 and tightly ranged between $0.00002 and $0.00003 for almost four months.
The $0.00002 support was tested multiple times before finally breaking down from it in May.
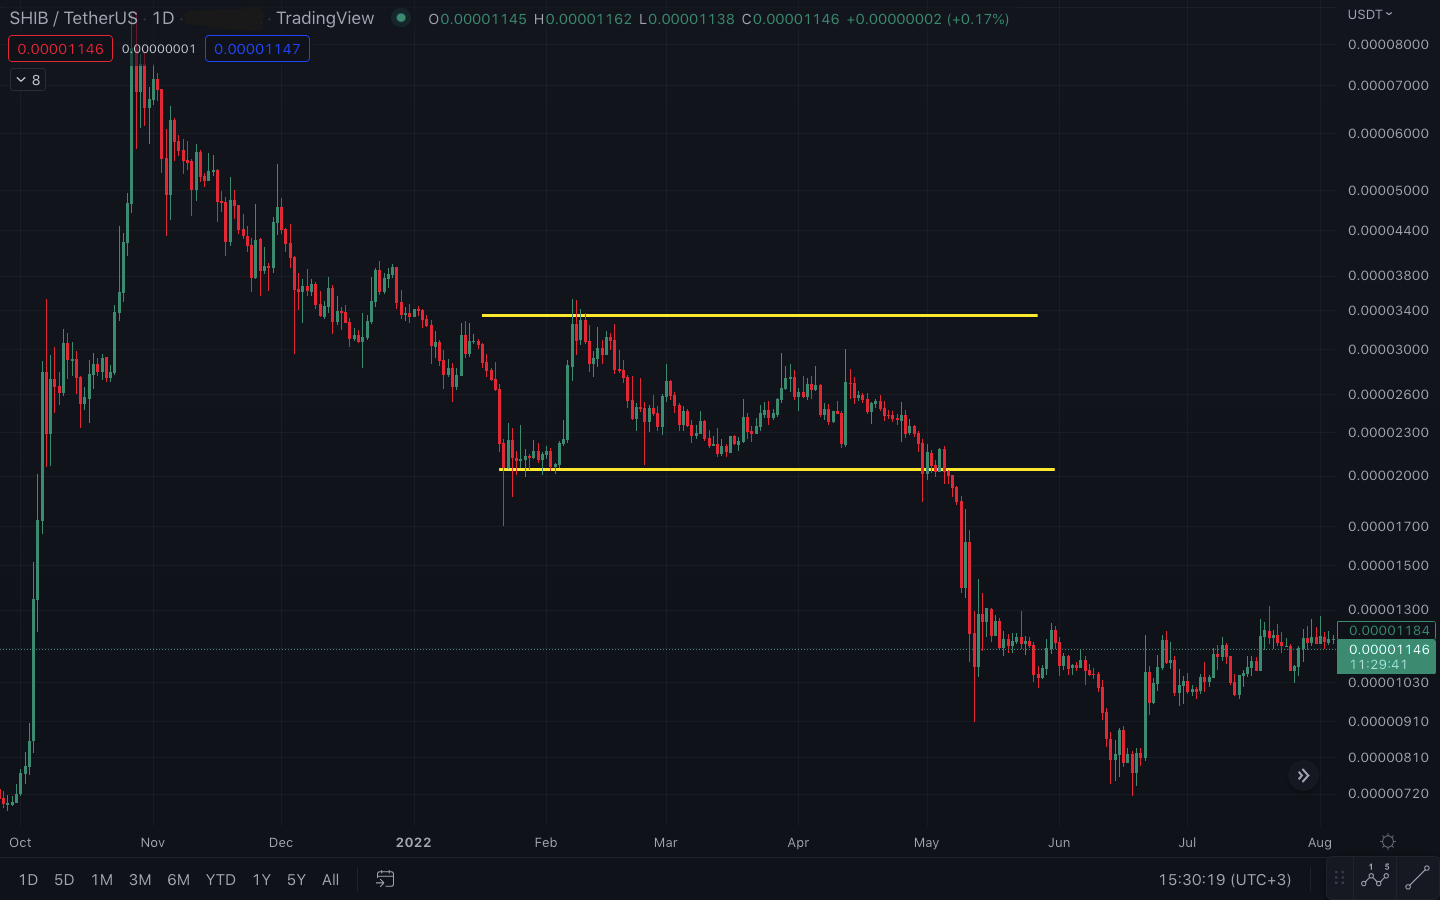
SHIB/U.S. dollar testing the $0.00002 multiple times before breaking it down.
Considering the above scenarios, it is possible that Bitcoin’s ranging between $18,500 and $22,700 during the last couple of months could well end with a crash to the $13,000 levels.
Falling resistance line
Bitcoin has been following a falling resistance line since early June. Every time Bitcoin hit this line, a substantial crash followed (see the chart below).
Bitcoin is nearing this resistance line for the fourth time now. While history suggests that such repeated testing can ultimately result in a crash, this time Bitcoin is approaching the line from the side, rather than advancing to the line with a surge.
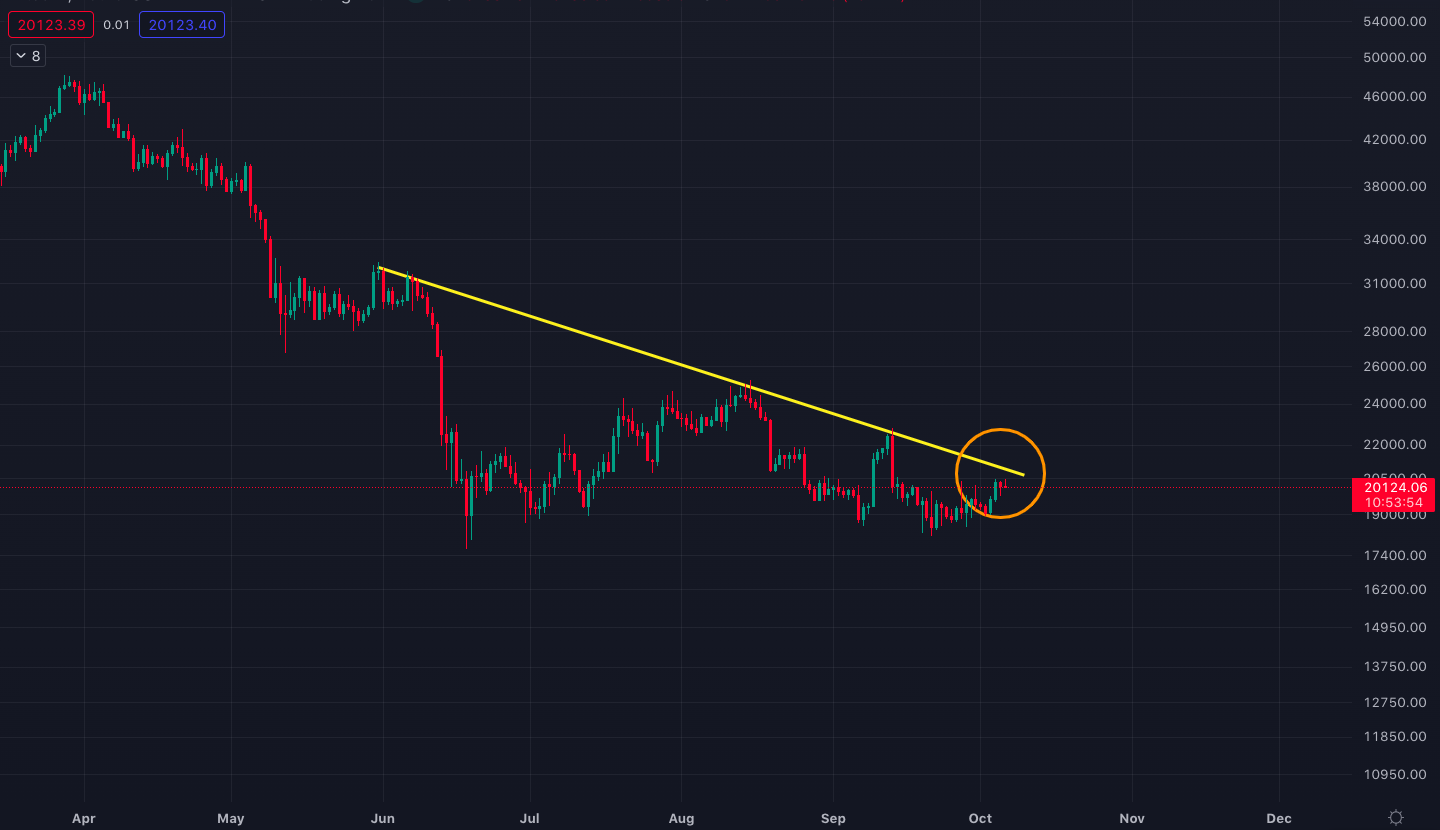
Falling resistance line for Bitcoin/U.S. dollar.
Flattened 100-day moving average line
The 100-day simple moving average (SMA) line has similarly acted as resistance during Bitcoin’s first two attempts to break above in August and September. The moving average line has flattened since then, which could suggest it’s turning into a weaker resistance.
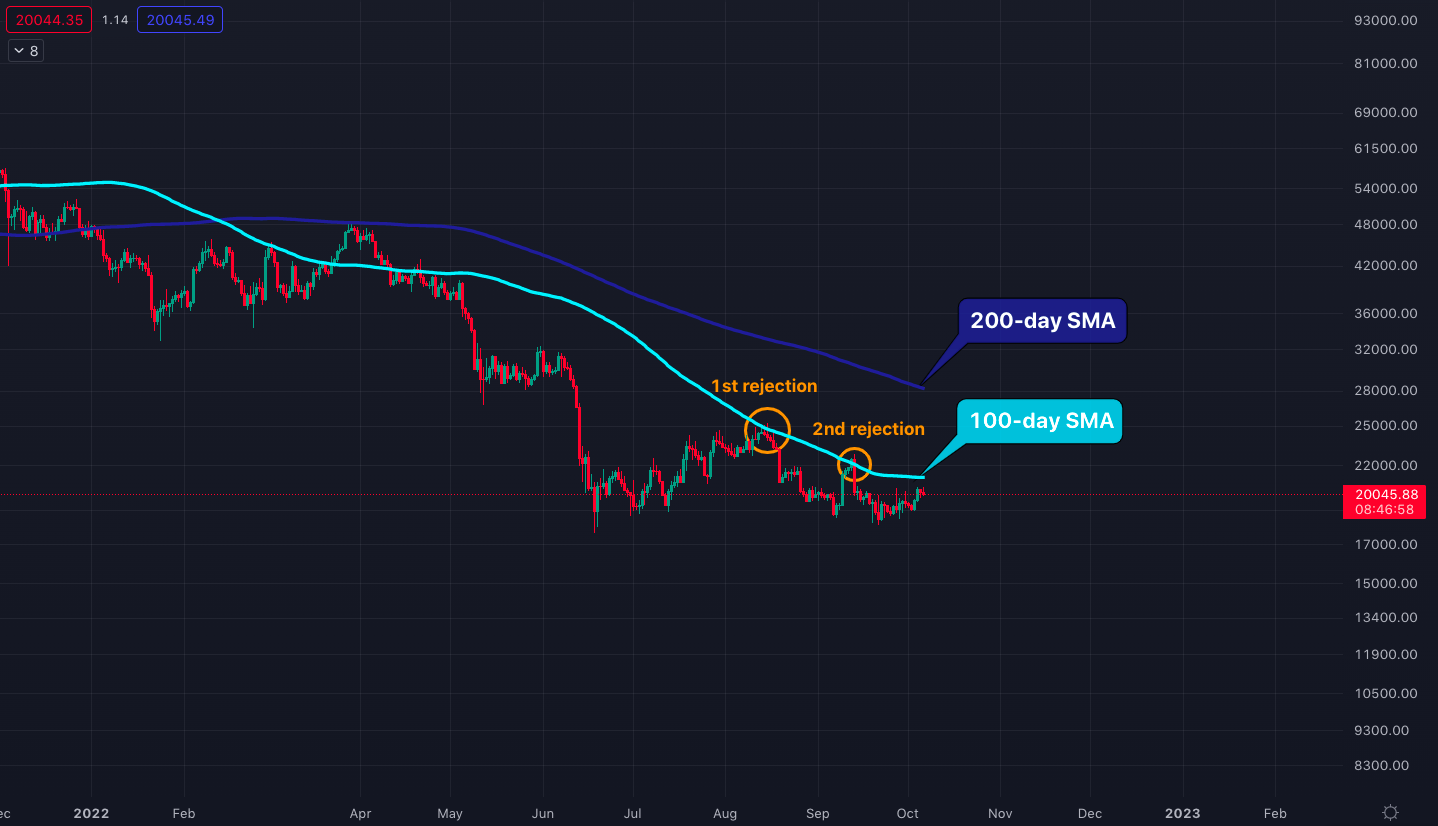
Daily Bitcoin/U.S. dollar price chart with the 100-day and 200-day SMA lines.
Flat moving average lines are typically easier to breach compared to falling moving average lines that hit the price candle at an angle. Considering this, Bitcoin could now have a higher chance to break above the 100-day SMA.
Being above the 100-day SMA could suggest strong momentum for an ongoing uptrend. If Bitcoin can close a few days above $21,100 (the current level of the 100-day SMA), a sustained rally could follow toward the 200-day SMA resistance at $28,000.
Put succinctly, Bitcoin is in no man’s land now, which means that a large move in either direction would not come as a surprise.
Is Chainlink on the verge of a new bull cycle?
Chainlink ($LINK) has been enjoying a number of positive catalysts recently. First, it announced a staking program expected to go live in December. Then, it received the SWIFT (Society for Worldwide Interbank Financial Telecommunication) partnership to co-develop an infrastructure that would directly connect traditional finance firms to different blockchain networks.
Chainlink has been one of the most widely-adopted blockchain projects in the crypto ecosystem. It is a data oracle network that connects smart contracts with off-chain data. This enables users to create smart contracts that can automatically settle real-life applications such as sports betting, logistics operations, and trade financing.
Staking on the Chainlink network is introduced as a means to increase user participation. The staking pool is initially expected to have 25 million LINK tokens, with plans to grow it to 75 million overtime. That would mean up to 15% of the token supply could go out of circulation, which would have the potential to subsequently create upside pressure on the LINK token price.
On the other hand, the SWIFT partnership is also highly critical because if the project becomes a success, it will constitute the first institutional application of data oracles on a global scale.
The SWIFT interbank messaging system is the most commonly used network for traditional cross-border fiat transactions, which connects over 11,000 banks around the world and handles trillions of dollars on a daily basis.
The project aims to connect SWIFT’s existing network to nearly every blockchain in the crypto ecosystem. This would allow traditional finance users access to both digital and traditional assets all on one network. The new network will specifically utilize Chainlink’s cross-chain interoperability protocol (CCIP), allowing SWIFT messages to instruct token transfers across nearly every blockchain network.
As a result, the technology will help to accelerate the adoption of distributed ledger technology to various large organizations that also use SWIFT.
Starter engine for the bull market
Chainlink was the starter engine of the last bull market, which resulted in a massive run in the middle of a domineering bear market. The rest of the market then followed suit in the following years.
The price of LINK increased by 25x in 2019 while most of the market was in the red (see the chart below).
Being a first mover, it ended up as one of the weakest performers in the 2021 bull run (still a whopping 400%) as its price had already soared to incredible heights by that time.
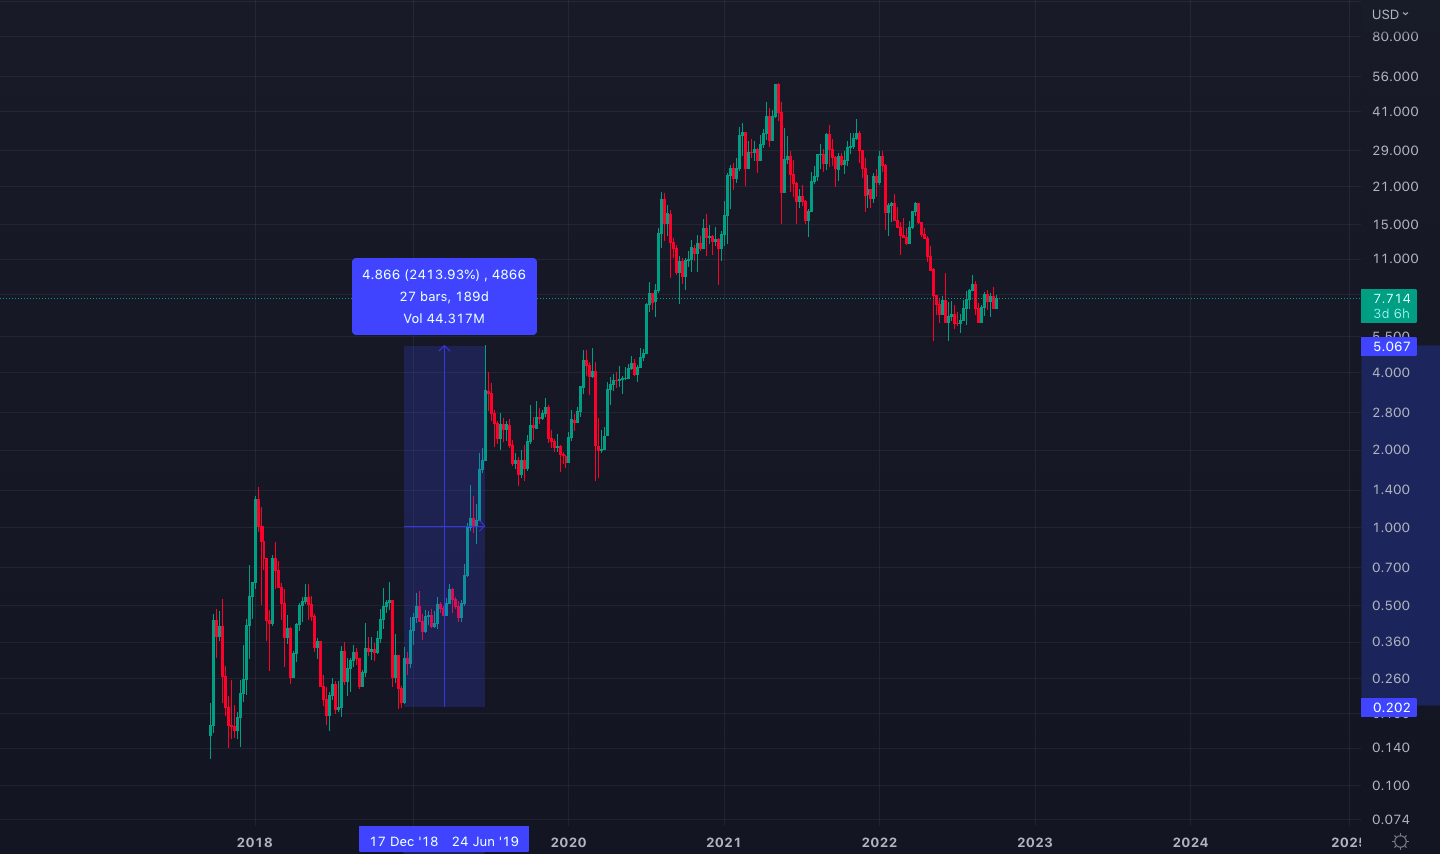
Chainlink/U.S. dollar price chart on the weekly time frame.
Currently, Chainlink is following an ascending triangle, which is typically a reversal formation to the upside. If it can decisively break above this triangle in the coming weeks (in other words, above $9.5), it could be on the verge of starting a new growth cycle.
Ascending triangle formation on the LINK/USD chart.
However, it is worth pointing out that Chainlink is highly overbought on the LINK/BTC trading pair as indicated in the weekly stochastic RSI chart below (framed in yellow).
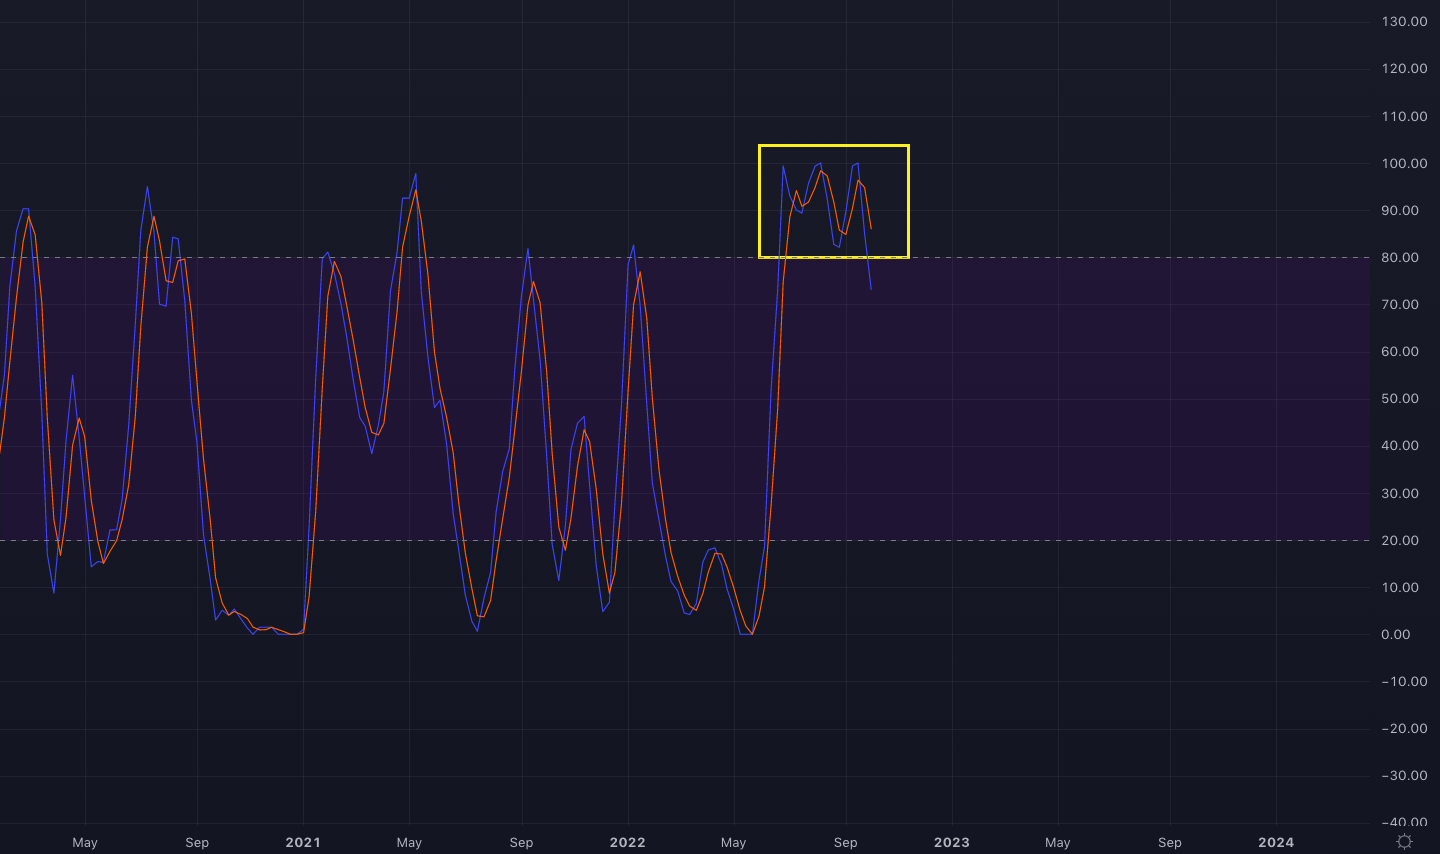
Weekly stochastic RSI chart for the LINK/USD trading pair.
Overbought weekly RSI in the BTC trading pair suggests that in the case of a new market uptrend, Bitcoin could move first in relation to Chainlink, and LINK’s dollar price could remain relatively stable. But once Bitcoin completes the bulk of its move, LINK could then follow suit by breaking above the ascending triangle and quickly climbing above $10.
0.1 DOGE per tweet?
Elon Musk has revived his original bid to purchase Twitter to avoid a potentially unfavorable courtroom decision. Following the announcement, Twitter’s stock jumped 22% and trading had to be halted due to a temporary supply crisis.
In the meantime, Musk had been discussing moving Twitter to the blockchain, eliminating all bots, and charging 0.1 DOGE to tweet or retweet, according to a Reddit thread. The spreading of this rumor caused a double-digit gain in the price of Dogecoin.
Dogecoin ($DOGE) has been following a very flat trend in its Bitcoin trading pair since March. If Bitcoin makes a significant uptrend, DOGE could see a bounce in its BTC trading pair (i.e. adding further gains compared to Bitcoin) as long as positive news keeps coming from the Twitter side.
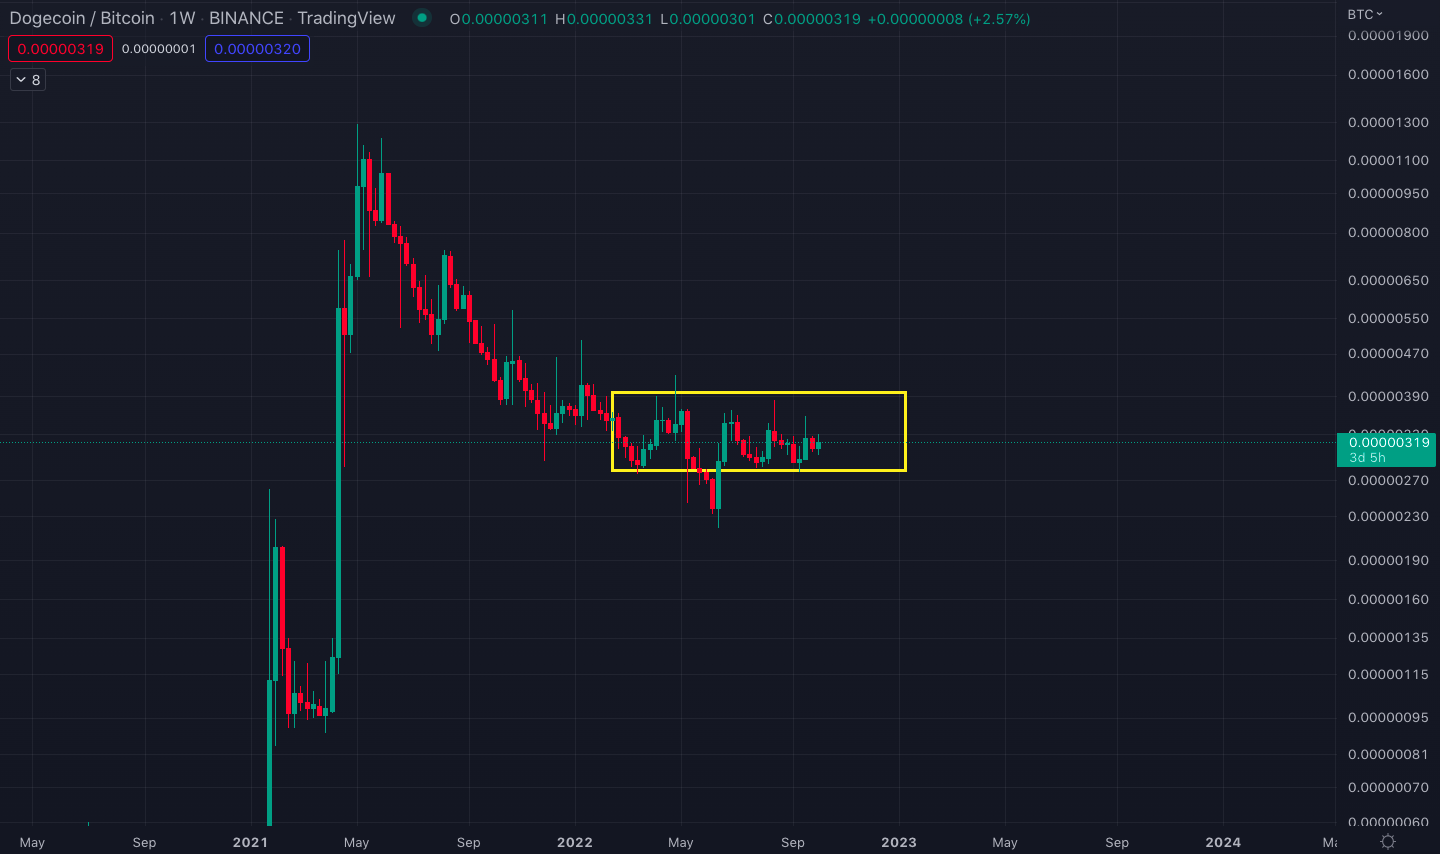
Horizontal ranging of the DOGE/BTC trading pair (framed in yellow).
A potential win for XRP
A U.S. District Court overruled the Security and Exchange Commission’s (SEC) second attempt to withhold the documents relating to former Division Director William Hinman, who said Bitcoin and Ether are not securities.
Ripple Labs considers this decision as a key piece of evidence for the SEC’s ongoing case against the XRP token. Amid recently filed motions for a summary judgment with the Court, the XRP community sees the decision as another confirmation that Ripple Labs could potentially win the case.
If Ripple Labs wins the case, XRP could again become available for U.S. customers. Subsequently, this could increase the liquidity of the token and positively impact the price.
Last month, XRP’s price surged after a long standstill, from $0.32 on September 16 to a high of $0.55 on September 23 in response to positive expectations regarding the resolution of the lawsuit.
The price has been consolidating between $0.43 and $0.50 since then and recently reached the $0.51 resistance once again. The current view of the XRP/USD chart on shorter time frames is far from a bull trap formation since the price made a lower high price by a higher low (see the chart below).
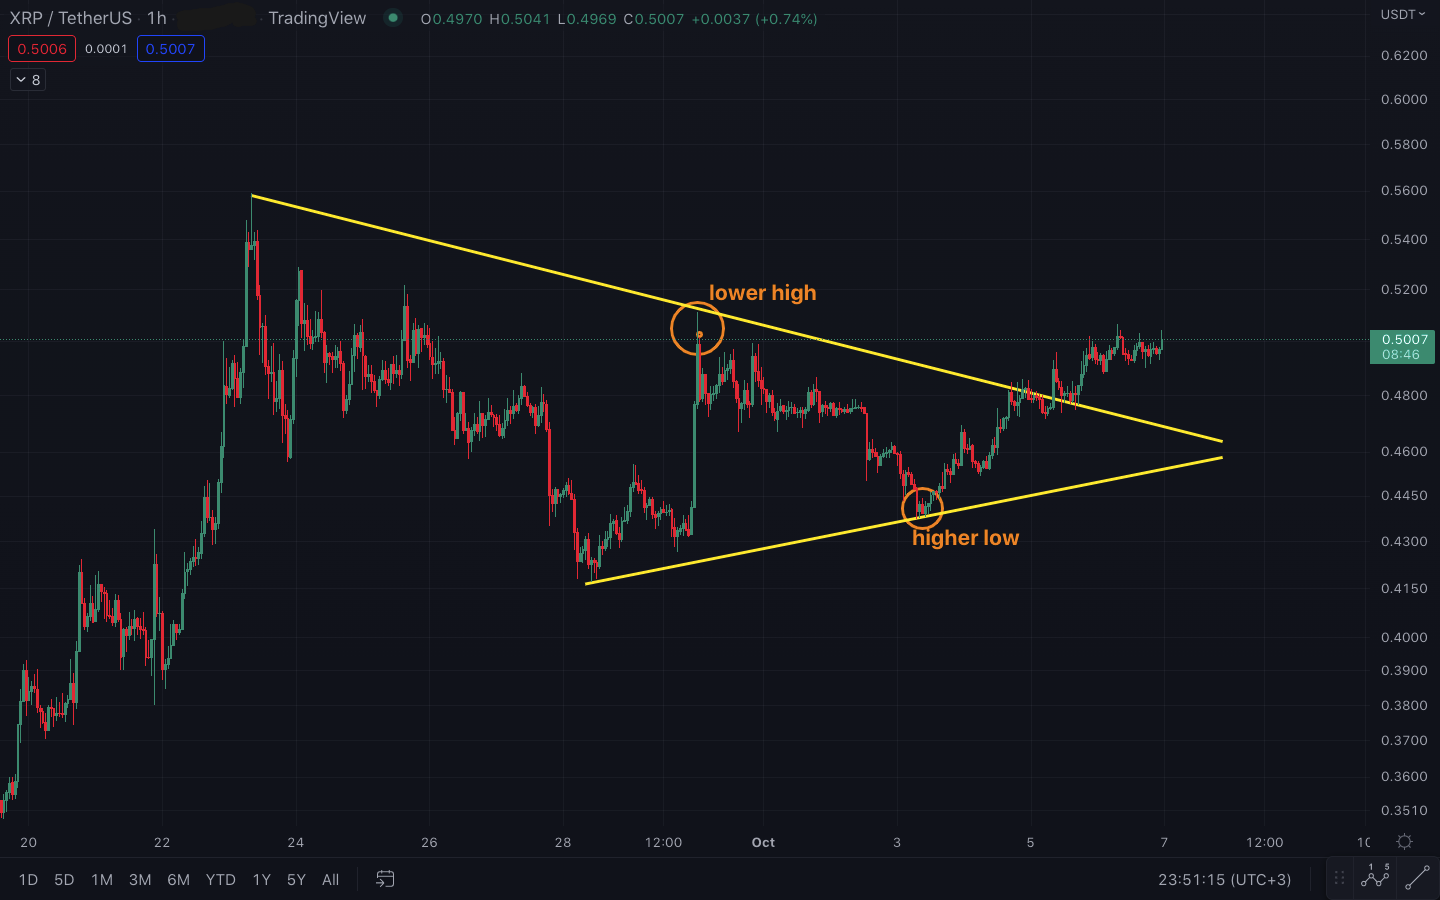
XRP/USD price chart on the hourly time frame.
In addition, XRP is currently breaking out of a symmetrical triangle as you can observe in the chart above. So if XRP can close a day above $0.51, it could quickly advance to the major $0.80 resistance.
Tune in next week, and every week, for CEX.IO’s latest Crypto Ecosystem Update. For more information, head to the Exchange to check current prices, or stop by CEX.IO University, to expand your crypto knowledge.
Disclaimer: Information provided by CEX.IO is not intended to be, nor should it be construed as financial, tax or legal advice. The risk of loss in trading or holding digital assets can be substantial. You should carefully consider whether interacting with, holding, or trading digital assets is suitable for you in light of the risk involved and your financial condition. You should take into consideration your level of experience and seek independent advice if necessary regarding your specific circumstances. CEX.IO is not engaged in the offer, sale, or trading of securities. Please refer to the Terms of Use for more details.