
The $19,000 support level has worked like a charm so far for Bitcoin following its local bottom at $17,600 on June 18.
$19,000 constitutes the right shoulder of a possible inverse head and shoulders pattern currently forming for Bitcoin, as well as the bottom support of a descending channel. Due to this, $19,000 is a very critical level to watch for Bitcoin in the upcoming days.
On July 13, the June CPI data will be announced in the U.S. while the Fed will announce its July rate hike decision on July 27. These two dates carry a lot of significance in determining Bitcoin’s next direction so whether the $19,000 support will hold may be confirmed on one of those dates.
In the meantime, the U.S. Dollar Index ($DXY) has climbed back above its infamous 104 resistance level, which has continuously acted as resistance since January 2017. Since all risk assets are generally correlated against cash, a decisive monthly close above 104-105 could cause Bitcoin to lose its $19,000 support.
On the bright side, there has been a substantial drop in the bond market yields following the June 15 top, which was triggered by the Fed’s more aggressive bond purchases. If the bond yields remain calm throughout the summer, it may allow the runway that Bitcoin needs to make a nice summer rally.
In case of an uptrend, the $28-$32,000 level will likely act as significant resistance since that price range was the major bull market support that held valid for the entire 2021. Breaking down from such major support could make it difficult to break through upon the first attempt.
And even if we hit the $28,000-$32,000 resistance levels, the DXY may remain one of the biggest threats as it is on the verge of breaking a multi-year resistance. The more a long-term resistance is tested, the stronger the breakout could be when that resistance turns to support.
Bitcoin price analysis
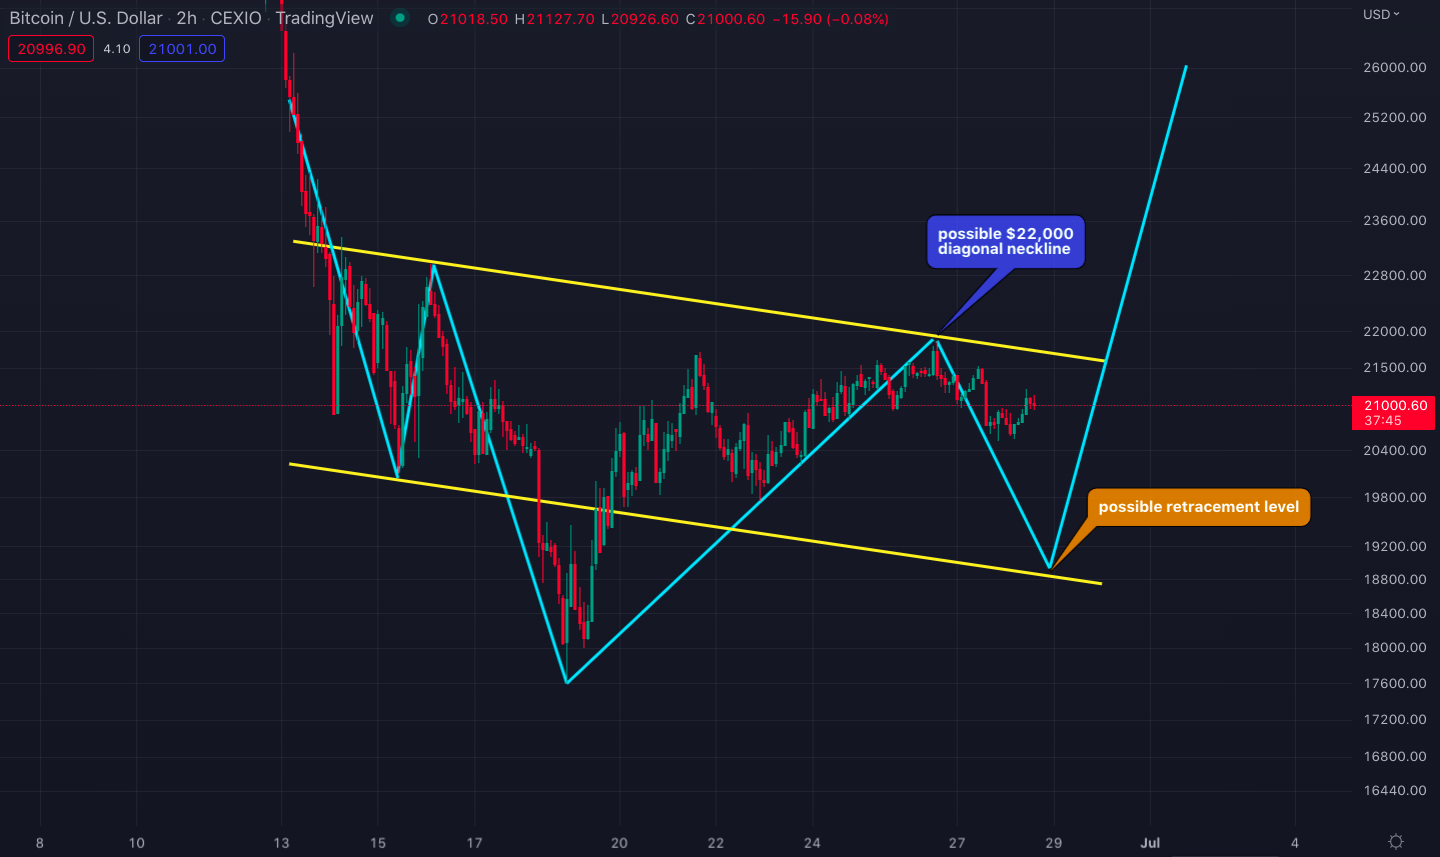
Bitcoin has been forming an inverse head and shoulders pattern with diagonal necklines at $23,000 (June 16 high) and $22,000 (June 26 high). This makes the $19,000 level a possible right shoulder.
- Current breakout level at $21,000
In last week’s ecosystem update, we provided the below chart, which showed $19,000 as crucial support for Bitcoin.
Bitcoin’s inverse head and shoulders formation from last week’s blog
For the ongoing inverse head and shoulders pattern to eventually play out, Bitcoin needs a daily close above $21,000 with a larger volume than the one on the left shoulder (see the chart below).
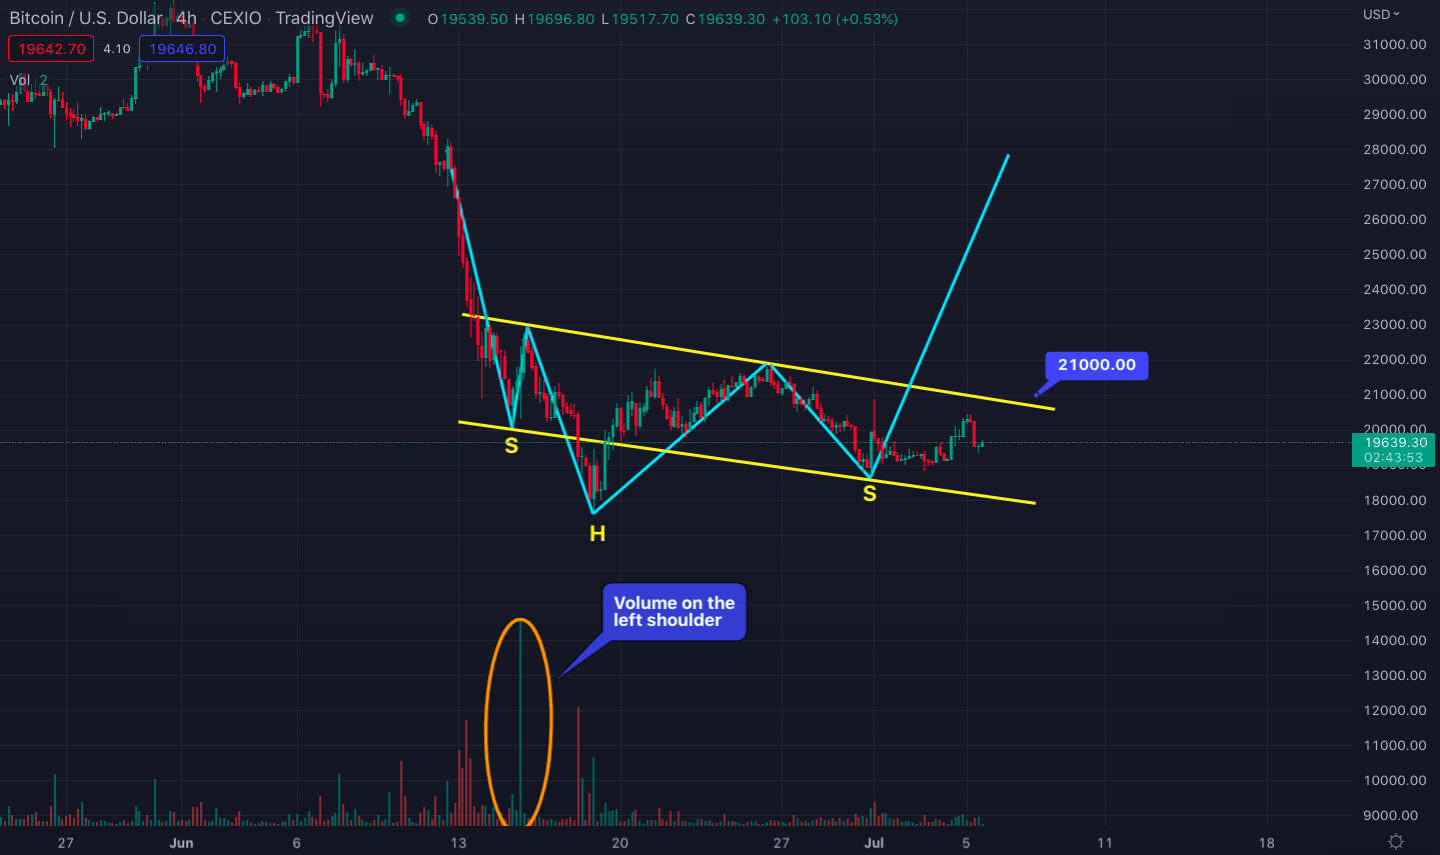
Bitcoin chart with the ongoing inverse head and shoulders formation. Source: Tradingview
Next week’s U.S. CPI announcement can likely dictate the fate of the above pattern. Summer times are typically associated with a loosening in consumer demand which could settle back the yearly CPI rate a bit. However, if the opposite happens, the U.S. Dollar Index and U.S. bond yield charts will be very critical to watch.
- The dollar index breaking out
The U.S. Dollar Index (DXY) measures the value of the U.S. Dollar relative to a basket of 6 other fiat currencies: The Euro, Japanese Yen, Pound Sterling, Canadian Dollar, Swedish Krona, and the Swiss Franc.
In our context, DXY represents the value of cash so if DXY increases, then assets measured in U.S. Dollars would most likely drop.
DXY printed a very strong green candle on July 5 and closed the day with a 1.4% gain. It is currently trying to break out of the rising wedge (the two converging yellow lines in the below candlestick chart) that it has been following since May 2022.
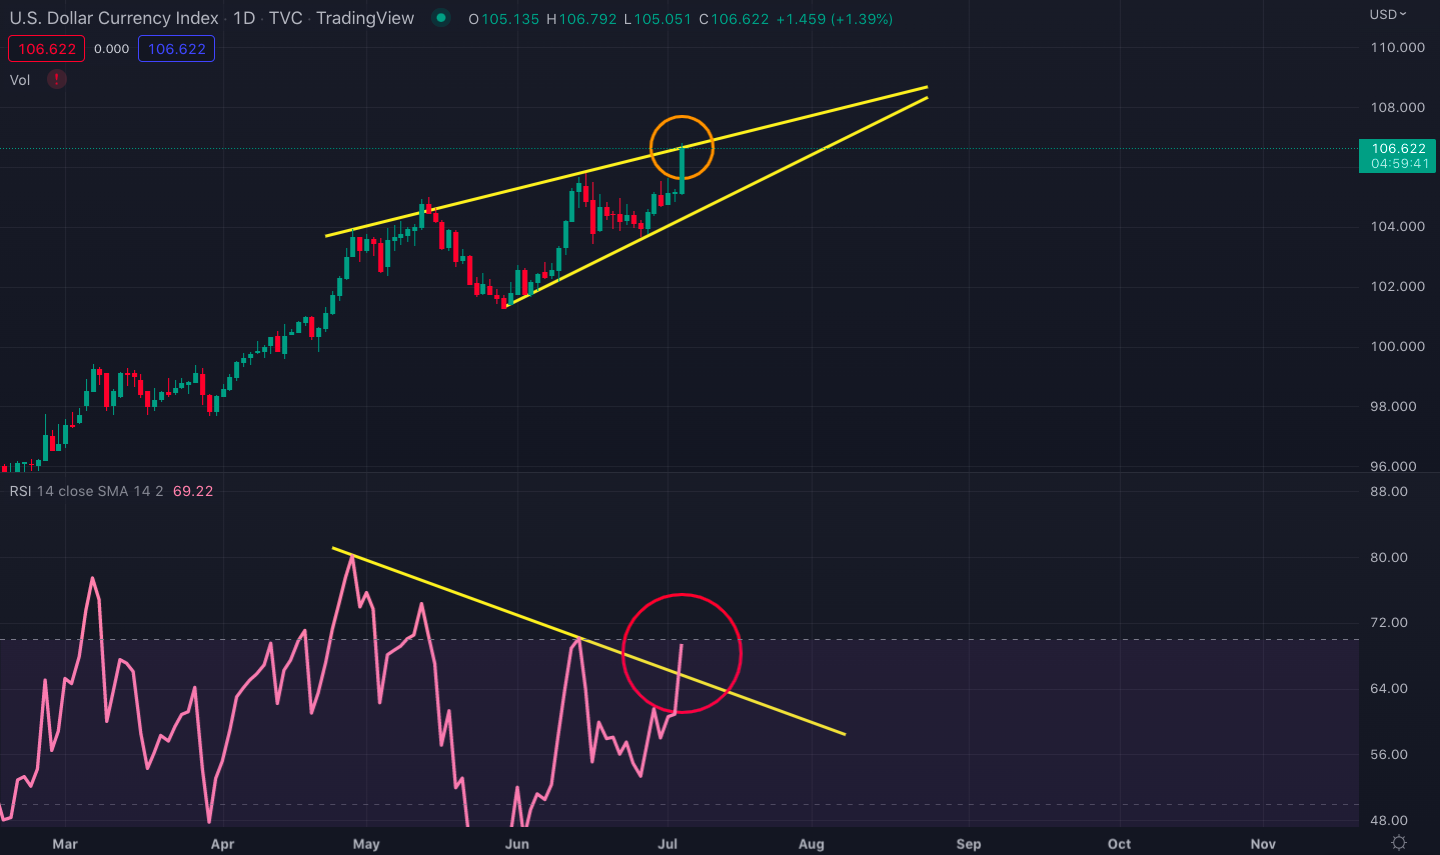
U.S. Dollar Index price chart with the rising wedge and RSI divergence
Rising wedges often end up breaking to the downside especially when the price has a negative divergence with the relative strength index (RSI). However, in the above chart, the divergence from mid-June is about to become void as July 5’s RSI level broke and closed above the descending resistance line.
104 has been a crucial resistance level for the dollar index since January 2017. The more a long-term resistance is tested, the more violent can the upwards move be if that resistance turns into support.
Since all risk assets are generally correlated against cash, a decisive monthly close above 104-105 could cause Bitcoin to lose its $19,000 support.
- Crude oil’s collapse
The price of crude oil collapsed on the same day of the DXY’s surge (circled in orange in the chart below). Although crude oil may look irrelevant to the U.S. Dollar Index as well as to the cryptocurrency market, this commodity has often been the precursor to giant market moves in currency markets.
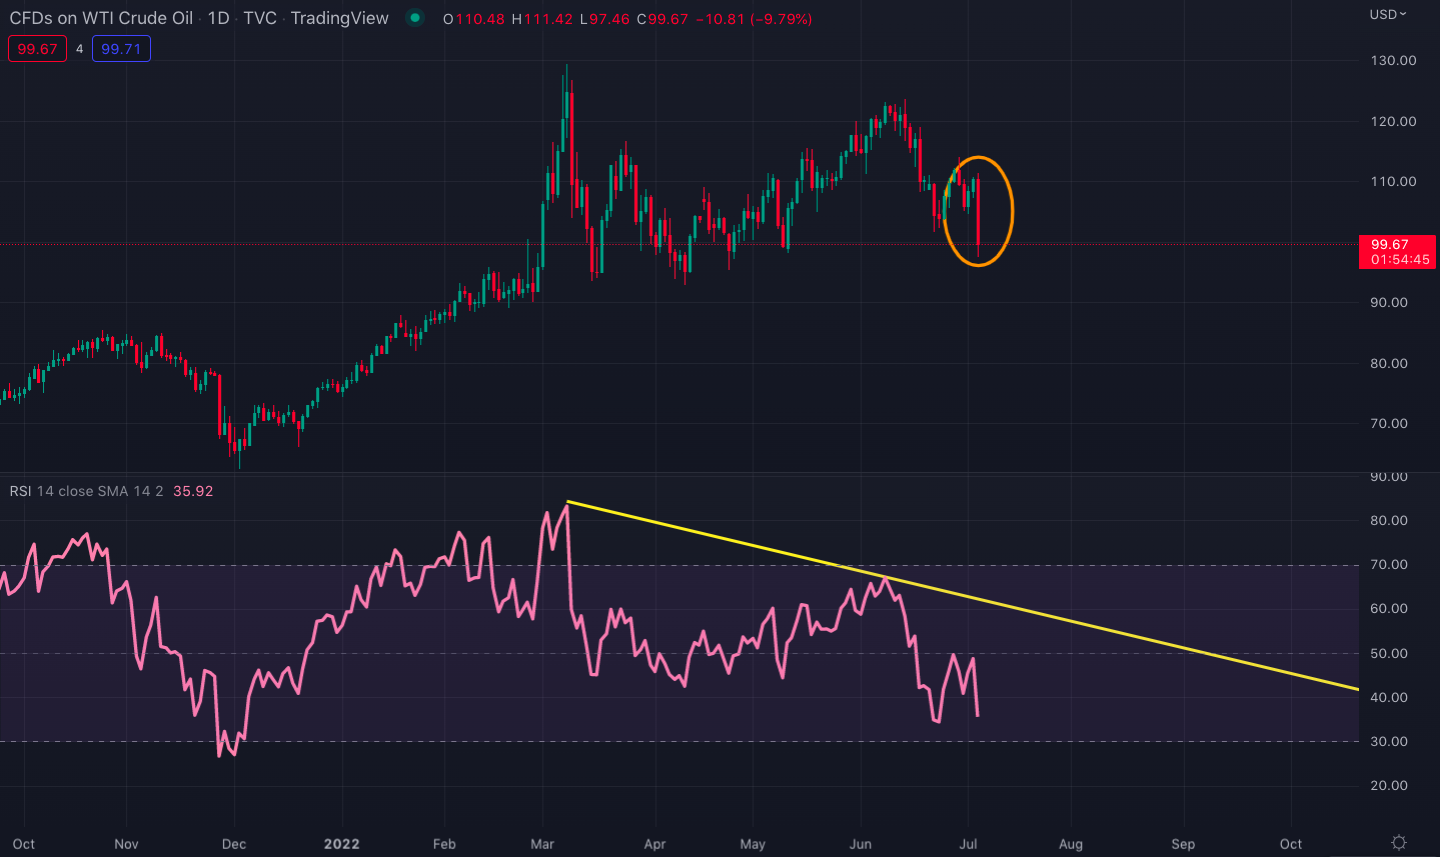
Crude oil price chart on a daily time frame
Sharp drops in crude oil prices relate to recession fears because recessions create downside pressure on the demand for basic commodities.
A recession also typically creates a higher demand for cash and drops the growth prospects for stock companies. All of these account for the strengthening dollar, the weak stock and cryptocurrency market, and finally the crashing crude oil market.
In that sense, the collapse of crude oil on July 5 should be taken with a lot of caution. Crude oil should hold the $93 level as support for Bitcoin to hold the $19,000 level.
If the $93 support fails for crude oil, the next major support is down at $76.
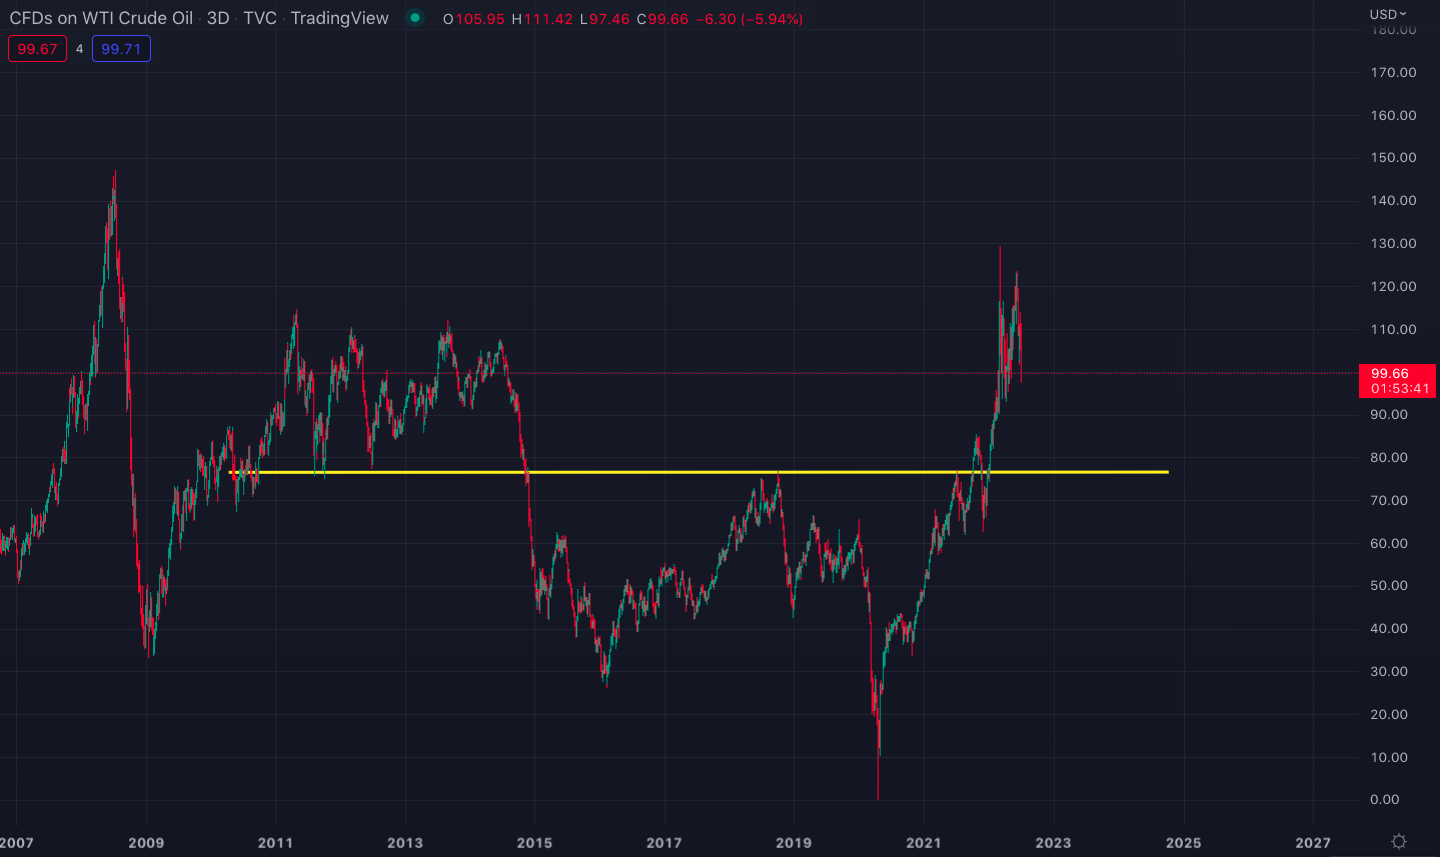
The horizontal support line for crude oil at $76
- U.S. bond yields
As a positive side note amid a generally gloomy market outlook, U.S. bond yields have dropped substantially following their June 15 tops. Even better is they kept dropping on the crypto trading days that stock markets and cryptocurrencies recorded losses.

2-year U.S. bond yield chart on a daily time frame
A drop in bond yields means there is an increasing demand for bonds. On the other hand, stock markets are a derivative of the bond markets and cryptocurrencies have strongly been correlated to the stock markets. Considering this, increases in bond prices (and thus decreases in yields) can be considered as positive divergence while stocks and cryptocurrencies drop in value.
The dropping U.S. bond yields may be the last resort for at least a short-term uptrend for Bitcoin and other cryptocurrencies. In that sense, it is very critical for the bond yields to remain stable in the midst of a surging dollar index and a collapsing crude oil price.
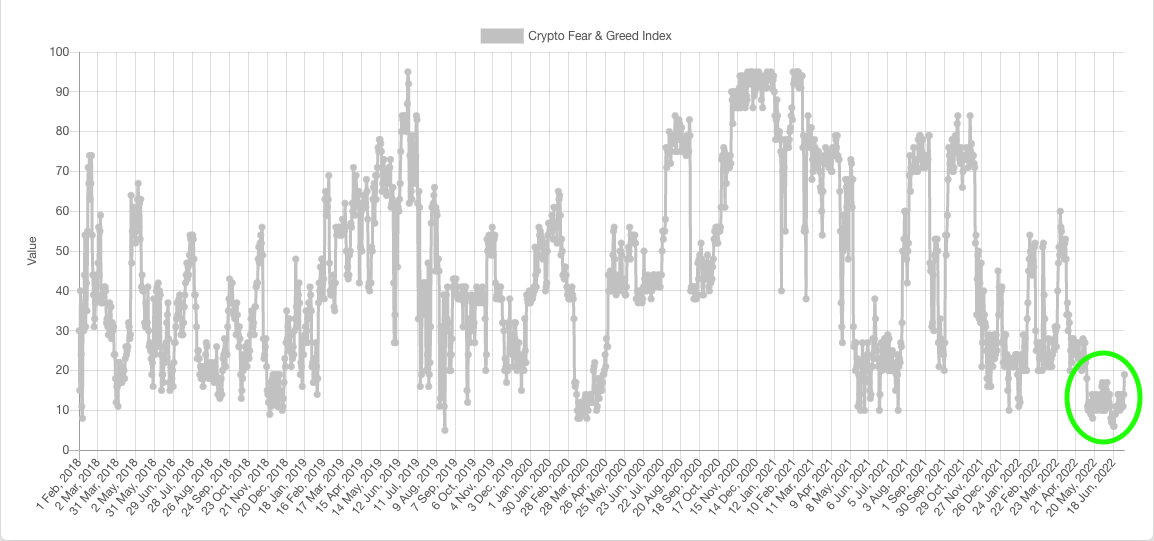
- Bitcoin Fear & Greed Index
The Bitcoin Fear & Greed Index bottomed at 10 back in June and has held that level as support since then. This level has historically dictated the market bottoms for Bitcoin, at least in the short term.
When you take a look at the fear and greed index chart below, you will see that there is a strong structure forming between the 10-20 levels and that the index value is about to break out of that level.
Three Arrows Capital’s bankruptcy
One of the largest crypto hedge funds, Three Arrows Capital (3AC) filed for Chapter 15 bankruptcy in a New York federal bankruptcy court just a few days after a British Virgin Islands (BVI) court ordered the liquidation of its BVI branch assets.
The liquidation order came after 3AC defaulted on a $650 million loan from digital asset brokerage Voyager Digital on June 27.
The BVI court order was quite unexpected for 3AC so this time they wanted to act early by filing for bankruptcy in their largest operating jurisdiction. Chapter 15 bankruptcy legally protects the U.S. assets of insolvent foreign debtors from creditors in the U.S. Non-U.S. companies use Chapter 15 to block creditors who want to file lawsuits in the United States. The list of 3AC’s creditors is reported to go well beyond large institutions.
Tides turned against 3AC when Terra collapsed in May because the company had a $560 million long position in Terra, which went to zero in a few days. This was followed by the company’s failure to pay its Voyager Digital debt.