
Every week, CEX.IO closely studies the cryptocurrency ecosystem in an effort to understand its next possible direction. In the 29th edition of the Crypto Ecosystem Update, we uncover three potential scenarios for Bitcoin: A crash to $12,000, a whipsaw to the $29,000 range, and a short-term drop to $18,000.
Additionally, we provide a brief discussion about what kind of effect the Ethereum Merge could have on the stablecoin market.
Read along for in-depth price analyses and enjoy reviews of correlated markets to help you make the most informed decisions along your crypto journey.
Bitcoin in the “limbo range”
It has been another tough week for financial markets with sell-offs across the board. The Euro has once again traded below the U.S. dollar parity as the European energy crisis worsens, and the DXY Dollar Index surged to a twenty-year high at 109.50.
At the Jackson Hole meeting on August 26, the U.S. Federal Reserve governors expressed their continued hawkish stance on inflation which triggered an immediate and large sell-off in Bitcoin. Following Chairman Powell’s comments, the price of Bitcoin broke down from the rising channel that it followed since the June crash and lost its entire momentum.
Bitcoin fell from $22,000 on Friday, August 26 to a low of $19,500 on Tuesday, August 30. The alpha cryptocurrency is in a very tricky situation right now since there is no support below June’s $17,600-low down until $12,000.
Many people in the market believe that $17,600 was the absolute bottom for Bitcoin while others fear a greater downside due to the ongoing economic and geopolitical anxieties.
So which side will win this tug-of-war?
Choppy market between $19,500 and $20,500
To trap out as many people as possible from both sides, there has been a choppy market this week with the price ranging tightly between $19,500 and $20,500. This is such a crucial band that breaking below it could scare many investors out while breaking above $22,000 could open the gates for a much anticipated Bitcoin rally.

The $19,500-$20,500 range for Bitcoin following the Jackson Hole crash. Source: Tradingview
The $12,000 scenario
To drop to as low as $12,000, it could be necessary for Bitcoin to climb up first and validate the previous support line of the rising channel as resistance (now at $22,000). Getting rejected at major resistance levels can be quite demoralizing for market participants. Historically, we’ve seen large crashes often precede such rejections.

Bitcoin price chart with the support line of the parallel rising channel (circled in yellow).
The $29,000 scenario
The breakdown from the parallel rising channel could alternatively act as a “whipsaw” which means a false breakout. In a whipsaw, the price temporarily breaks up or down from a formation to force traders out, before moving back to the opposite direction shortly after.
If Bitcoin consolidates sideways in the upcoming days while its short-term momentum indicators (RSI and MACD) create higher lows, the probability of a whipsaw could increase. This has to be confirmed with the price moving back into the rising channel and closing a week inside the channel.
If the whipsaw happens and Bitcoin makes it back into the channel, this could be the start of a strong rally to the 2021 bull market support at $29,000.
The $18,000 scenario with the $3,850 S&P target
We cannot know for certain if the price of Bitcoin will see any of these scenarios. However, looking at the S&P 500 price chart, one can argue that $18,000 could be a likely target for Bitcoin in the short term.
The S&P 500 stock index has been Bitcoin’s most closely correlated asset both in the short and long term. They crashed simultaneously on August 26 following Powell’s speech and since then, Bitcoin’s every attempt to climb above $20,500 has been invalidated with a drop in the S&P price.
You can observe in the chart below the similarity between Bitcoin and the S&P 500 index. However, it’s important to note the exception where the S&P 500 broke down from two different channels while Bitcoin held onto the same channel that it landed. This means the price of Bitcoin held on slightly stronger than the S&P 500.

Bitcoin/U.S. Dollar and the S&P 500 price charts on the hourly time frame.
The S&P 500 index broke down from two different bear flags following the Jackson Hole meeting:

S&P 500 price chart with the bear flag target prices.
A bear flag target price is typically estimated by taking the length of the retracement that precedes the ascending channel (the flag) and extrapolating the same length below a possible breakdown point (the two red lines in the chart above).
Considering that, both bear flags would have a similar target price at around $3,850.
$3,850 holds further significance as the support line of a longer-term rising channel also passes from this level:

Historically speaking, a 3% drop in the S&P 500 (from $3,960 to $3,580) could correspond to an approximately 10% decrease in Bitcoin, which would bring Bitcoin’s price down to $18,000.
In addition, if Bitcoin is currently in a three-wave zigzag correction with wave A from $25,000 to $20,800, we could be in wave C now which would also have a target price of $18,000.

Bitcoin/U.S. Dollar price chart with the A-B-C zigzag wave.
Mining Difficulty Jumps by 9%
Bitcoin mining difficulty jumped by 9.24% (from 28.35T to 30.97T) on a single day on August 31. This has been the largest jump since January 2022.

Bitcoin mining difficulty chart. Source: CoinWarz
The catalyst behind the sudden increase is the Bitcoin miners in Texas turning their machines back on after a sustained heat wave forced a widespread switch-off during July and August.
Difficulty measures how much energy Bitcoin miners have to consume before putting a new bitcoin into circulation. In other words, a higher difficulty level means a lower chance of producing a new bitcoin.
Miners make a profit by retaining the bitcoins they mine. But if the difficulty becomes too high, the energy cost could begin exceeding the cumulative value of the bitcoins they earn.
In light of the recent difficulty increase, consultancy firm Blocksbridge cautioned miners that using older equipment for Bitcoin mining could cause serious losses if the price of Bitcoin resumes its downtrend.
As older equipment is typically less efficient, miners who do not replace their equipment could eventually go out of business unless the price of Bitcoin recovers.
Historically, Increased mining difficulty has often preceded Bitcoin uptrends since the rising cost of producing Bitcoin eventually reflects itself in the exchange price. However, as is usually the case with most on-chain indicators, there can be long lags until the anticipated price movement happens. In this case, miners could produce Bitcoin at a loss for years.
Spent Output Profit Ratio rejected at 1.0
On the contrary, the Spent Output Profit Ratio (SOPR) has started to show a different picture for Bitcoin compared to mining difficulty.
SOPR calculates the ratio of realized profit or loss for all bitcoins moved on-chain.
In the past, whenever the SOPR hovered above 1.0 for an extended period, it brought a massive bull run for Bitcoin. The historical 2016/17 bull run (from $300 to $20,000), the giant 2019 bear market rally (from $3,000 to $14,000), and the last bull run in 2021 (from $10,000 to $60,000) all mark the periods when the SOPR was consistently above 1.0 (see the chart below).
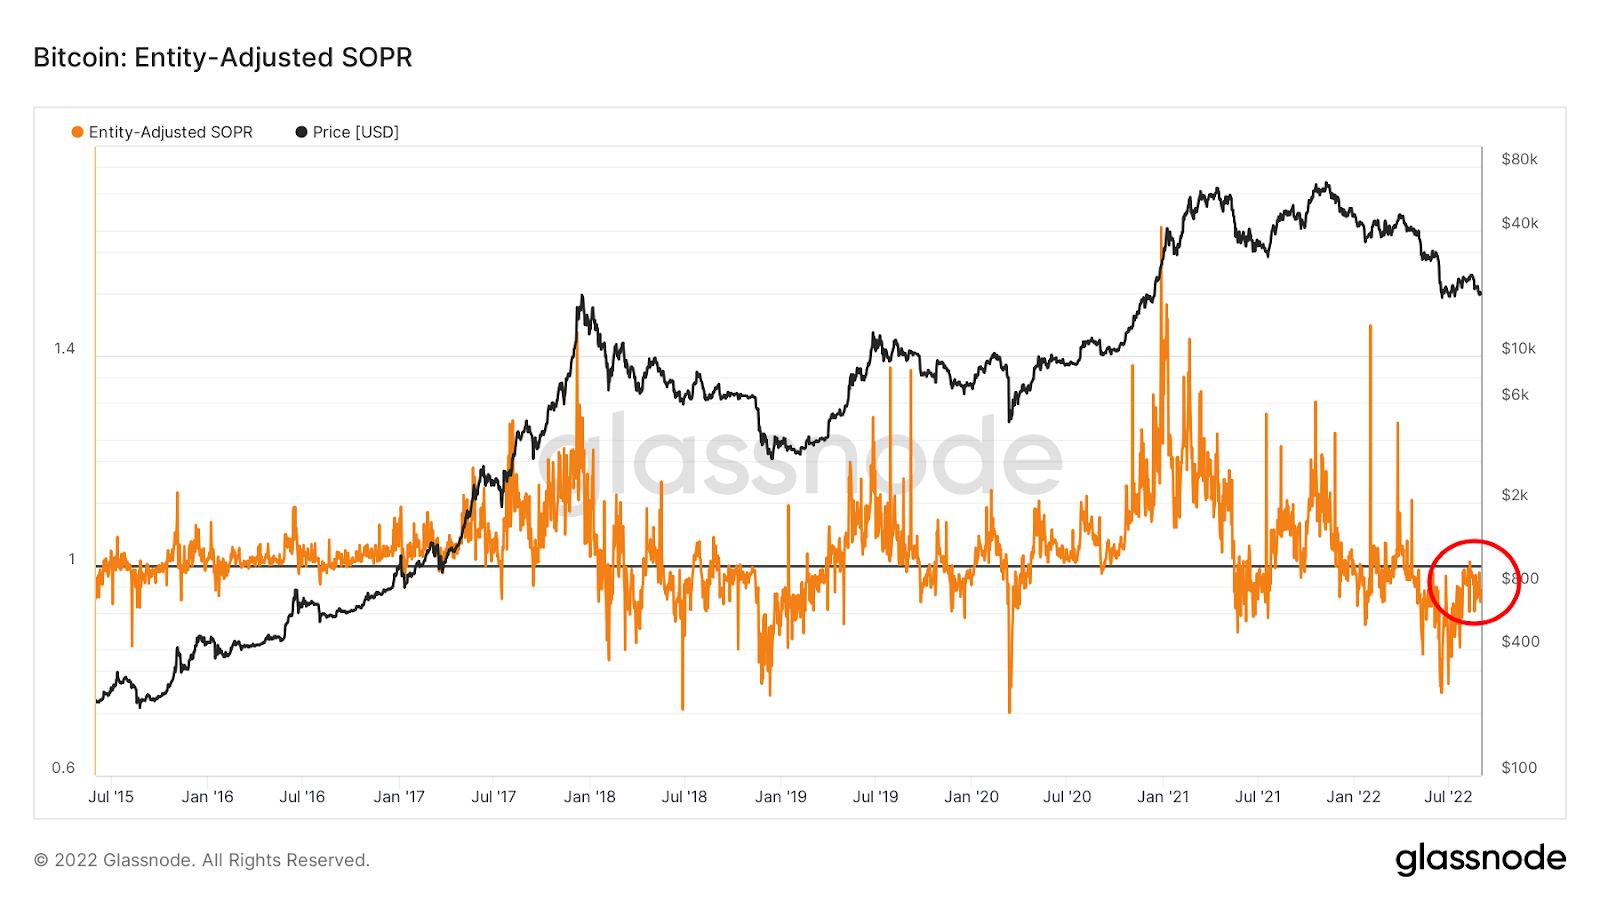
Entity-adjusted SOPR & Bitcoin price chart. Source: Glassnode
The chart above displays the entity-adjusted SOPR, which discards transactions between addresses of the same entity (“in-house” transactions) and thus provides a superior signal compared to the raw SOPR.
The entity-adjusted SOPR has been flirting with the 1.0 resistance since late July (circled in red on the chart above) exciting Bitcoin bulls for a new growth cycle. However, the ratio started to break downwards recently as you can observe in the chart below.
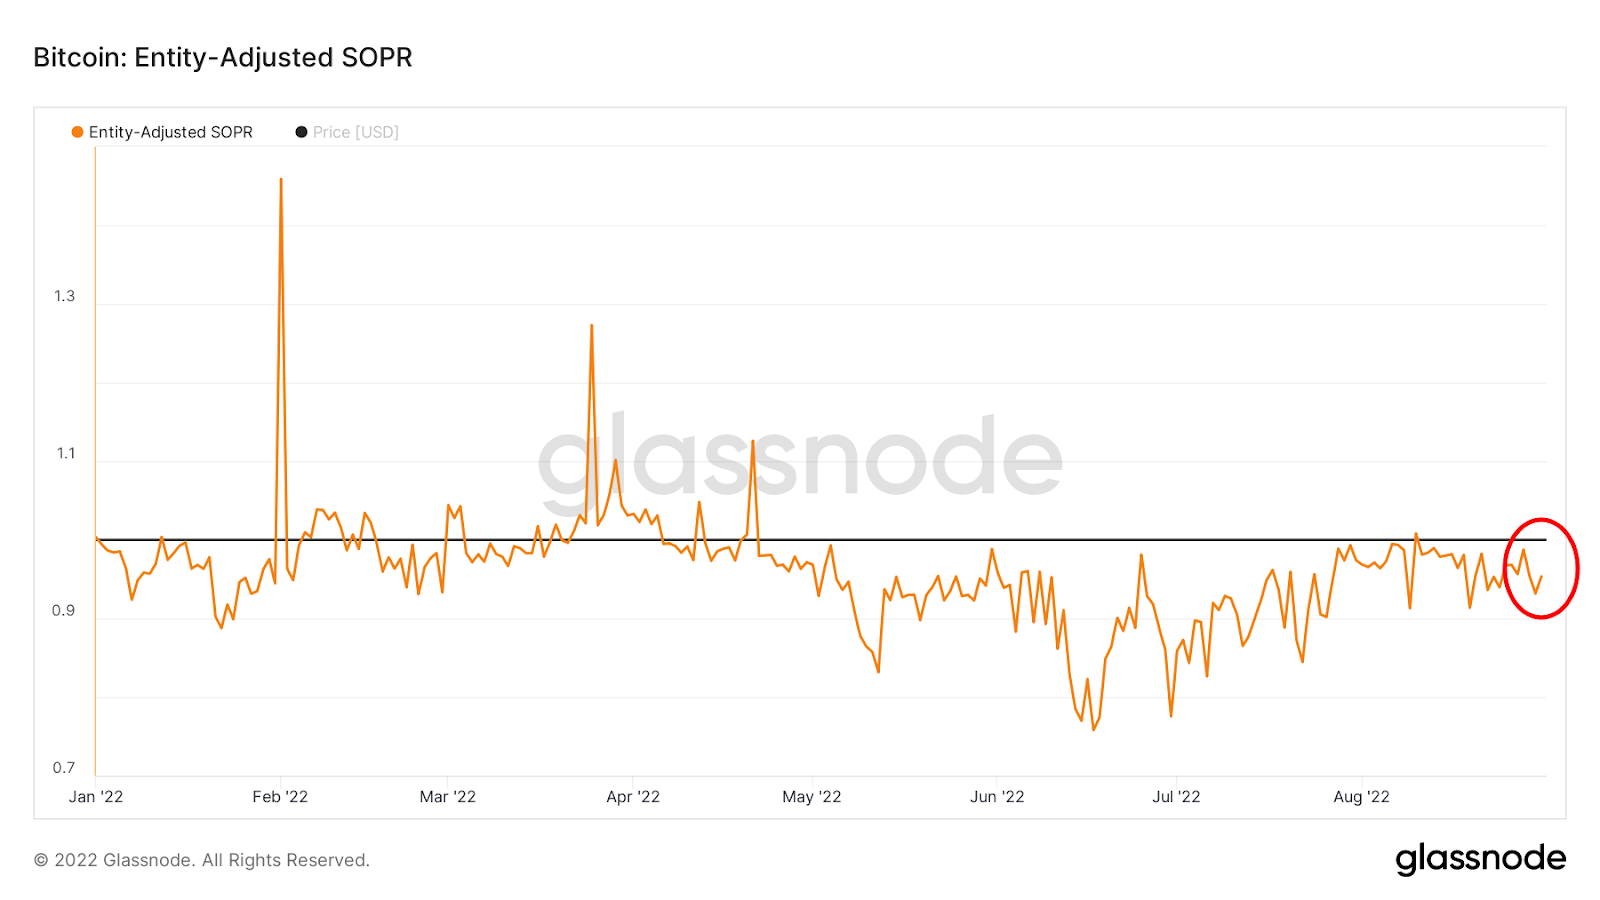
Entity-adjusted SOPR chart during 2022.
If the SOPR starts falling, it could trigger a drop to $18,000 for the price of Bitcoin.
Could The Ethereum Merge Affect Stablecoins?
According to a recent DappRadar report, Ethereum’s transition to a proof of stake (PoS) network could affect stablecoins that run on the Ethereum network.
Ethereum is currently the predominant blockchain on which stablecoins function. Although Tether (USDT) and Circle (USDC), the two largest stablecoin issuers, have expressed their full support for the Ethereum Merge, some other players are voicing their reserves about the planned migration.
For example, MakerDAO, the creator of the stablecoin DAI, claimed in a Twitter thread that the Merge could do more harm than good due to contract backwardation and negative funding risks.
Among large asset managers, Grayscale expressed worries that the Merge could cause the stablecoin tokens locked in smart contracts to remain locked forever. If this view spreads out among the community, it could force the holders of those smart contracts to liquidate soon.
On the other hand, Ethereum developers ensure that the Merge will not have any effects on ERC-20 tokens as it will happen on the base layer, not on the side chains.
Even if none of these concerns materialize, the future of stablecoins still represents a major challenge for the DeFi sector. With centralized stablecoins dominating decentralized protocols, many DeFi projects have been considering algorithmic stablecoins, according to the report.
Stay tuned for more updates and analysis from CEX.IO as the crypto ecosystem continues its evolution. To always stay informed, follow us on social media, or sign up for our mailing list to never miss a beat.
Disclaimer: Information provided by CEX.IO is not intended to be, nor should it be construed as financial, tax or legal advice. The risk of loss in trading or holding digital assets can be substantial. You should carefully consider whether interacting with, holding, or trading digital assets is suitable for you in light of the risk involved and your financial condition. You should take into consideration your level of experience and seek independent advice if necessary regarding your specific circumstances. CEX.IO is not engaged in the offer, sale, or trading of securities. Please refer to the Terms of Use for more details.