Traders who are familiar with the CEX.IO platform may have noticed some changes with the main trading page in recent weeks. There is now a variety of new features with the trading page, and the layout of the page has been optimized for simplicity and ease-of-use. The trade page is now best described in three different sections. Let’s take a look at what’s available to the trader when first looking at the trade page:

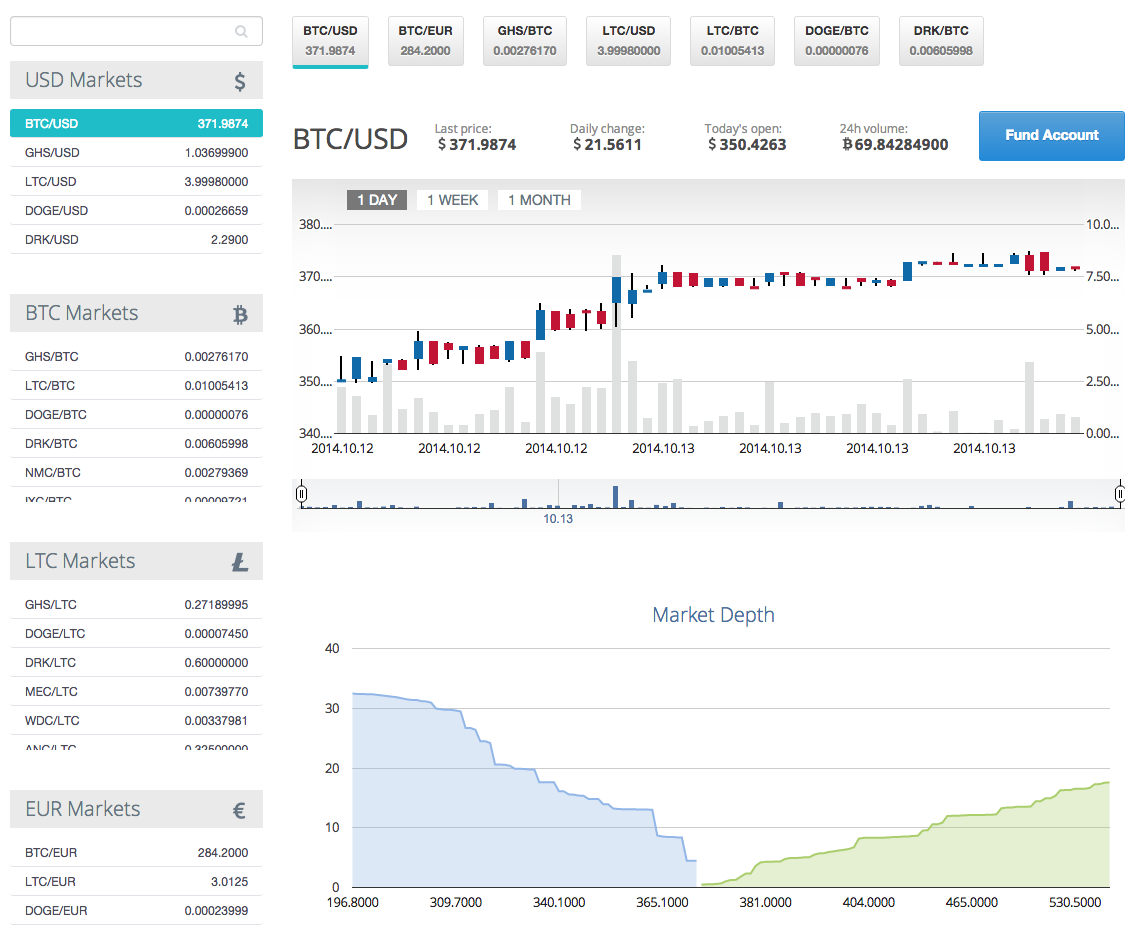
The top section of the trade page is where you can find the majority of the data related to the various trading pairs on CEX.IO. You can easily navigate to any trading pair from the various market menus on the left side of the screen, and the most popular trading pairs are listed at the top of the page. Below that list of the top trading pairs, you will find a candlestick graph of the currently selected market. In this case, it’s the BTC/USD market. You can also see the current market depth below the candlestick graph and volume of the selected market.

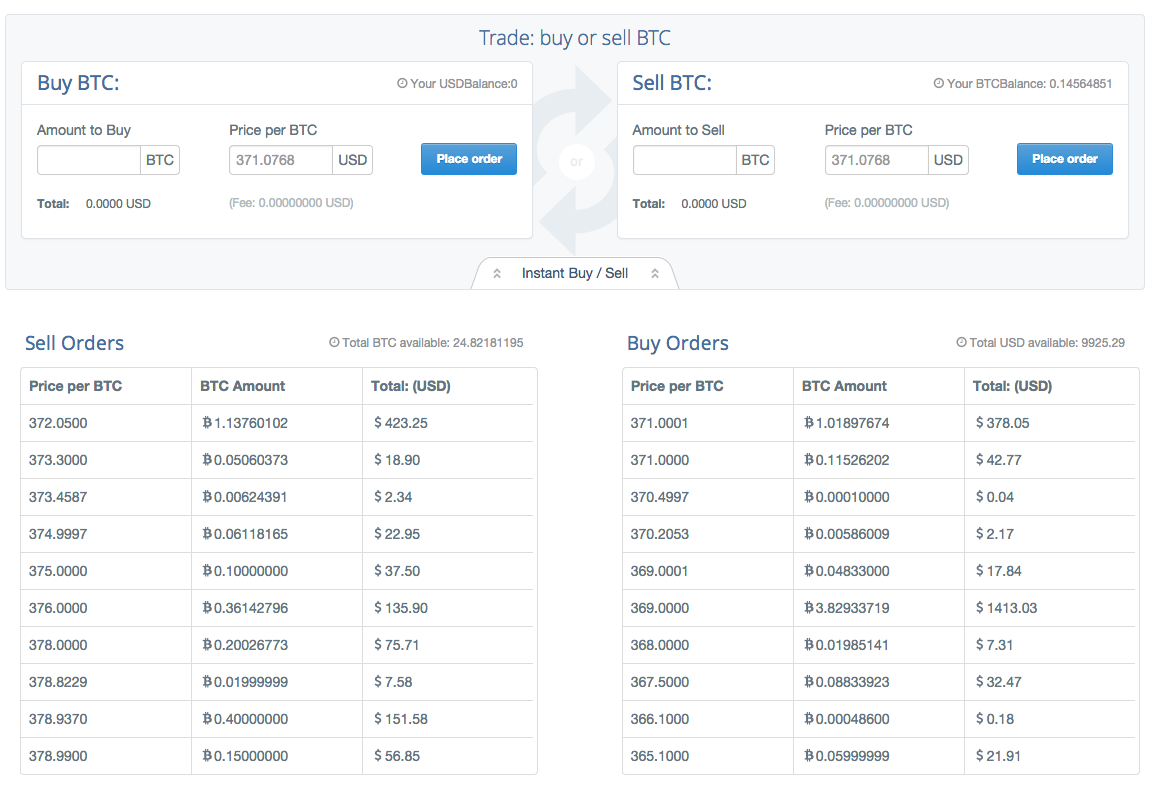
When you scroll further down the page, you will get to the section that is used for placing orders. In addition to placing your order manually, you can also take a look at the current sell and buy orders. This information can help you make an informed decision when setting the price of your trade. Clicking the “Instant Buy/Sell” tab will allow you to place a buy or sell order instantly by matching your order up with the other orders currently on the books.

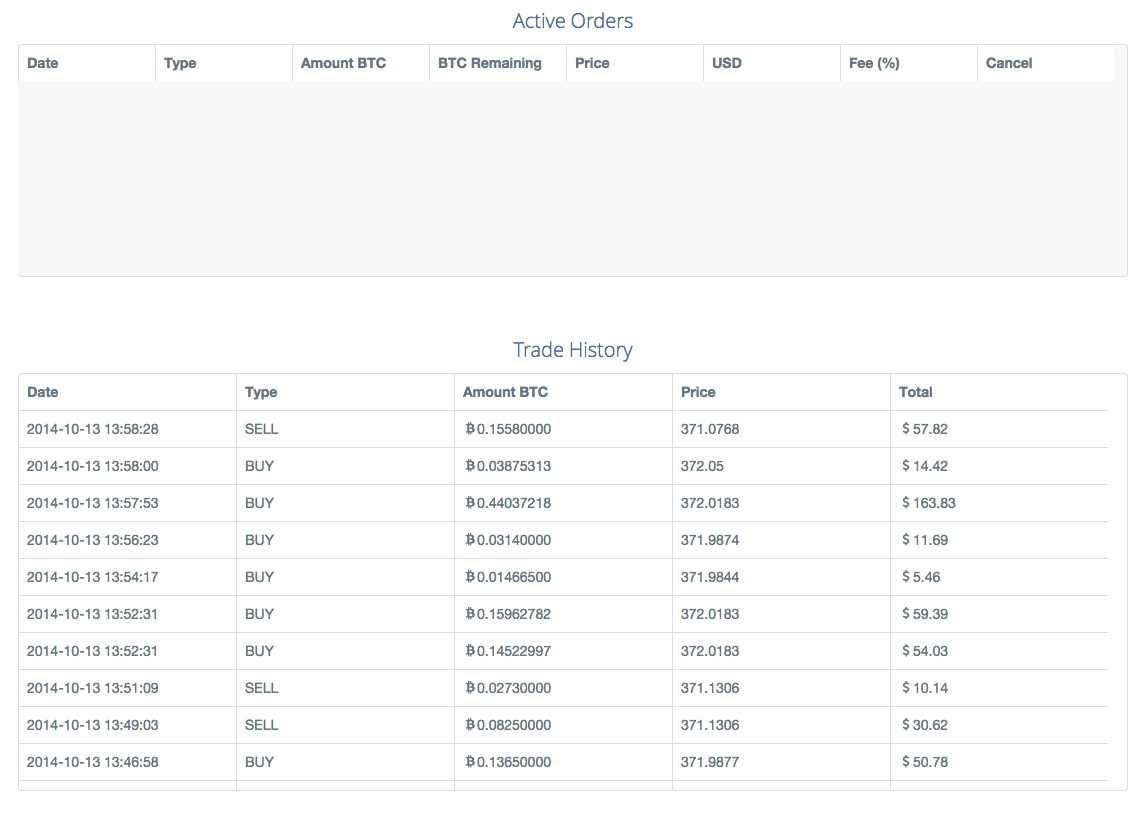
The bottom section of the trade page is where your can find your active orders and the entire trade history of the current market. Your active orders will disappear as they are matched with other orders on the open market, and you can keep up with the latest trades for that particular trading pair by checking the most recent entries in the “Trade History” section.
