CEX.IO News

Updated Charts on CEX.IO Bitcoin Exchange

, October 29, 2015

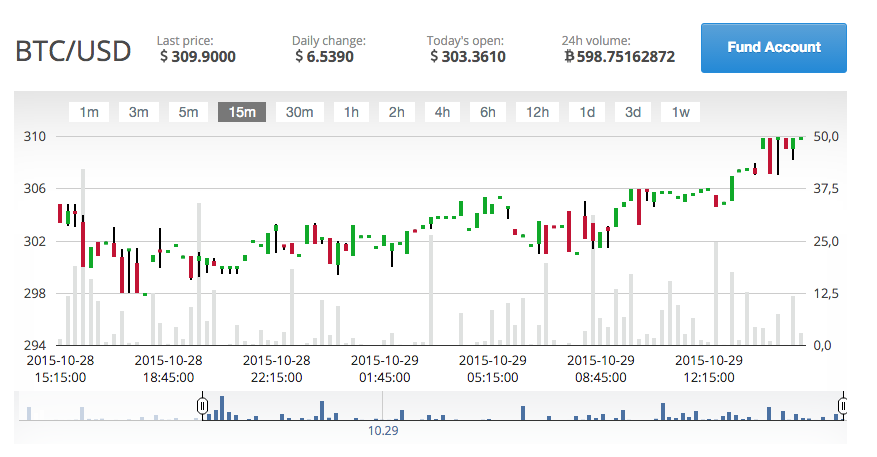
We would like to announce updated charts on CEX.IO. From now on, you are able to view candlesticks with a time period ranging from 1 minute to 1 week. Check out a screenshot of BTC/USD chart with 15-minute candlesticks:

Screen Shot 2015-10-29 at 17.27.18

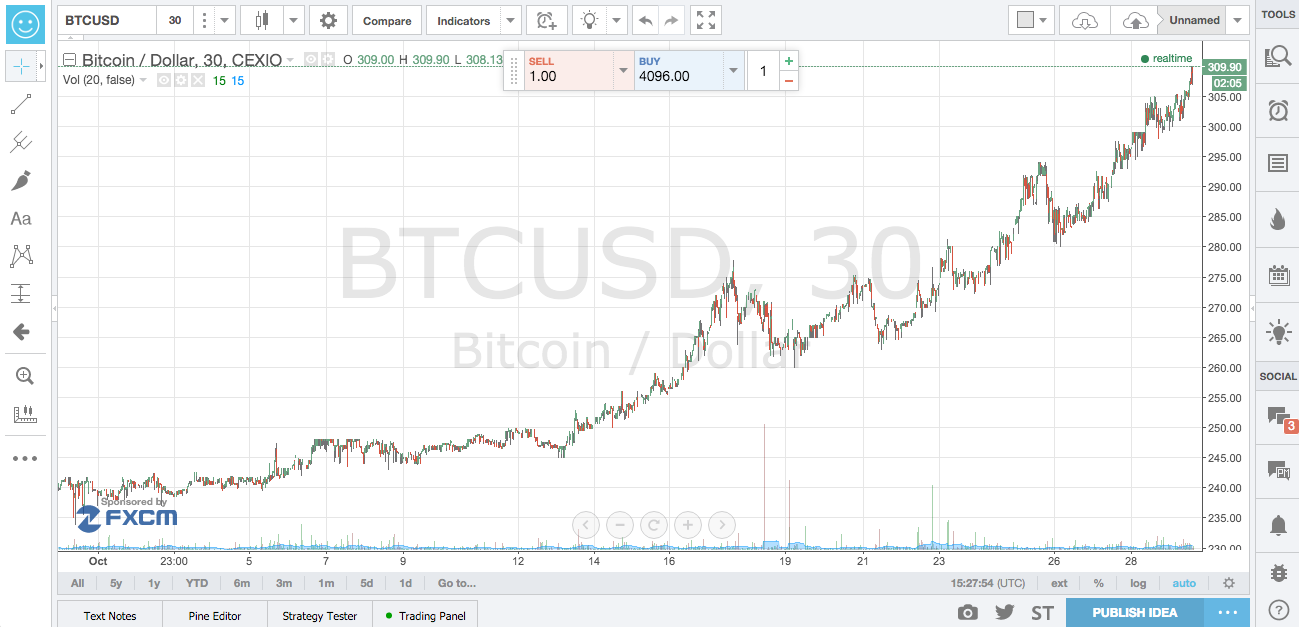
Recently, CEX.IO has also been integrated with TradingView, a useful financial charting platform. A monthly BTC/USD chart shown below is a vivid evidence of rapid Bitcoin price growth and volatility.

Screen Shot 2015-10-29 at 17.27.44

With such a positive price growth tendency and together with world’s enhanced attention to Bitcoin and blockchain technology, we are now experiencing even more intense cryptocurrency trading on the market.

[button url=”https://cex.io/trade” color=”” size=”small” type=”square” icon=”” target=”_self”] Trade Now [/button]

Related

CEX.IO News Crypto Ecosystem

Crypto Ecosystem Update: The Early December Crash

What is going on-chain in Bitcoin and Ethereum, their technicals, and a number of critical developments in cryptocurrency products? Find out in this bog post.

Dec 22, 2021 | 20 min read
CEX.IO News

GBP Support Added to Simplified Interface

CEX.IO improved simplified buy/sell interface by enabling support for British Pounds. Such an update will be especially appealing for users from UK who are willing to buy Bitcoins with their local currency. How it Works? Literally, the interface looks like an exchanger with packages for a certain amount of

Mar 27, 2017 | 2 min read
CEX.IO News Education

CNY vs. USD or How is Bitcoin Traded?

Many of you may wonder about the currency distribution within the Bitcoin ecosystem. In order to answer this question we should analyse statistical data and compare the distribution rate of various fiat currencies. Currently, there are two different resources available for our research — bitcoinity.org and coinometrics.com — both

Oct 06, 2014 | 2 min read