
More price drops to come. Bitcoin traders should now be asking themselves: How low can we go?
In last week’s bitcoin price analysis, we wrapped up with a bearish forecast – breakdown of $ 333 support into sub $ 300, followed by a retest of 2014’s bottom – $ 275. This week, this play took a downturn as expected, following heavy selling pressure pushing bitcoin’s price down to $ 255 within a span of hours. This bottom has been short lived as price is retracing back up in a corrective fashion. Although this level has now been tested and pierced looking at the 6 hourly chart, upward momentum is seemingly failing at this level. It looks anything but convincing:
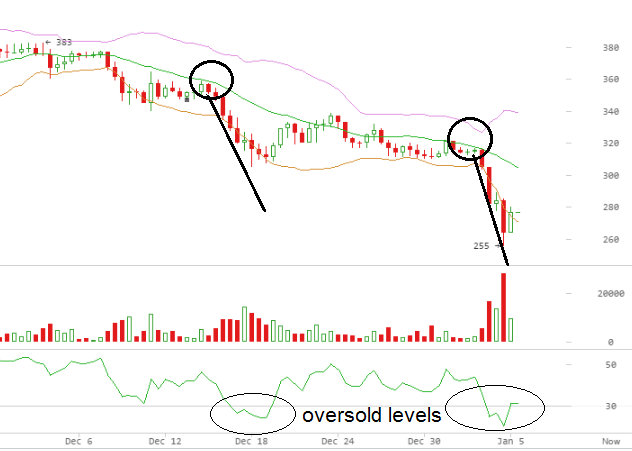
Currently, divergence levels and strength indicators point to overbought levels on 6 hour time frames. Looking at the image above, RSI overbought territory coincides with a test of a weak Bollinger band EMA support (weak due to oversold levels). Technically, a pattern akin to a double bottom, a double top is in the cards on long timescales. This pattern results in an opposite move to a prior trend. For this case, double top forebodes a turn in the direction (opposite) and a continuation of a larger trend down.
Sentiments now are hardly indicative of a decisive bullish break. In my mind, price action now resembles similar patterns at $ 372, $ 357, $ 330, retracements with average strength, lengthy sideways moves that prolong the inevitable downside breakout.
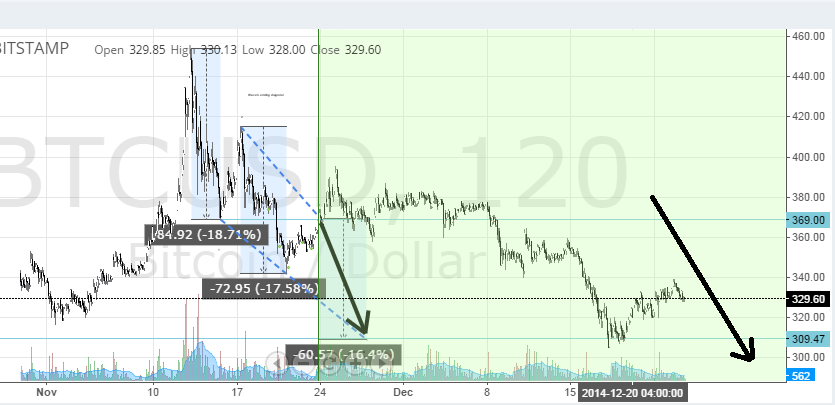
Consecutive green candles from $ 304 to $ 338 was a profit taking opportunity on December 21st – 10% return and possibly more on leverage. Today, a reasonable opportunity to scalp presents itself at $ 275 up to a corrective top.
Red candles from the top point to a loss of buying pressure. It is awfully similar to the previous pattern.
The steep upward thrust, which occurred today out of nowhere, seems likely to be the result of an EW triangle. Triangles are terminal moves so I expect the move to be fully retraced at least.
Read on for insights on next week’s price outlook.
Bitcoin Fundamentals
After last week’s great news from Microsoft & Time Inc., one wonders what else is left that would turn this bear market to react to all the positive news that is coming out. I expect Google to announce it accepting bitcoins sometime soon. I am similarly bullish on the fruition of at least one Bitcoin ETF.
Google had some fascinating statistics on search terms on its engine. In a list of ‘What is -’ Google searches, ‘What is Bitcoin’ made it into 4th spot amongst millions of searches in 2014.
Search engine Yahoo also had a list of their own that placed bitcoin in the top 10 category.
This Week Price forecast
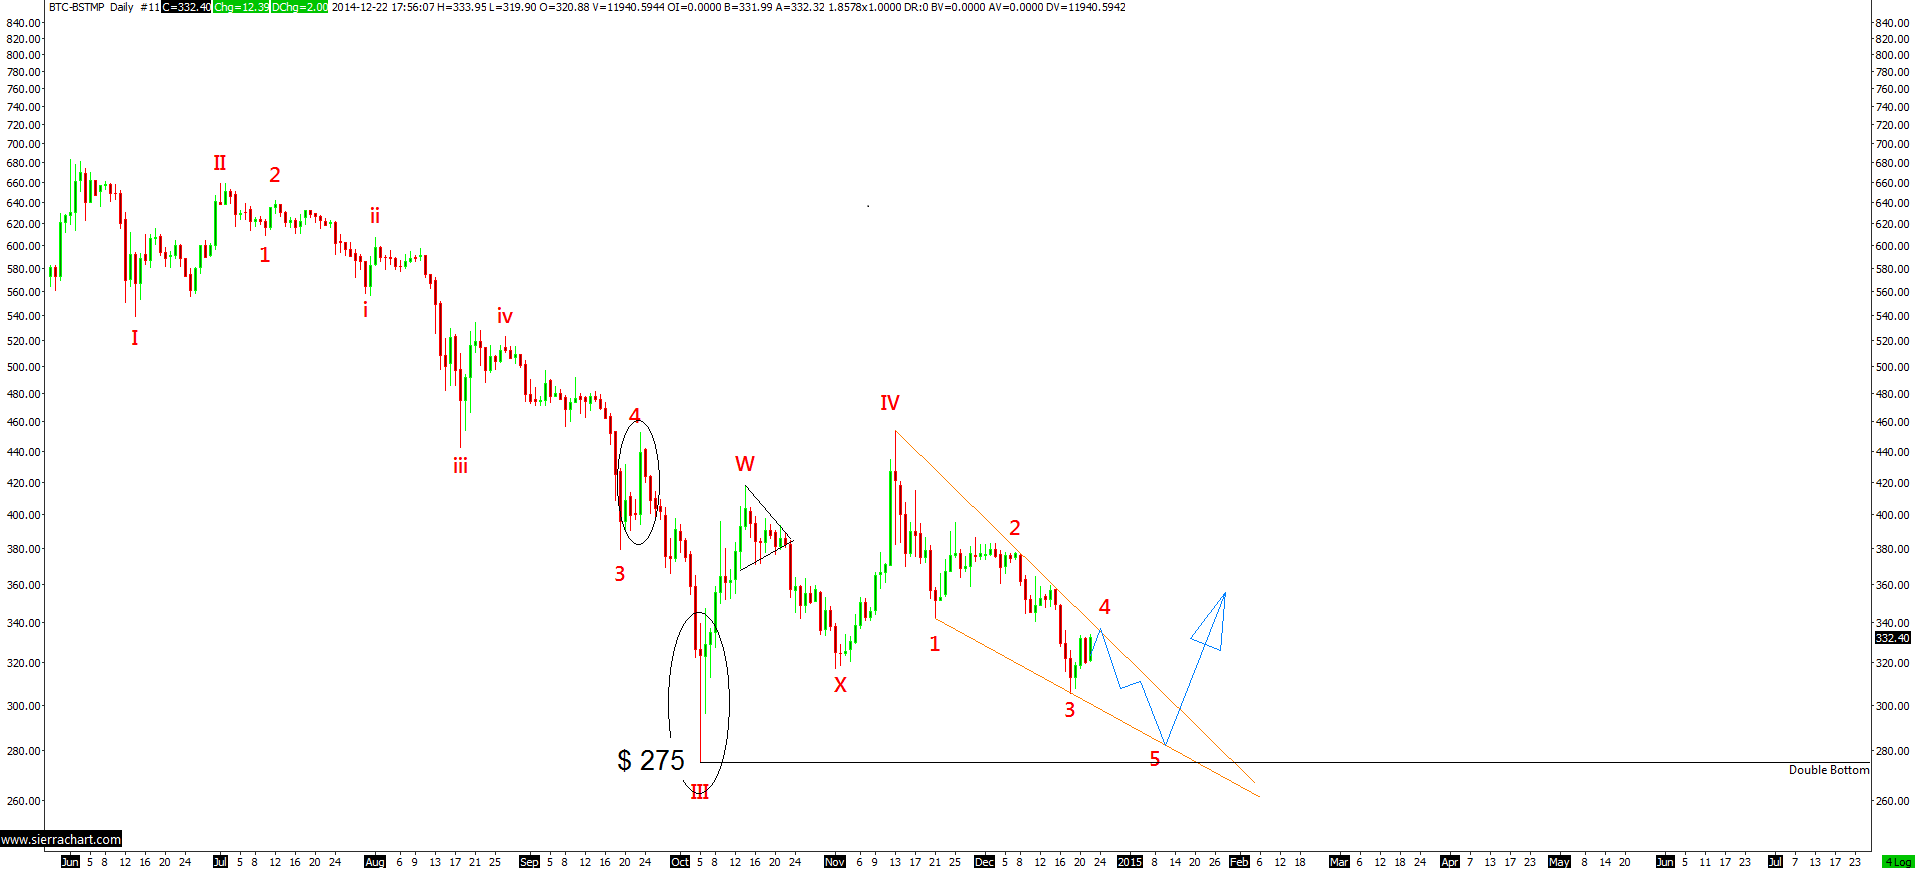
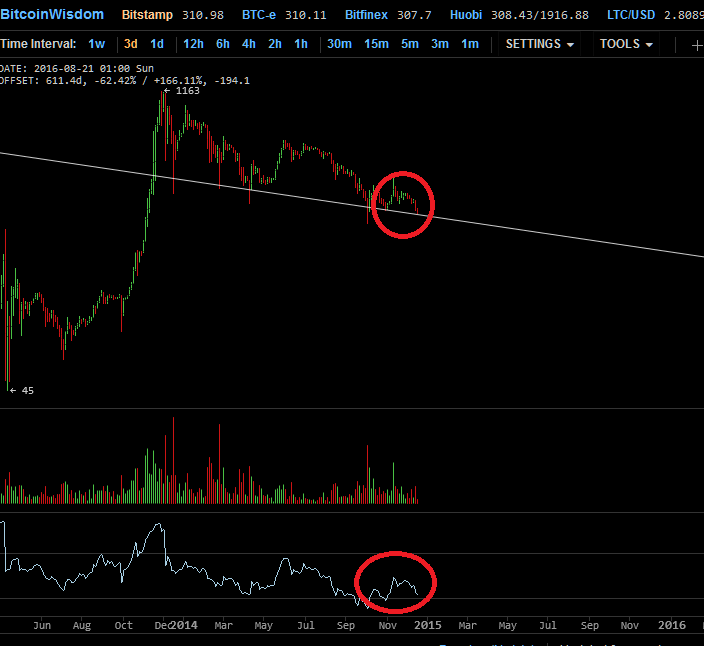
This week I expect the price to break into new lows and test lower supports. This may occur within retracements and dead cat bounces; but an overall bear trend will persist. Quite possibly, a truncated sideways pattern similar to encircled in picture.
The past 4 months of this bear market have characteristics matching Elliot Wave cycles. The overall picture shows wave 1, 2, 3, & now 4. Wave patterns are common in long & short time frames such that within wave 1 there can be sub-waves of higher orders eg (i). Wave 3s are typically the longest, right next to wave Vs.
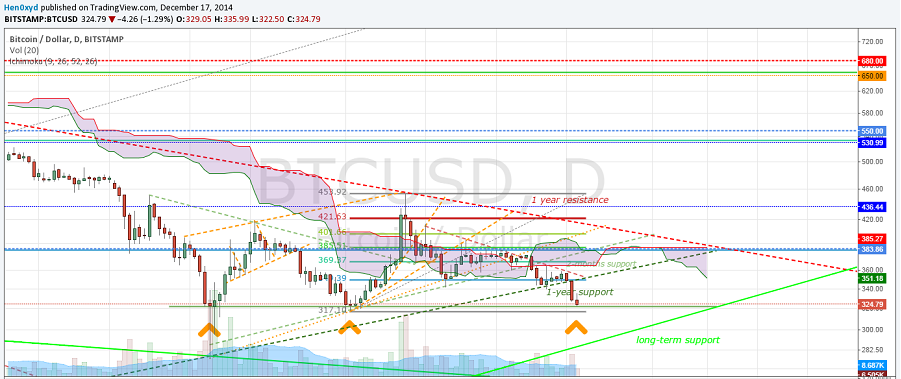
Besides EW analysis, additional technical indicators and psychological levels point to a test of an extended long term trend line tracing back to 2012.
Looking at this chart, the single, double & triple bottom are possible.
• A single bottom will break consecutive levels – $ 304, $ 275 and down to a new 12 month low.
• A double bottom would bounce off around $ 275 prices; $ 266 is significant here, and $ 250 is a nice round number.
• A triple bottom means the bottom is behind us as – $275, $316, $ 304 are the three bottoms. For this triple bottom to pan out, this uptrend would need saving; some very heavy buying support, and not just a couple of whale pumps either.
Watch out for $ 266 level as a crucial level to break on the downside for possibly the last low. $ 275, $266, $ 183. Short positions could pay off at this point. Remember stop losses and go easy on them.
A valid 3D bullish divergence could turn in the next couple of weeks into a capitulation testing long term support. Market manipulators take advantage of weak hands at unexpected levels such as $ 266 – April 2013 high. Imagining what would happen if prices dipped to sub $ 250 levels and the panic associated with it; there would be plenty of coins to pick up on the cheap. If I had to give a timeline, I would say 1-6 weeks.
If we break 266 then, the panic could take us there. It’s not in my sights yet, but it all depends on how/if we get to $266 (speed and strength)
After this bottom, I expect the bear to be declared the dead!