Each week, CEX.IO compiles a detailed synopsis of conditions in the evolving crypto ecosystem. Read along for insight on the latest DeFi developments, explore in-depth price analysis, and enjoy applied breakdowns of adjacent markets to help you make the most informed decisions along your own crypto journey.
Following the U.S. Federal Reserve meeting on July 27, markets have rallied with strong momentum. Bitcoin was no exception, which climbed from $22,000 on July 27 to a high of $24,675 on July 30.
The progress of the S&P 500 stock index, as well as the U.S. bond yields, could potentially determine the direction of the crypto markets this week. If the S&P 500 continues its climb from last week while bond yields keep plunging, cryptocurrencies may continue their recent positive price action.
This week, the U.S. July jobs report will be critical to watch on Friday as jobs and unemployment data may help clear things up on whether the U.S. economy is truly in a recession. After realizing two-quarters of negative GDP growth, a widely accepted definition of a recession, these additional vectors will provide some helpful contouring to the evolving situation.
If Bitcoin makes a new leg to the upside, $29,000 will be key resistance upon a monthly close as that level constitutes the 2021 bull market support. The same resistance passes at $2,100 for Ethereum.
If Bitcoin and Ethereum can succeed in moving toward their major resistance levels, they could potentially bring higher prices for many altcoins as well.
Bitcoin price analysis
Rising channel still intact
The parallel rising channel that Bitcoin has been following since the $17,600 bottom is still intact. Bitcoin got rejected at the resistance line of this channel for the fourth time on July 30.
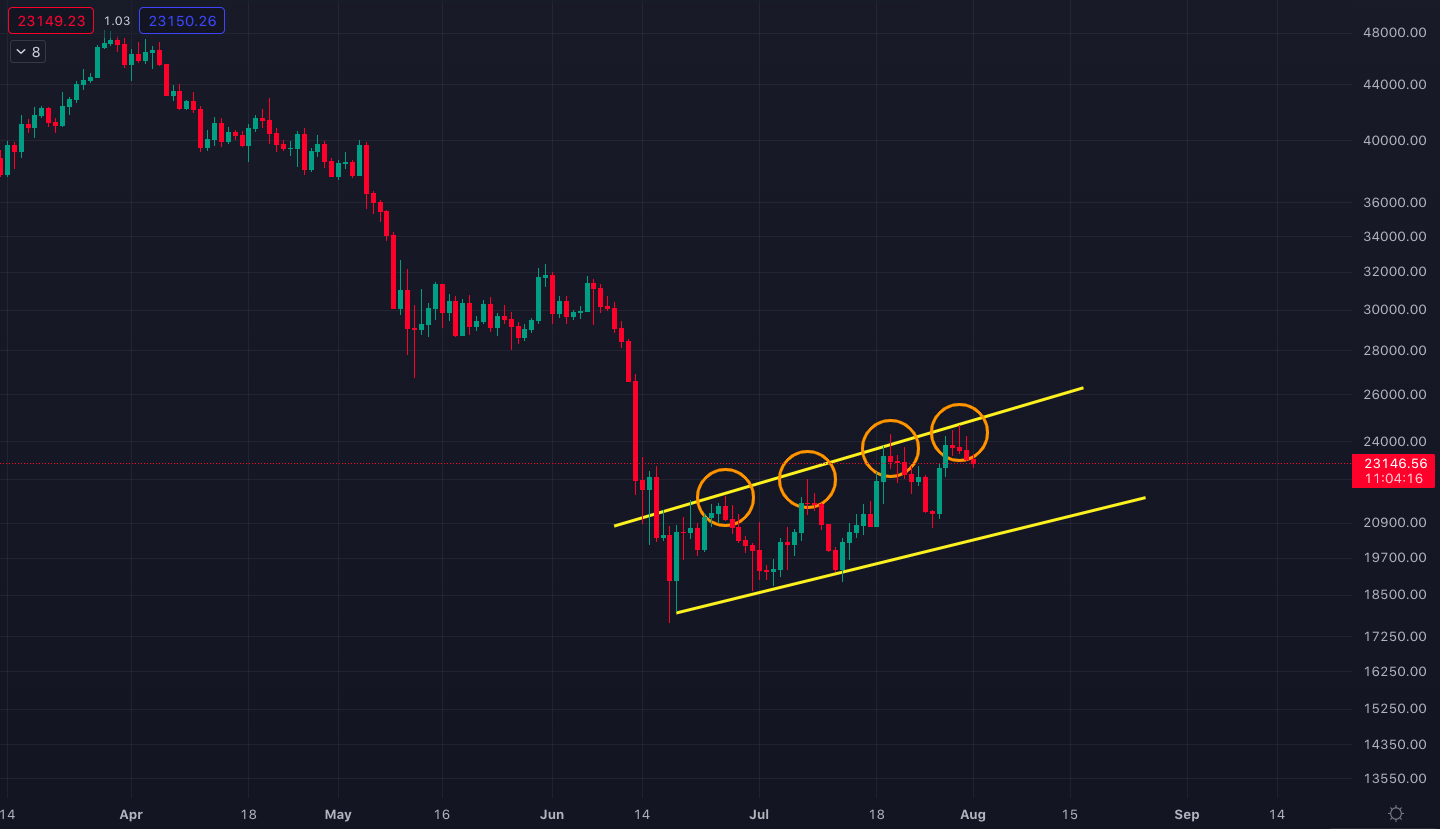
Bitcoin/U.S. Dollar price chart with daily candles. Source: Tradingview
To start a move towards the $29,000 region, the price of Bitcoin needs to close a week above this rising channel.
3-day stochastic RSI
Stochastic RSI is used to determine overbought and oversold price levels for an asset. The values of the indicator can range between 0 and 100, where 0 indicates an oversold price and 100 indicates an overbought price.
Bitcoin’s stochastic RSI in a three-day time frame, which is statistically significant for gauging Bitcoin’s momentum indicators, is currently at 90. This means there is still space for Bitcoin until it becomes overbought in a larger time frame.
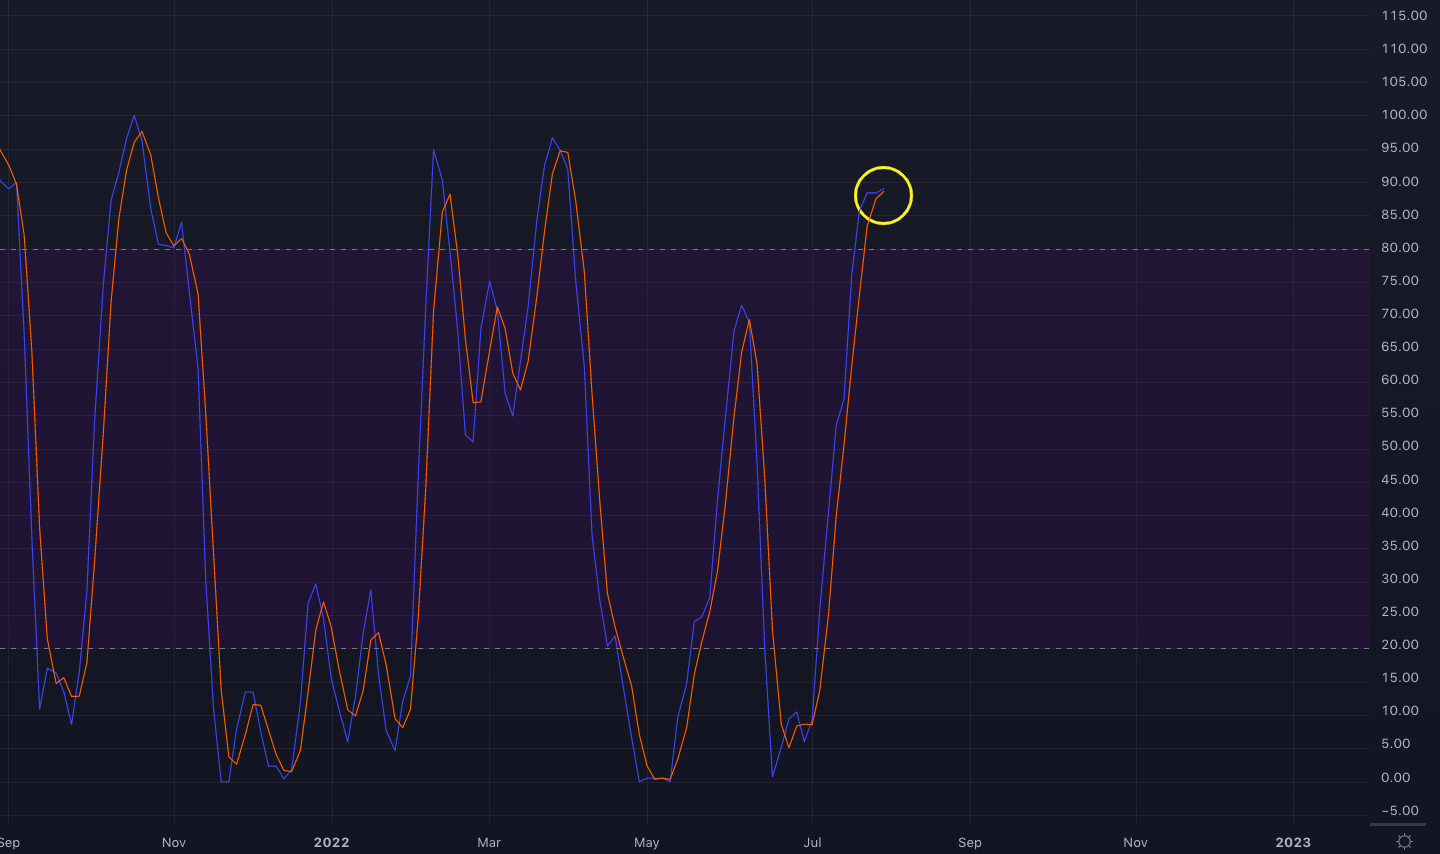
3-day stochastic RSI chart for Bitcoin
Relative strength index (RSI)
The relative strength index (RSI) measures the speed and magnitude of an asset’s recent price changes to determine overbought and oversold conditions in the price of that asset.
Bitcoin’s RSI is approaching major resistance on both the daily and the three-day time frames (the yellow descending lines in the charts below).
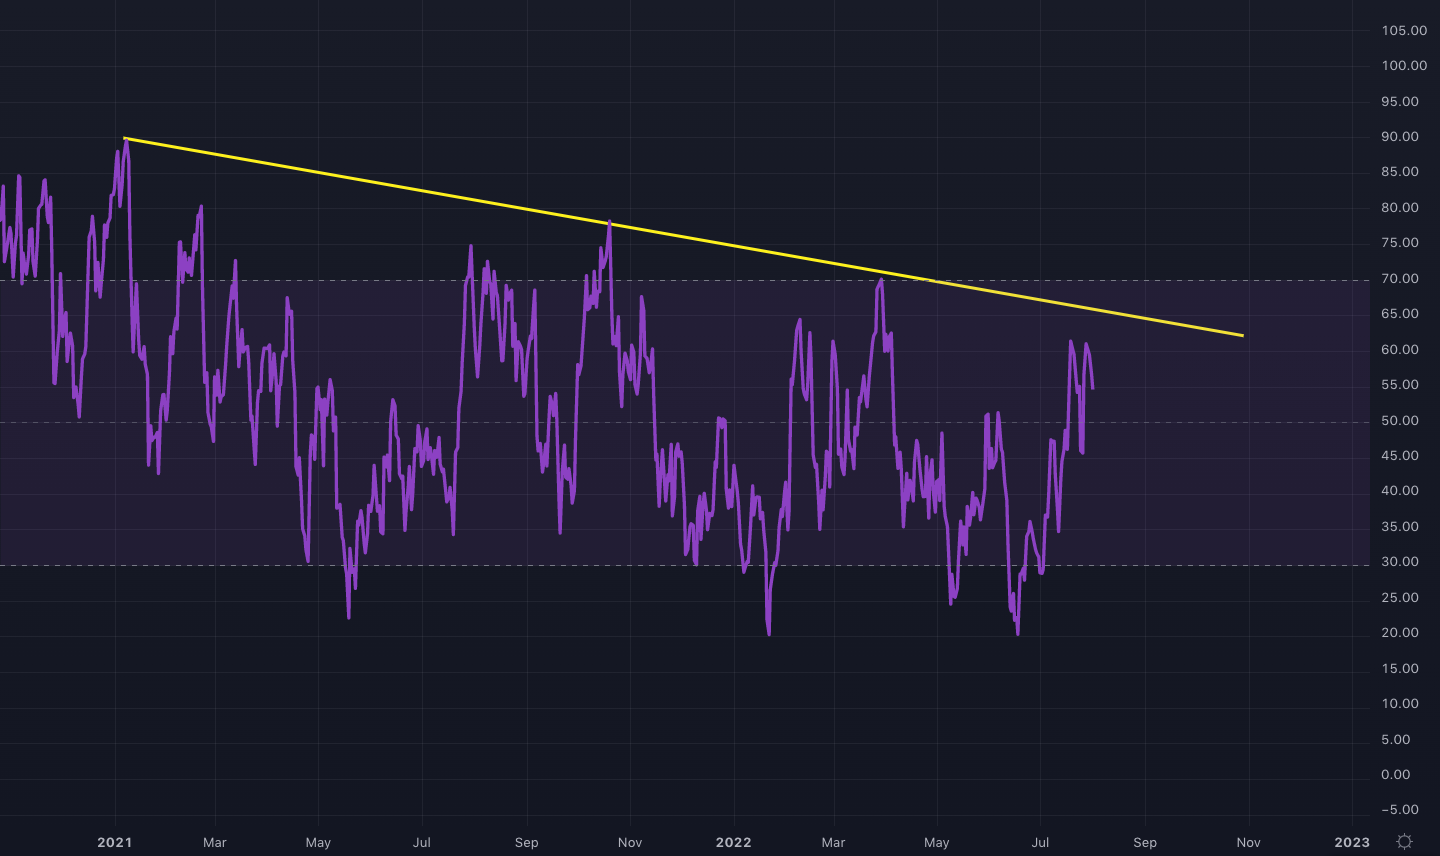
Bitcoin’s RSI chart in the daily time frame
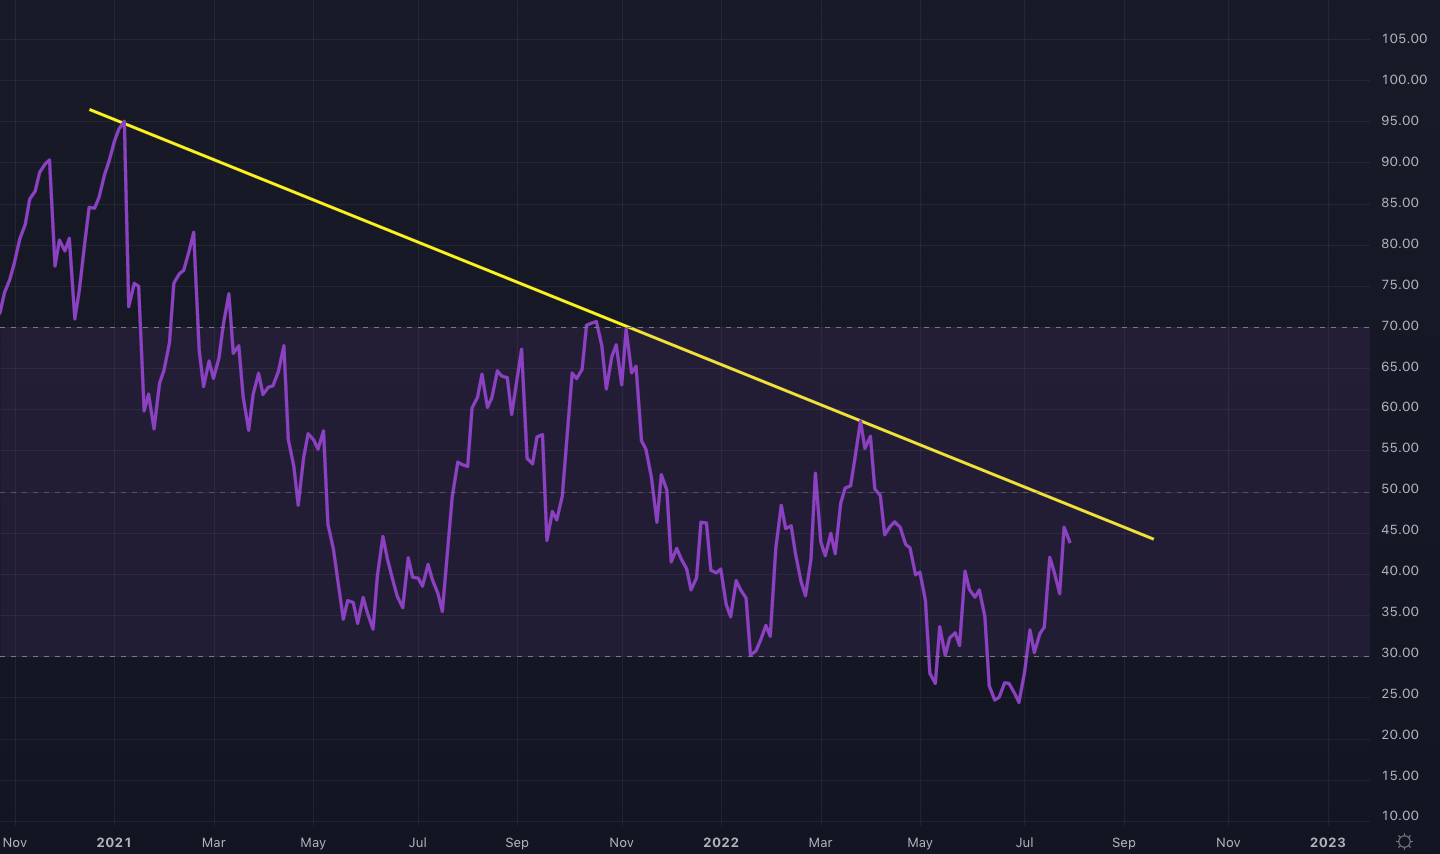
Bitcoin’s RSI chart in the three-day time frame
As you can observe in both charts above, the RSI has increased gradually since the July 18 bottom as opposed to previous rallies, which consisted of spikes and bull traps. This increases the likelihood that the RSI may break above the descending resistance this time, at least temporarily.
$4,170 resistance for the S&P 500 index
In the meantime, the S&P 500 stock index, the asset class that Bitcoin has been most closely correlated with, just exploded following the Fed’s rate hike announcement on July 27. In only three trading days, the index grew by a whopping 6% to $4,130.
Going forward, $4,170 will act as very significant resistance as this level constitutes the 2021 bull market support (see the chart below). The last time the index hit this resistance in late May 2022, it faced strong rejection that ended with the $3,636 low on June 17.
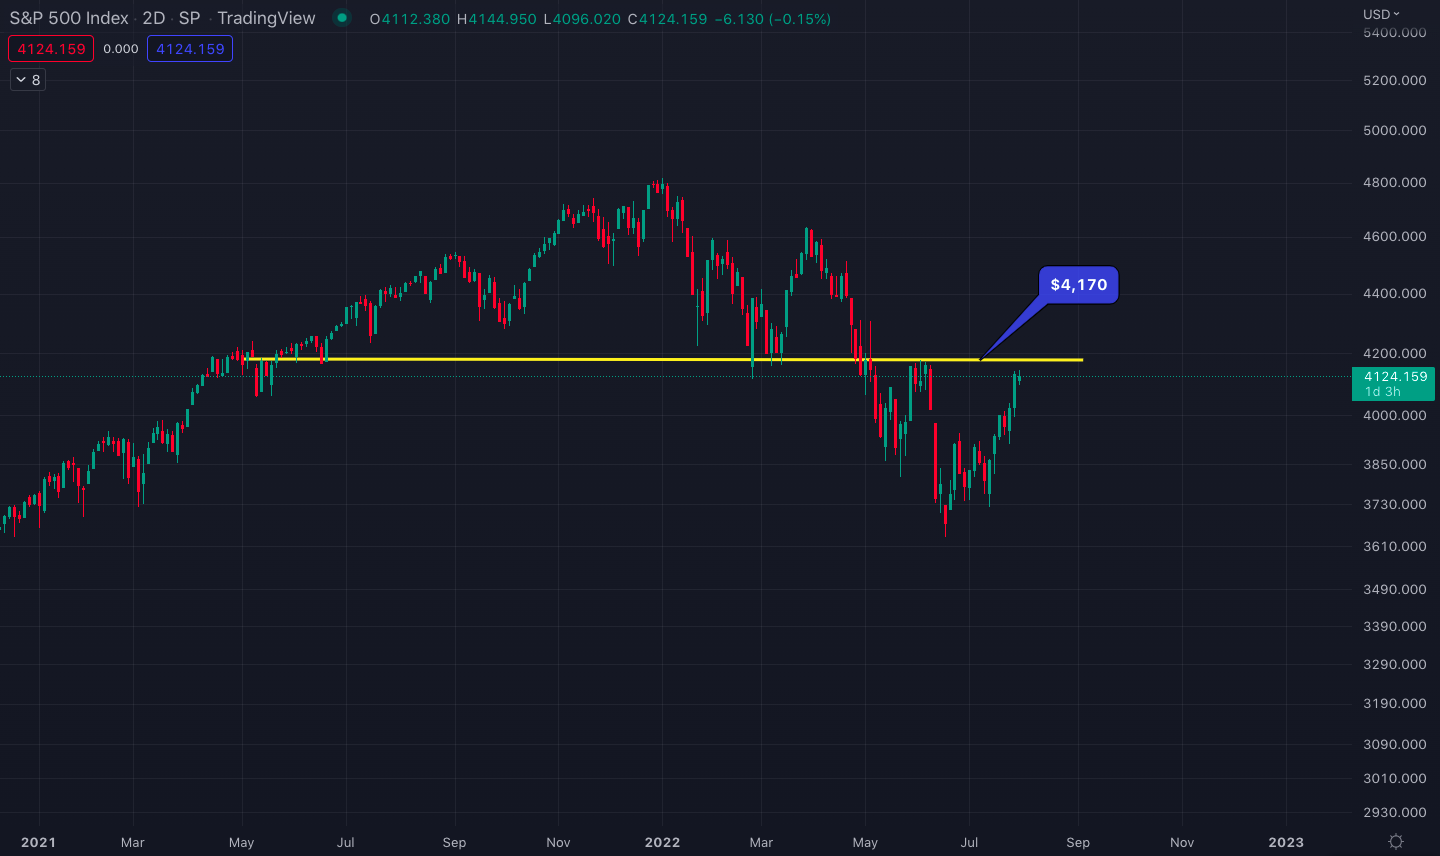
S&P 500 price chart with 2-day candles and the $4,170 horizontal resistance
Considering that, people who plan to add to their Bitcoin and altcoin positions could look for an S&P 500 daily close above $4,170.
10-year U.S. bond yields
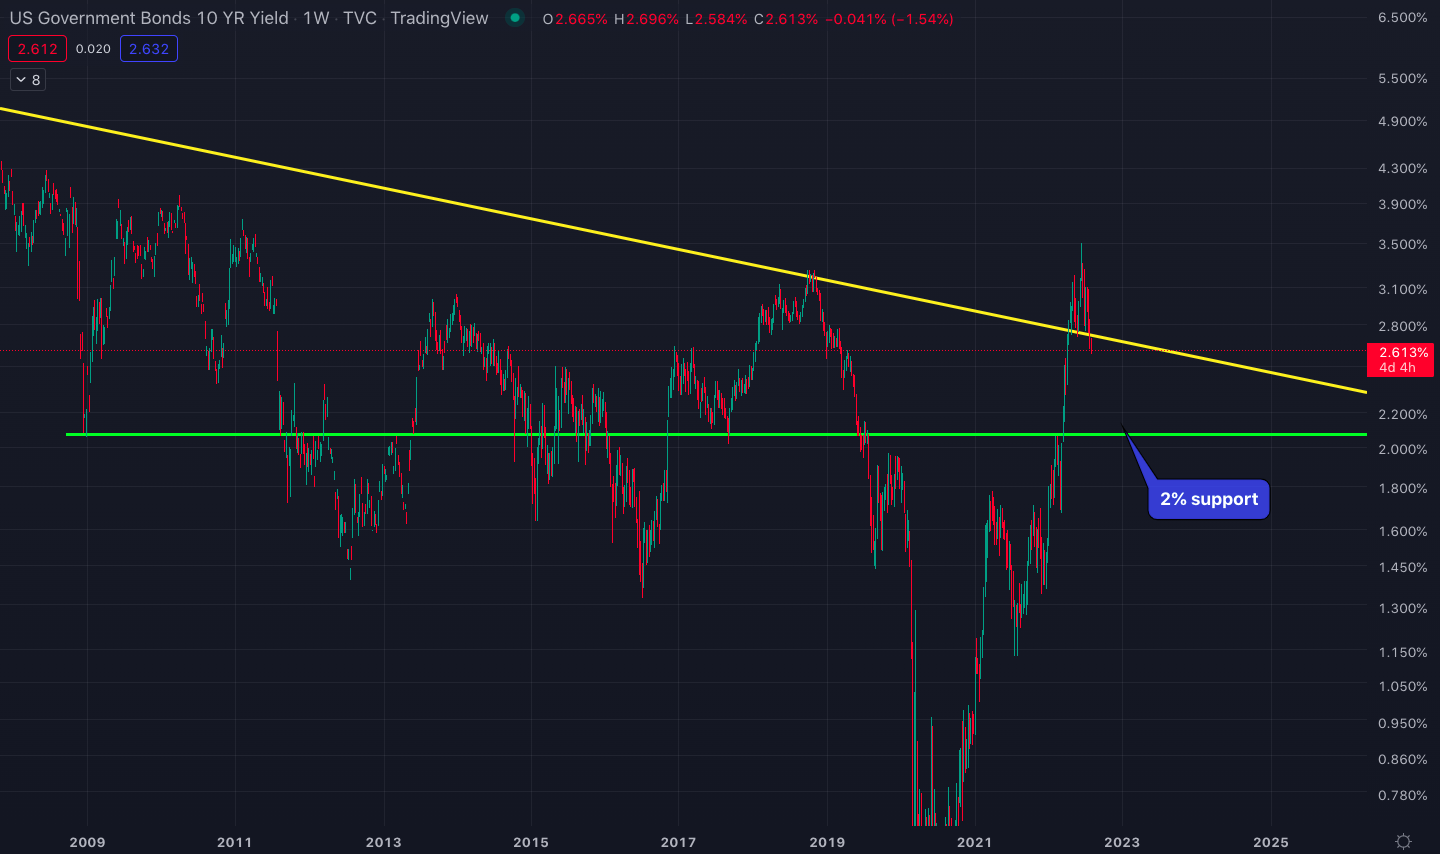
After breaking a 40-year-old downtrend this year, the yield for 10-year U.S. bonds has started a correction. Following the 3.5% top on June 16, the 10-year yield has dropped to 2.5% as of August 1.
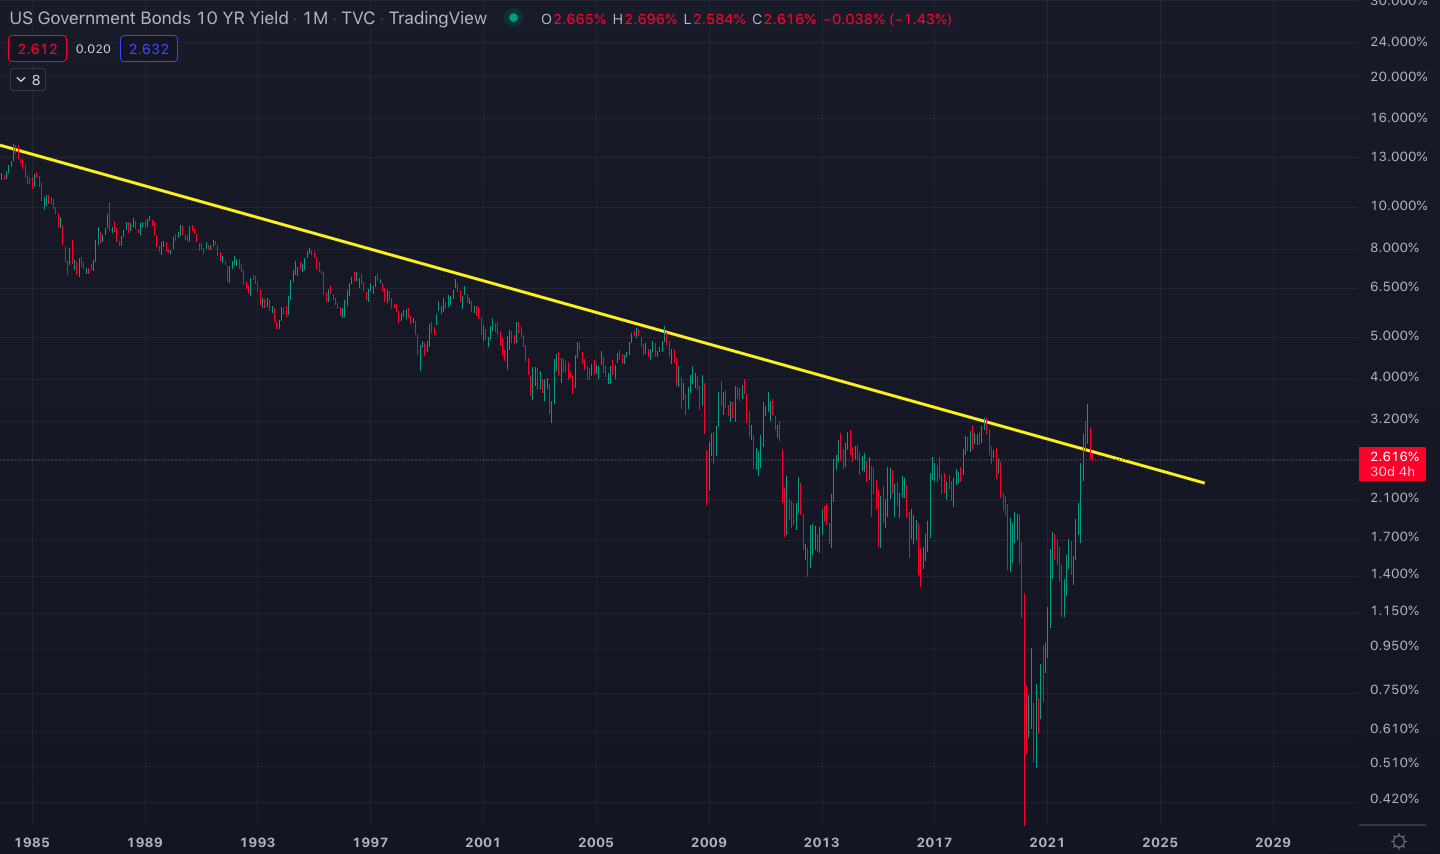
10-year U.S. bond yield chart with monthly candles
As you can see in the chart below, the 10-year yield fell back below the yellow resistance line in late July after losing the 2.8% level.
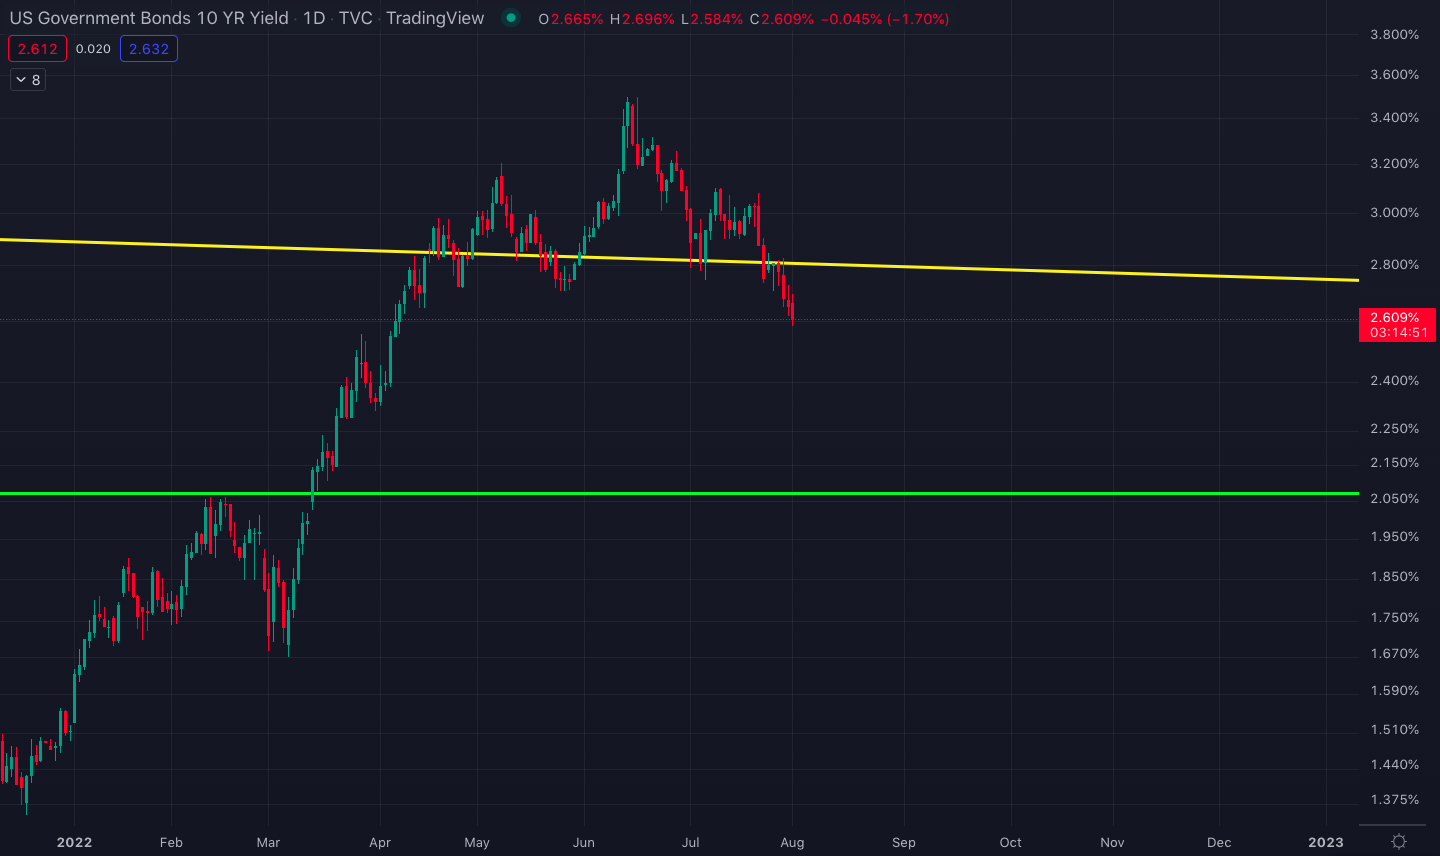
10-year U.S. bond yield chart on the daily time frame
A drop in bond yields means there is an increasing demand for those bonds. Stock markets are a derivative of the bond markets so if someone is buying up the bonds, it is likely a positive development for the stock market, and thus for cryptocurrencies.
If the 10-year yield keeps plunging, 2.0% will likely act as major strong support.
The 600-week simple moving average (SMA) also passes at around 2.0%. This moving average line has consistently worked as resistance during the last 30 years until the 10-year yield finally broke out of it in March 2022. Due to this, the line can now act as a strong support if the yield drops to 2%.
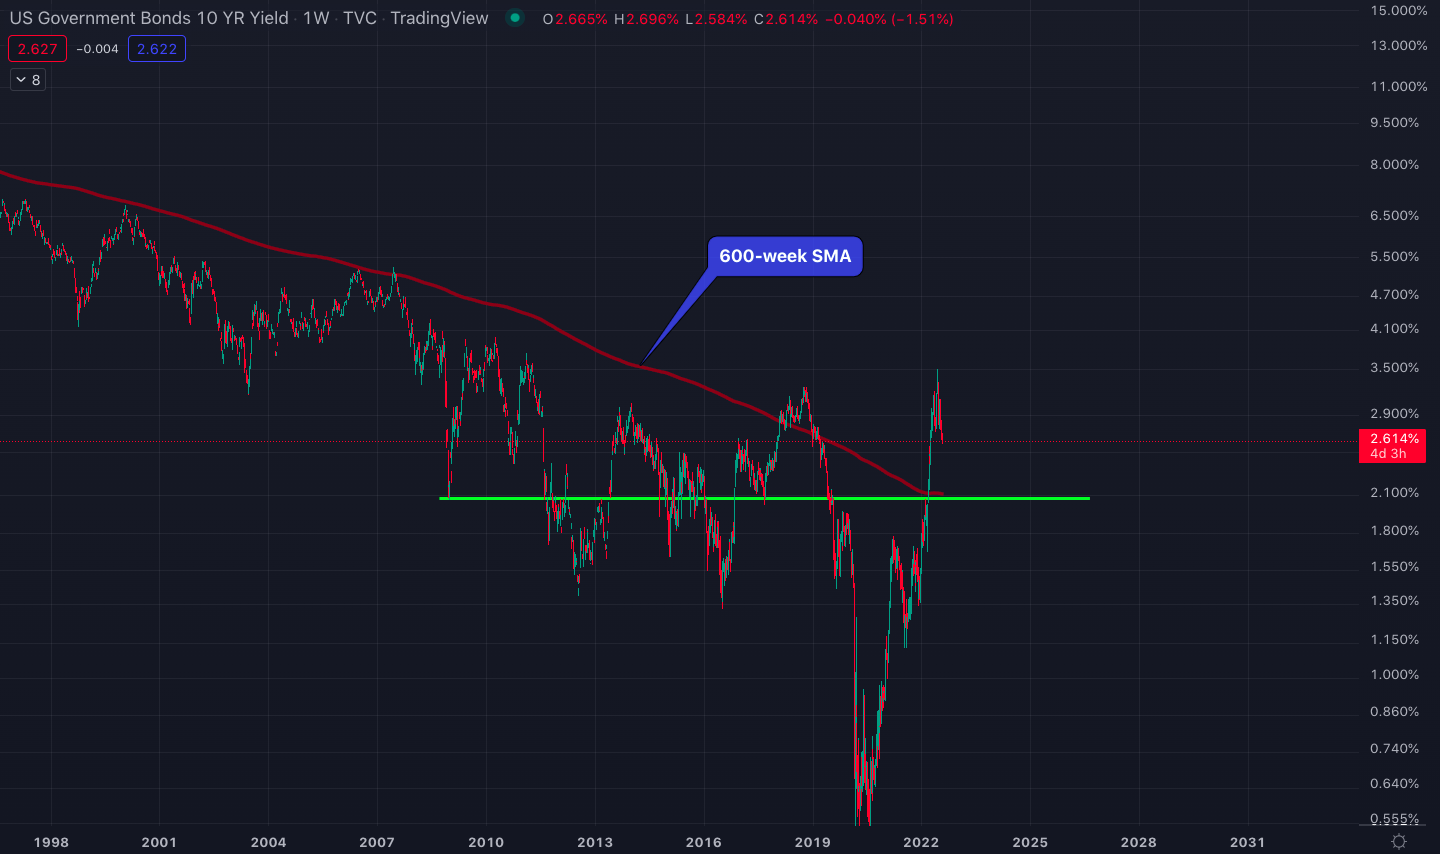
Weekly 10-year U.S. bond yield chart with the 600-week SMA
If the 10-year yield drops towards the 2% horizontal support (or to the 600-week SMA support), it could give Bitcoin the necessary runway to climb to the $29,000 resistance.
Bitcoin on-chain analysis
On-chain activity is the use of Bitcoin block space by network participants who make transactions and settle value on the network. With on-chain analysis, you can monitor the holdings and transactions of individual Bitcoin wallets in real-time.
Raw on-chain data is compiled to certain metrics which provide insight into the collective behaviors of Bitcoin holders, miners, and speculators, and can help evaluate the overall market sentiment for Bitcoin.
On-chain metrics that may have a significant correlation with the future price of Bitcoin include the short-term holder supply, long-term holder supply, and the bitcoin balances on crypto exchanges.
Short-term holder supply
Short-term Bitcoin holders are those who have held coins for less than 155 days. This class of holders is the most likely to react to large price crashes and spend coins in the face of market volatility.
In Bitcoin’s past bear markets, 2.7 million acted as a strong support figure for the short-term Bitcoin supply (the yellow horizontal line in the chart below). In other words, whenever the short-term supply had dropped to around 13% of Bitcoin’s total 21 million supply, it marked the end of the bear market for Bitcoin.
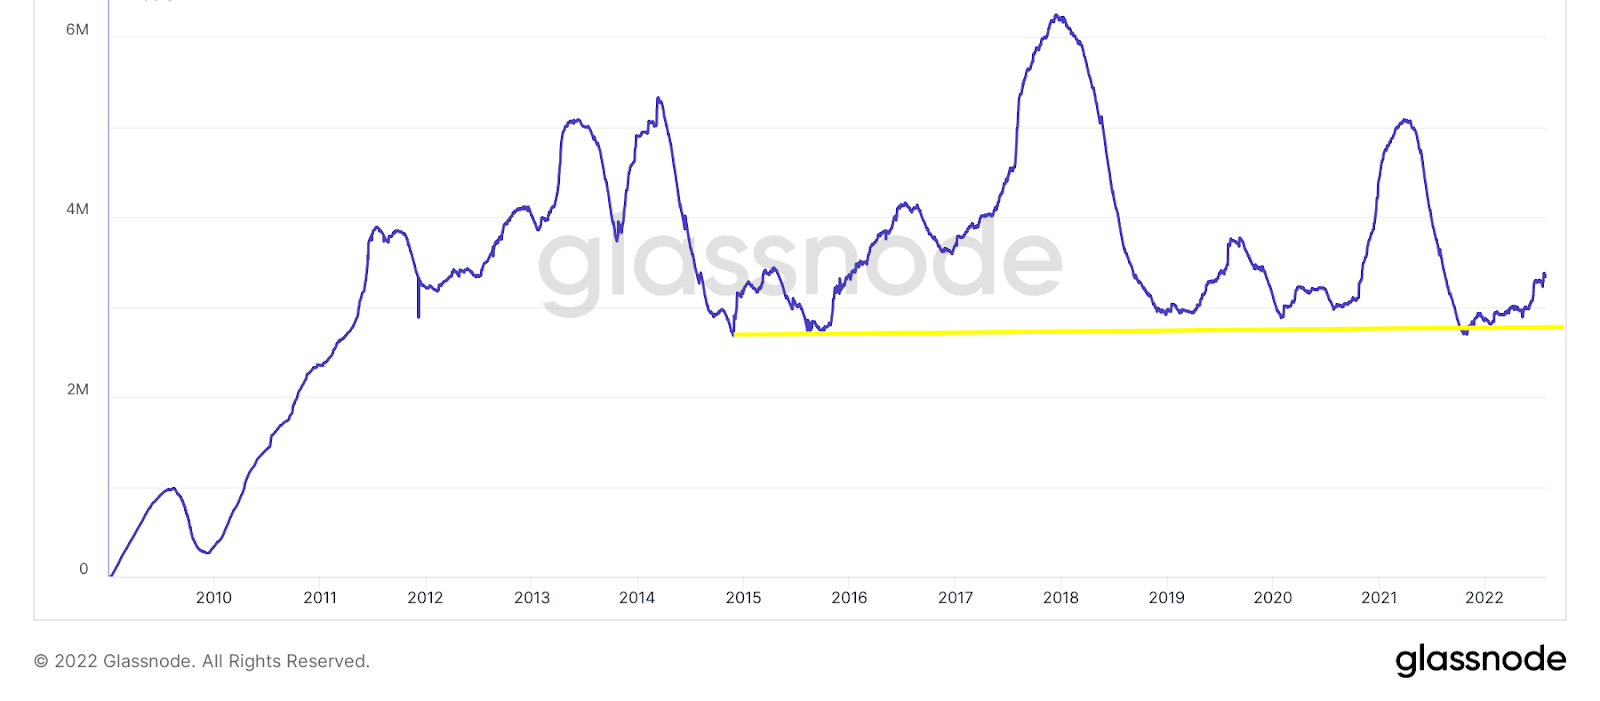
Bitcoin’s short-term supply with the 2.7 million support line. Source: Glassnode
The metric bounced at 2.7 million bitcoins again during the last dip in October 2021. As an interesting divergence, although the price of Bitcoin has been falling since then, the amount of short-term supply increased. This suggests that people have been heavily buying into the Bitcoin price dips throughout the first half of 2022.
Long-term holder supply
Long-term Bitcoin holders are those who have held coins for more than 155 days. As you can see in the chart below, the amount of long-term supply reached a new climax during every Bitcoin bull market. These heights were then followed by large sell-offs during the later stages of each bull market. In that sense, this metric has continued to act as a precursory indicator to date. It topped when the price of Bitcoin made a cycle low and bottomed when Bitcoin reached a cycle top.
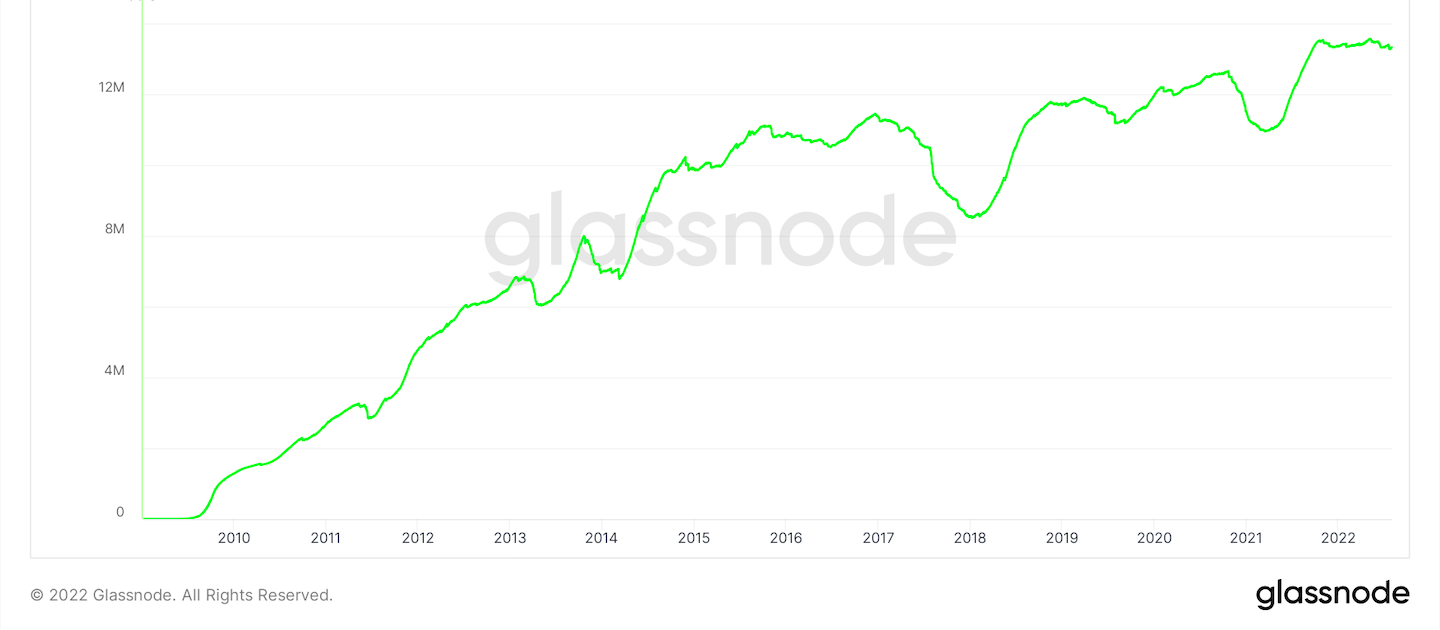
Bitcoin’s long-term supply since 2010. Source: Glassnode
For example, in the last bull run, the long-term supply bottomed at exactly Bitcoin’s cycle top in May 2021.
Considering the long-term supply made a new all-time high in November 2021 (at 13.5 million bitcoins) and continued cruising at that level ever since may suggest one or two things. Either the market bottom is already in, or Bitcoin could be poised for a substantial bear market rally in the upcoming days.
BTC balances on crypto exchanges
When the Bitcoin balance in cryptocurrency exchanges increases, it is often an indication of more people selling their bitcoins. When more people withdraw their bitcoins from exchanges to wallets, it indicates a lower selling pressure for Bitcoin.
The total Bitcoin balance in exchanges climaxed at 3.5 million bitcoins in March 2020 when people were panic-selling their riskier assets in light of the Covid-19 crisis. The BTC balance on exchanges has been dropping consistently ever since that market crash and fell to a low of 2.4 million by the end of July 2022.
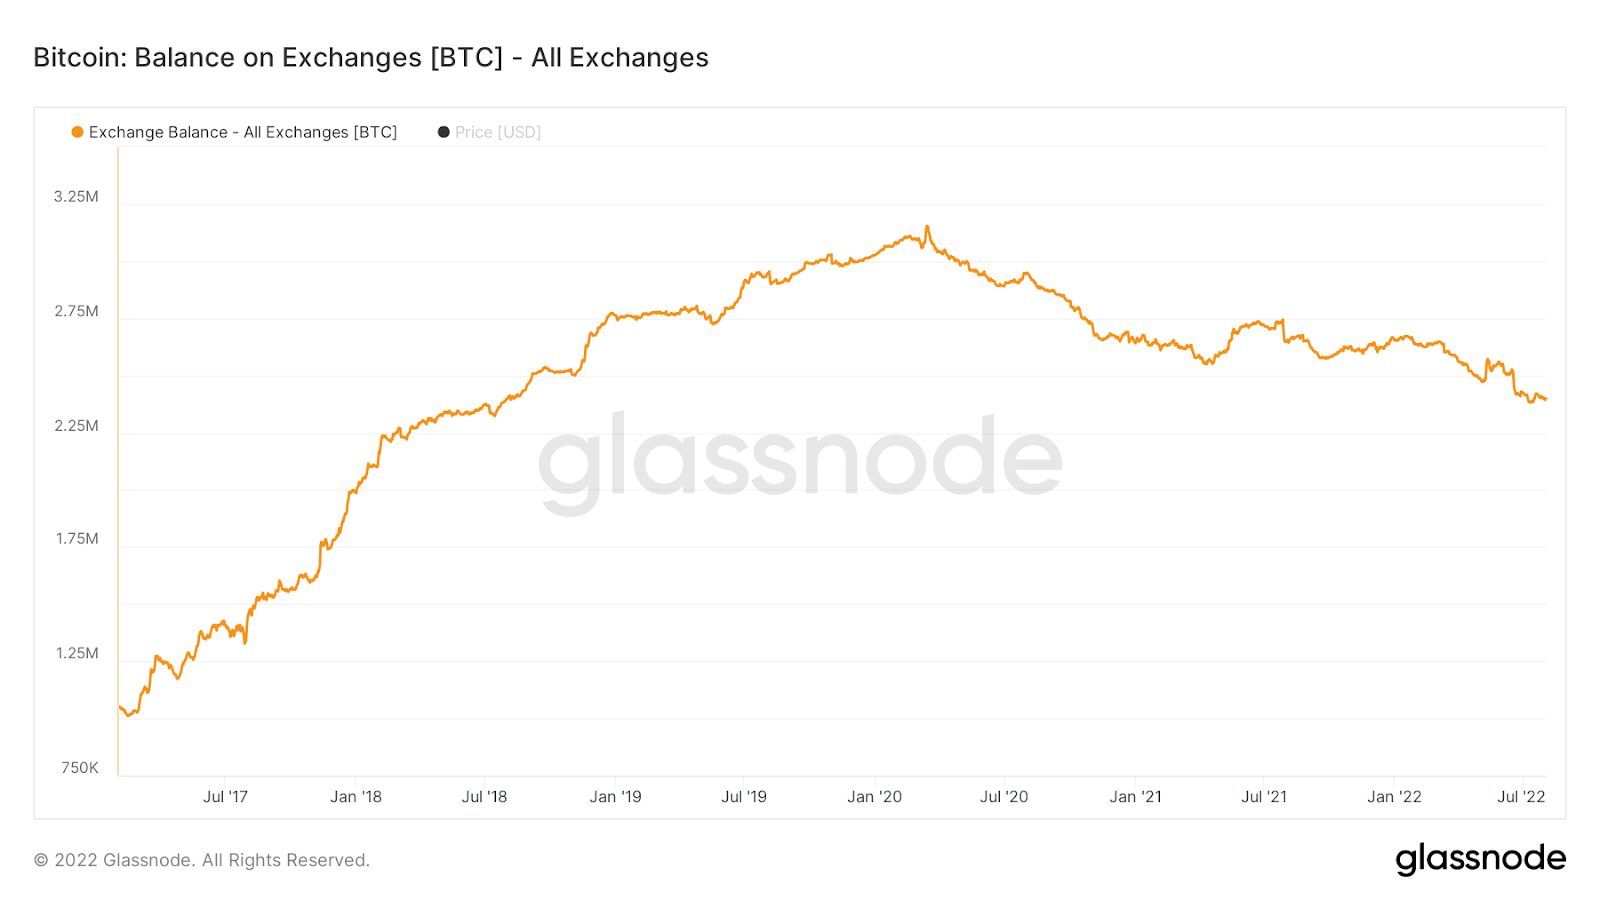
Bitcoin balance on crypto exchanges. Source: Glassnode
Spent Output Profit Ratio (SOPR)
SOPR is an indicator that calculates the ratio of realized profit or loss for all coins moved on-chain.
A SOPR higher than one indicates that larger profits are being realized, and the market has sufficient demand to absorb those profits. In bull markets, the ratio of one typically acts as support while investors buy at their cost basis during pullbacks.
SOPR values less than one indicate that larger losses are being realized, and investors are selling their coins below their average cost basis. During bear market rallies, an SOPR of 1.0 usually acts as resistance where people sell at their cost basis. On the other hand, breakouts above this level may indicate a major shift in trend.
As you can observe in the chart below, SOPR values under one correspond to price crashes and bottoming periods in Bitcoin’s history. The SOPR has been below one since April 2022 when the price of Bitcoin fell from $40,000 to as low as $17,600.
The ratio has been consolidating horizontally since the $17,600 bottom while making higher lows. It has reached the 1.0 resistance this week. Breaking above the resistance could foreshadow a Bitcoin rally to the $29,000 resistance.
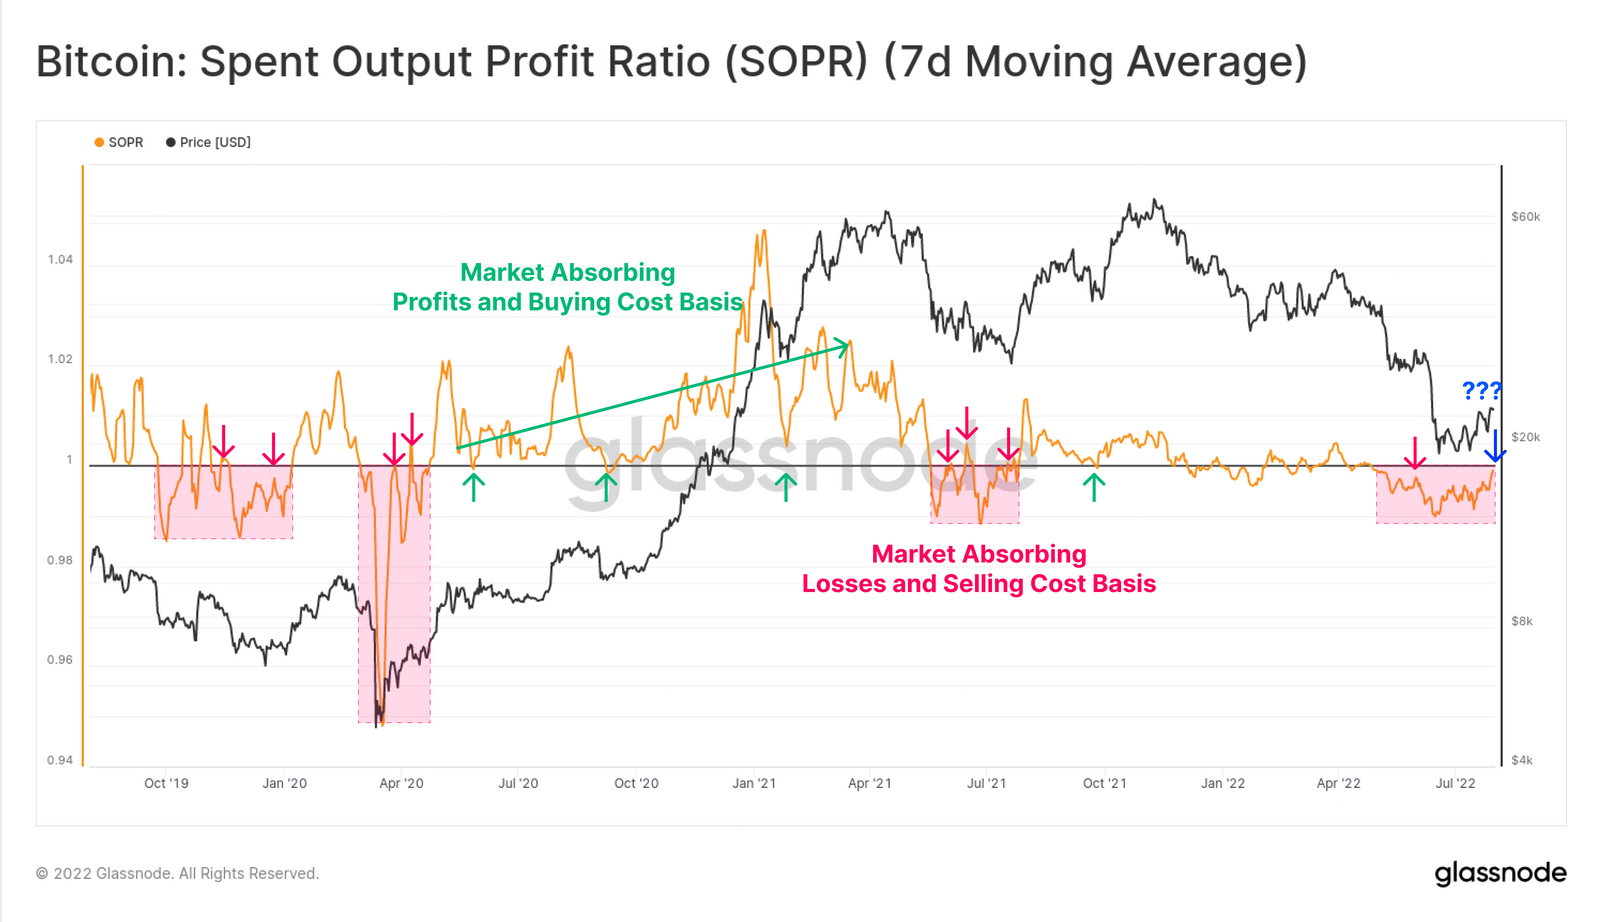
Spent Output Profit Ratio chart for Bitcoin. Source: Glassnode
Ethereum price analysis
Although Ethereum outpaced Bitcoin during July, the second largest cryptocurrency has become more coupled to the up and down movements of Bitcoin.
If Bitcoin moves to the $29,000 resistance and drags Ethereum along, the major resistance for Ethereum would be at $2,100, which is the 2021 bull market support.
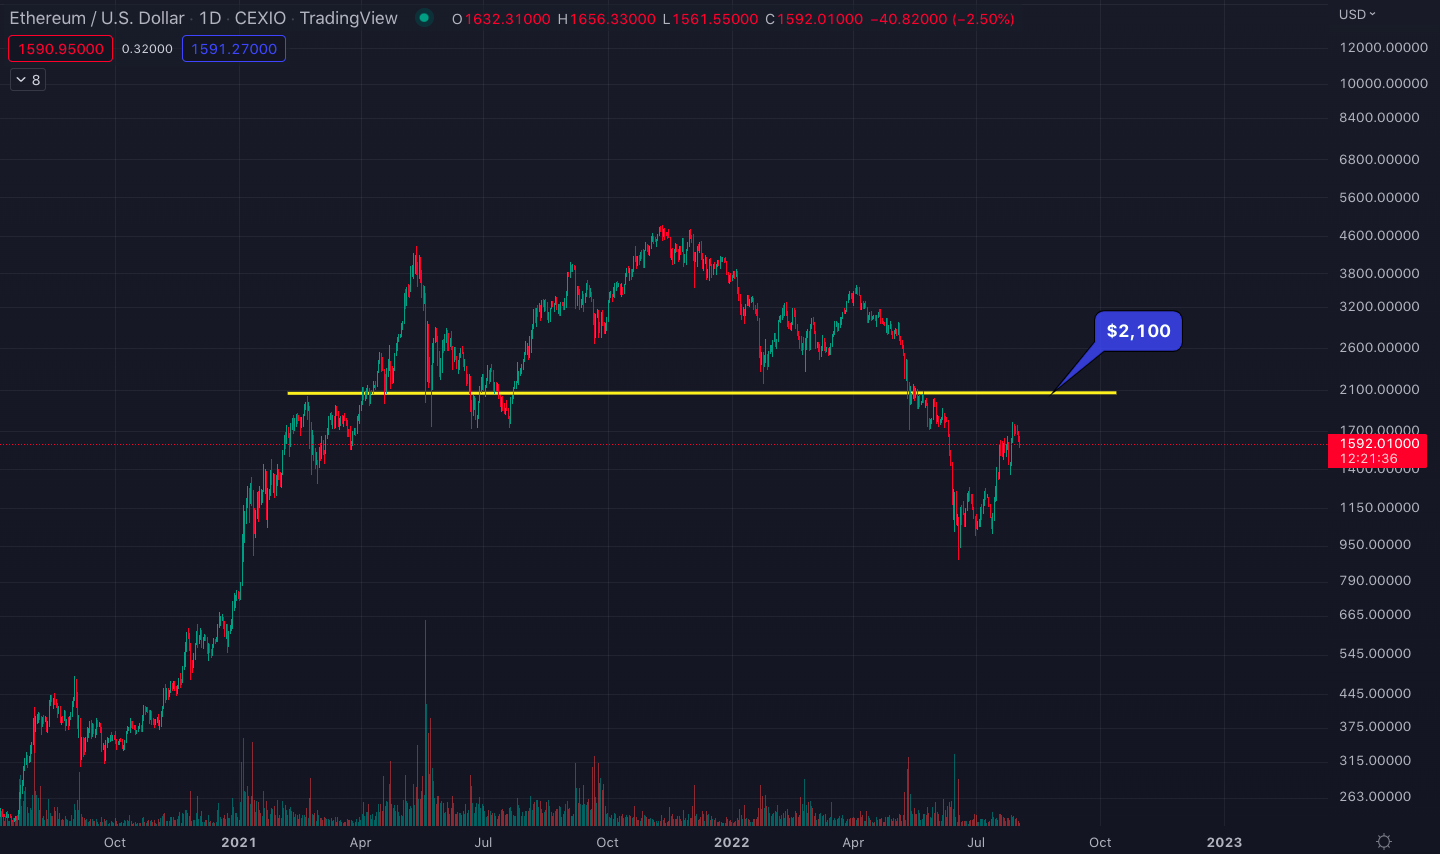
Ethereum/U.S. Dollar price chart on the daily time frame
Ethereum on-chain analysis
Over the course of 2022, the demand in the crypto market has shifted towards relatively risk-off assets. This manifested itself with a rising Bitcoin dominance against Ethereum as investors pulled capital towards the large-cap end of the risk curve.
This trend is highly similar to the early 2018 bear market which was followed by three years of relative Bitcoin strength.
The primary reason behind Ethereum’s relative weakness is the enormous deleveraging that has taken place in the DeFi sector. In many ways, this is the equal and opposite bear market reaction to the explosive growth seen in on-chain leverage and yield farming markets throughout 2020 and 2021.
The total value locked (TVL) in different DeFi protocols exploded from less than a billion in early 2020 to over $253 billion in late 2021. This resulted in Ethereum outperforming Bitcoin during the same period (the ETH/BTC parity increased from 0.02 in January 2020 to 0.09 in December 2021).
However, during 2022, the TVL has de-leveraged by 72.5%, dropping to a low of $70 billion on June 17. The TVL decline is a consequence of crashing DeFi token valuations as well as the reduction in aggregate leverage. Both factors have weighed on the Ethereum price as a liquid exit pathway for DeFi investors.
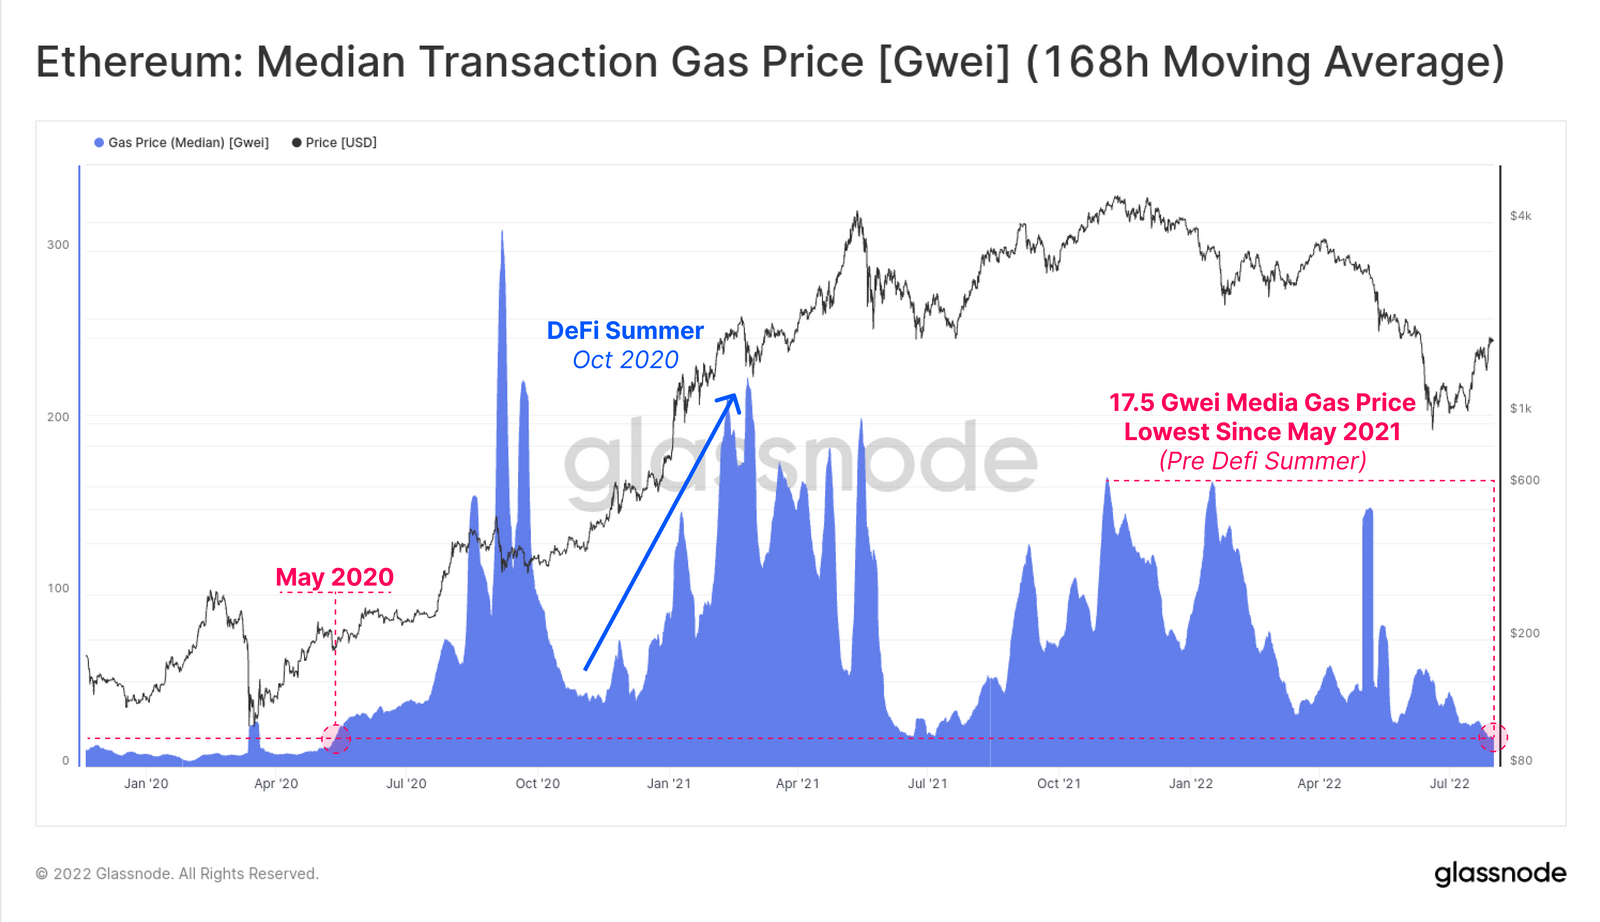
Gas prices at historic lows
Although Ethereum has generated a powerful price action over the last few weeks (from $900 on June 18 to $1,800 on July 30), its network congestion is still the lowest since May 2020, resulting in multi-year-low gas prices to transact on the Ethereum network.
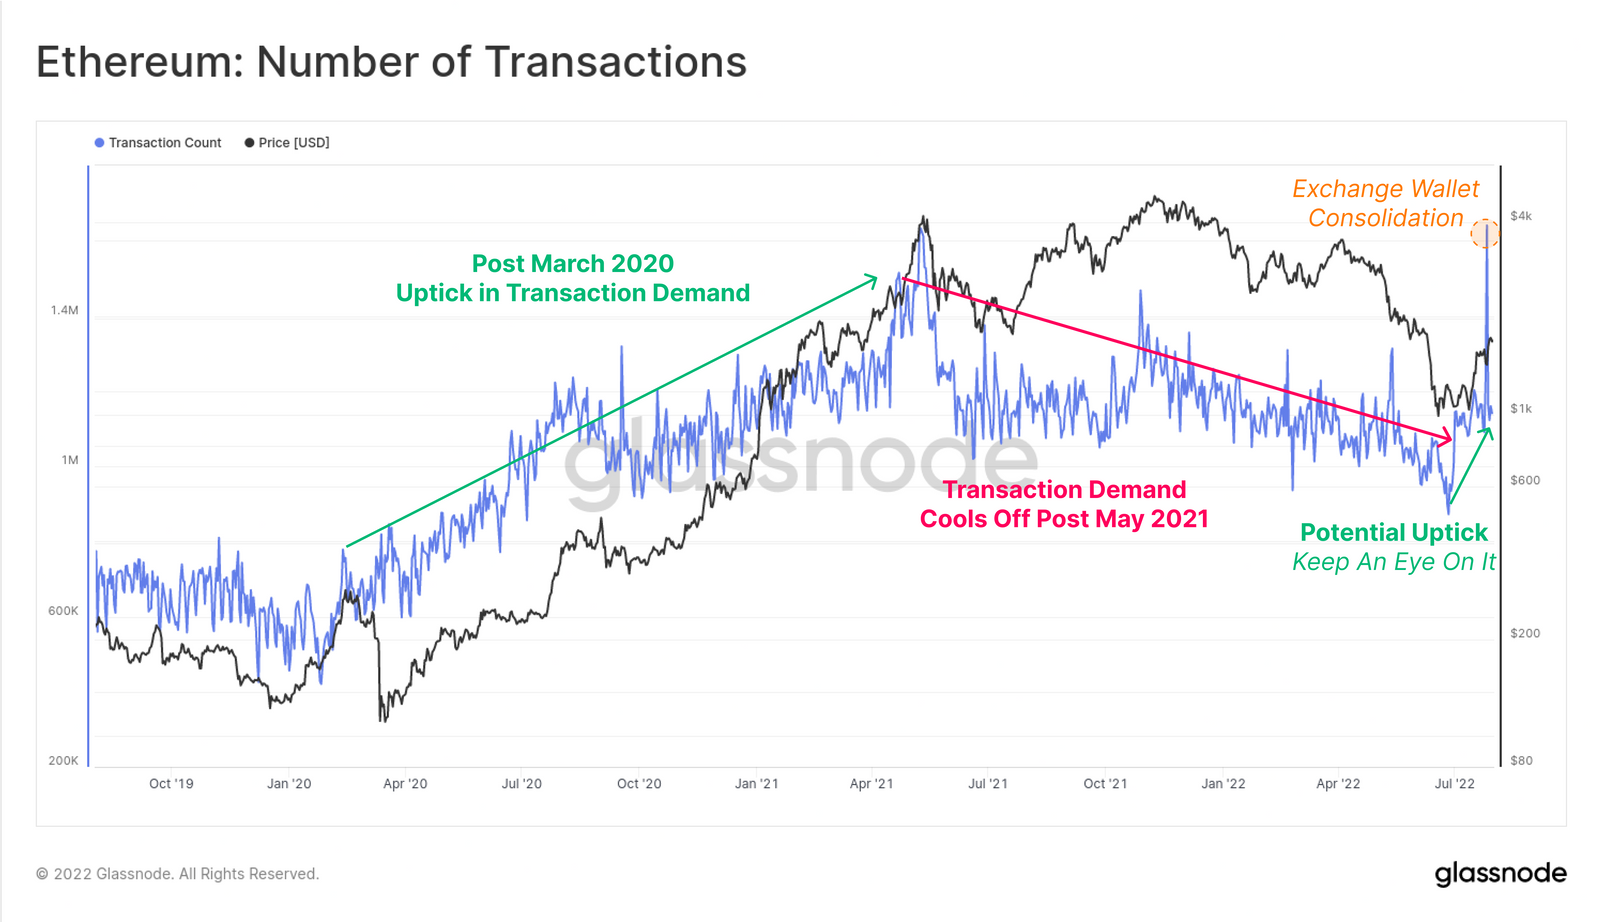
As you can see in the chart above, there was a sudden spike in July 2022 in the number of daily Ethereum transactions, which acted as a double top to the former April 2021 top. The figure has since dropped back to late 2020 levels.
Ethereum usually has a larger pool of transactions in its mempool (compared to Bitcoin) where it often sees blockspace filled to 99%+ capacity. As a result, the gas price can act as a superior method for tracking true congestion in the Ethereum network.
Ethereum gas prices have declined to 17.5 Gwei, the lowest since May 2020. This suggests that despite the recent positive price action, there has not been an influx of new users to the Ethereum network.
As a consequence, the Ether burn rate with the EIP 1559 protocol is currently at an all-time low. Total ETH burned now constitutes only 11% of the total new supply issued versus over 50% last year.
Ethereum has crossed into deflationary territory only three times in the past. This means the majority of new ETH issued on the network is making it into circulation.
Tune in next week, and every week, for the latest CEX.IO crypto ecosystem update. For more information, head over to the Exchange to check current prices, or stop by CEX.IO University to continue expanding your crypto knowledge.