This weekly piece of cryptocurrency price analysis and thought leadership is brought to you by the expert team at CEX.IO, your crypto guide since 2013. At CEX.IO, we’re committed to providing our users with every potential price scenario happening across the crypto ecosystem, all from a single resource.
In this edition, we discuss why Bitcoin is primed for volatility with liquidations at an all-time low and the open interest at an all-time high. In the 35th edition of our Crypto Ecosystem Update, we also provide some critical developments surrounding Tether, Aave, ApeCoin, and Solana.
Read along for in-depth breakdowns and enjoy reviews of correlated markets to help you make the most informed decisions along your crypto journey.
Bitcoin is primed for volatility
Bitcoin volatility is dead at almost zero (see the volatility index chart below). While the alpha cryptocurrency has never experienced such low volatility in its history, it’s also worth noting that almost all prior low-volatility periods ended with an explosive movement.
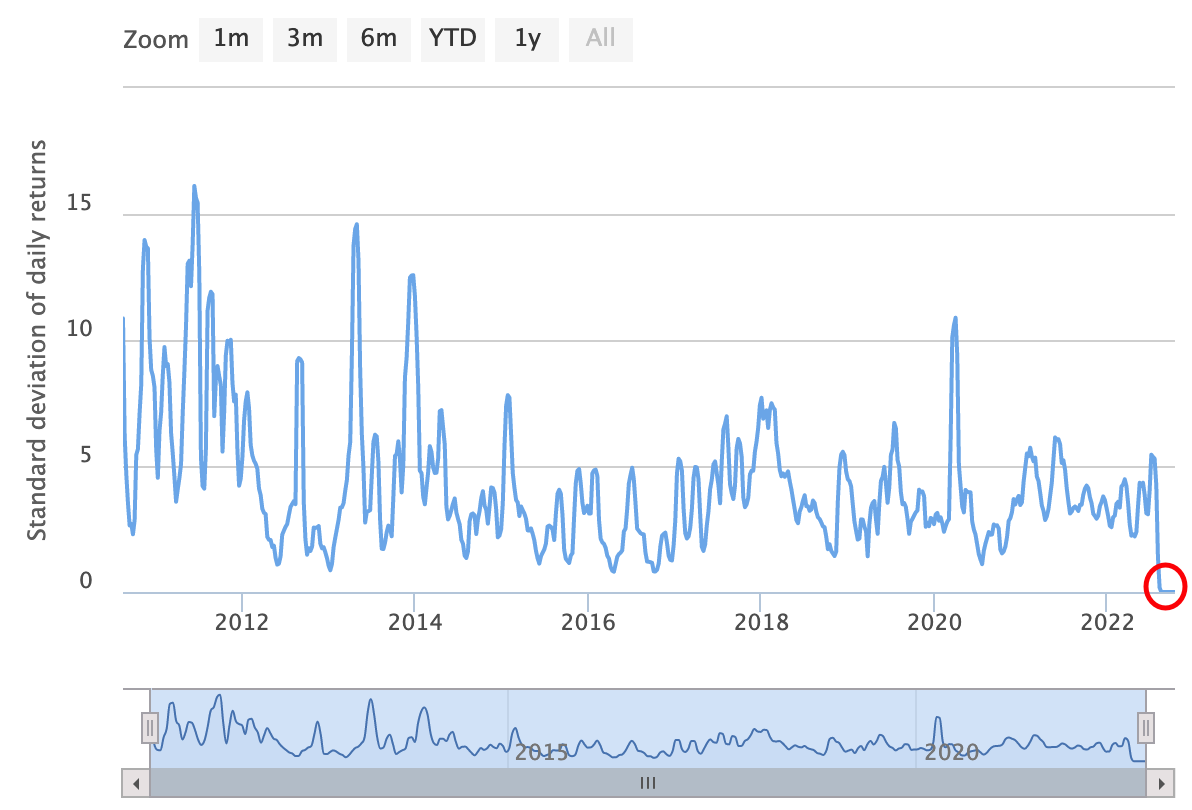
Bitcoin volatility index at almost zero. Source: Buy Bitcoin Worldwide.
Zero volatility has subsequently pushed the Bitcoin futures liquidations to an all-time low and the open interest to an all-time high.
Open interest measures the number of outstanding option contracts for a financial asset that has yet to be settled. In that sense, it shows how leveraged a market is.
Periods of low volatility typically liquidate fewer contracts and increase the amount of leverage in a market, which in turn pushes up the open interest.
Bitcoin futures liquidations are at an all-time low
In the chart below, you can observe that the percentage of liquidations to open interest is currently at historical lows.
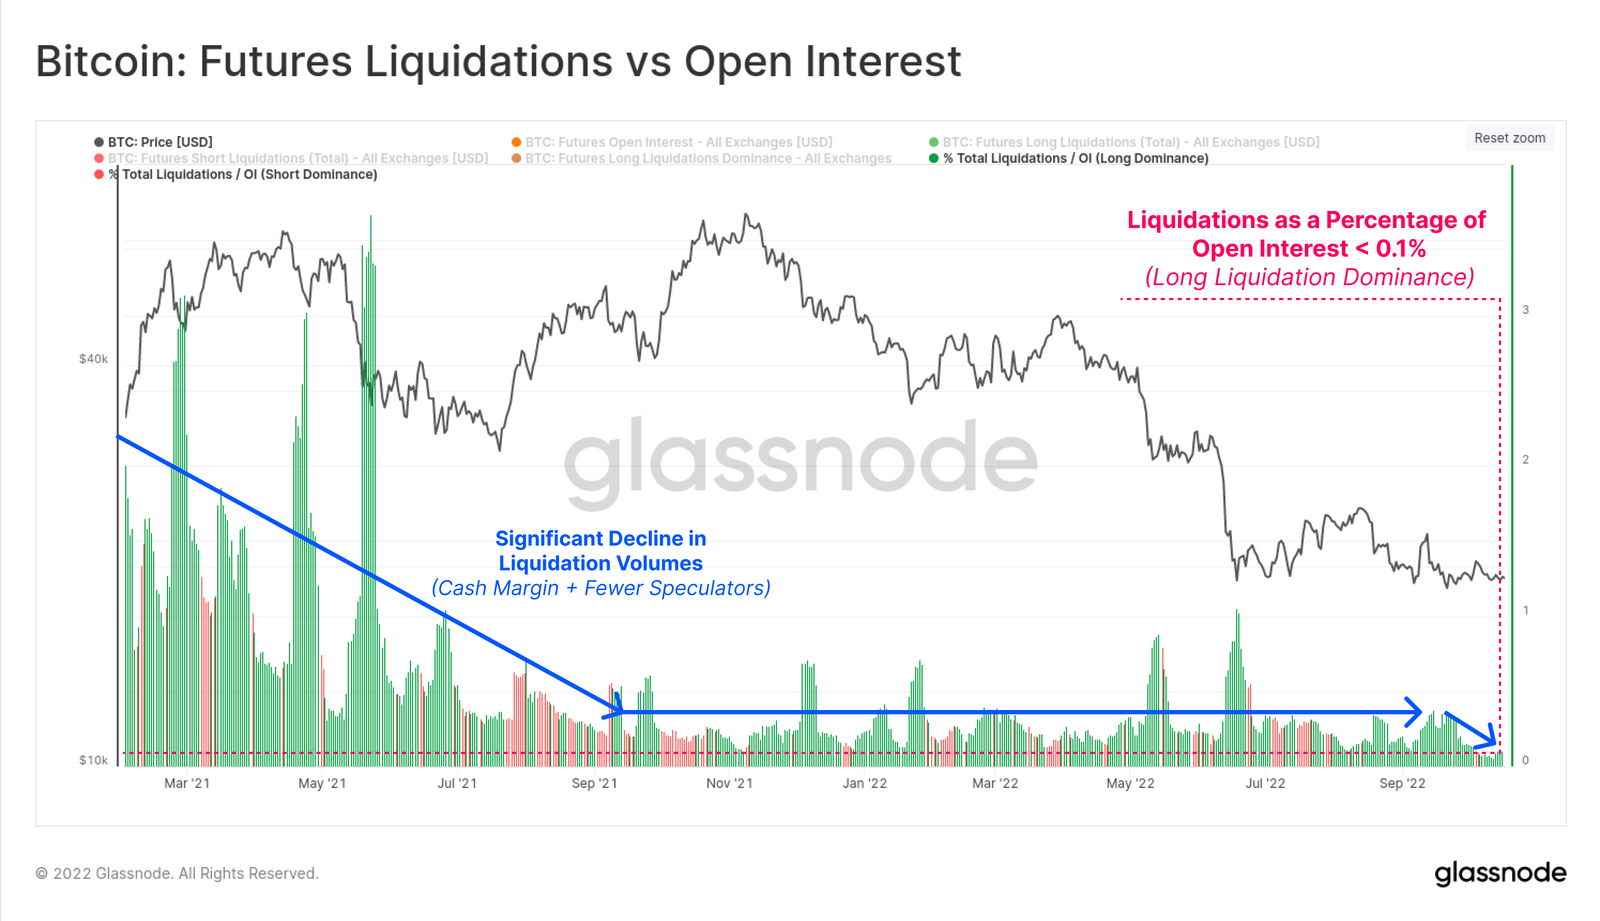
Percentage of Bitcoin futures liquidations to open interest. Source: Glassnode.
Historically speaking, significant drops in futures liquidations usually end up with a violent price movement. For example, in the past, whenever the number of short contracts piled up (or in other words, very few liquidations), they were ultimately liquidated with a strong Bitcoin rally (see the red-circled areas in the chart below).
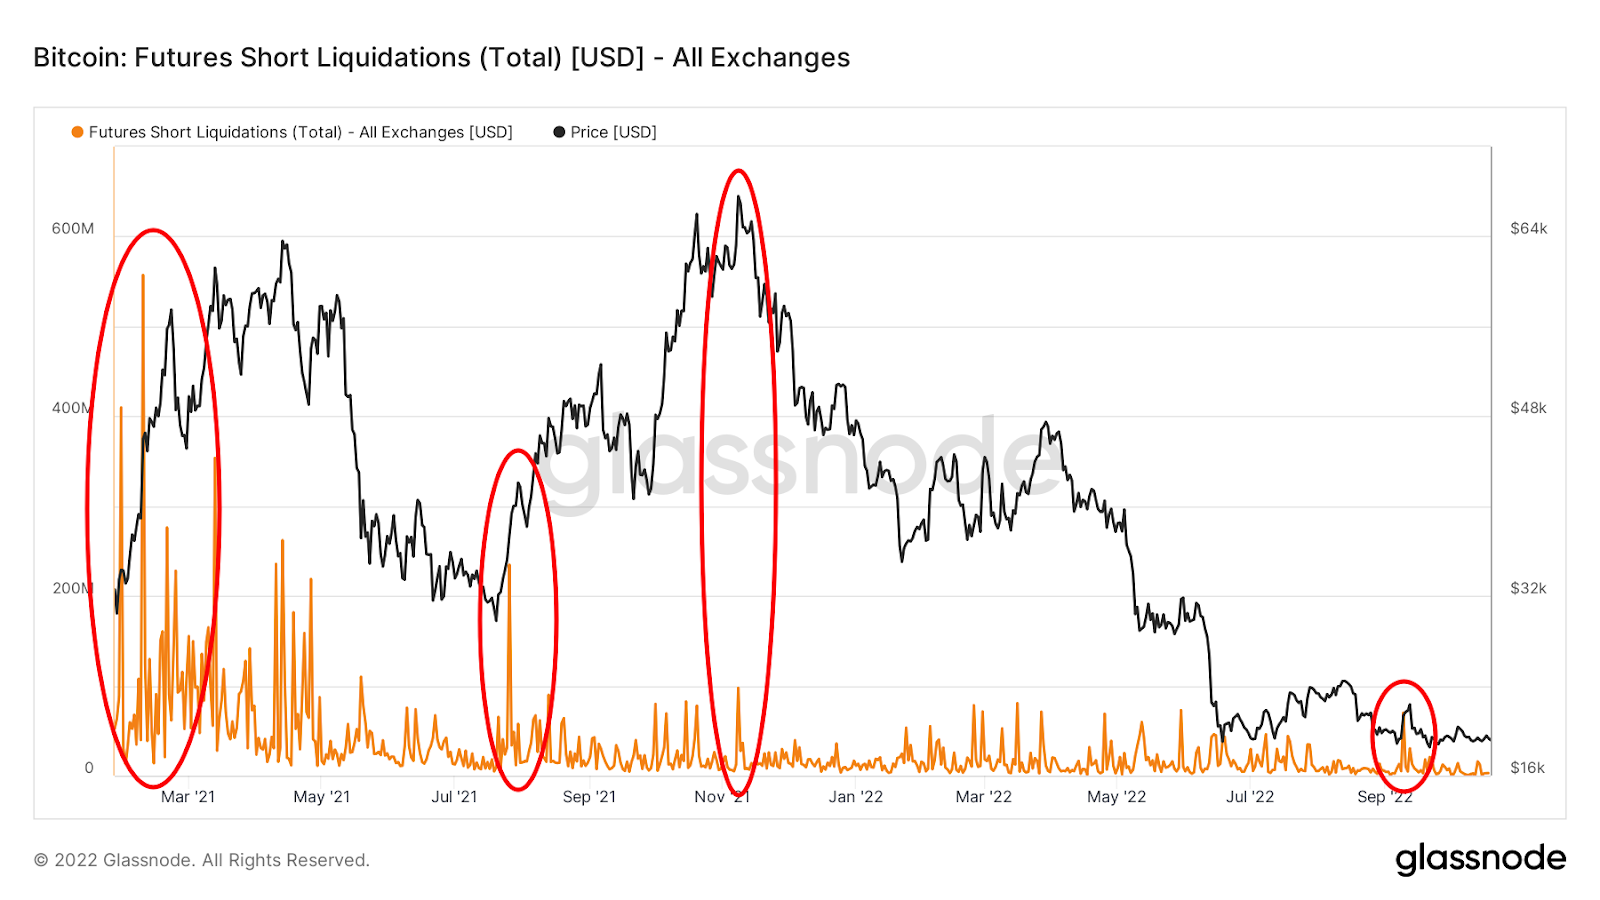
Short liquidations for Bitcoin futures. Source: Glassnode.
The same phenomenon holds for long contracts as well. When the number of long contracts spiked in the past, they were followed by a significant downtrend:
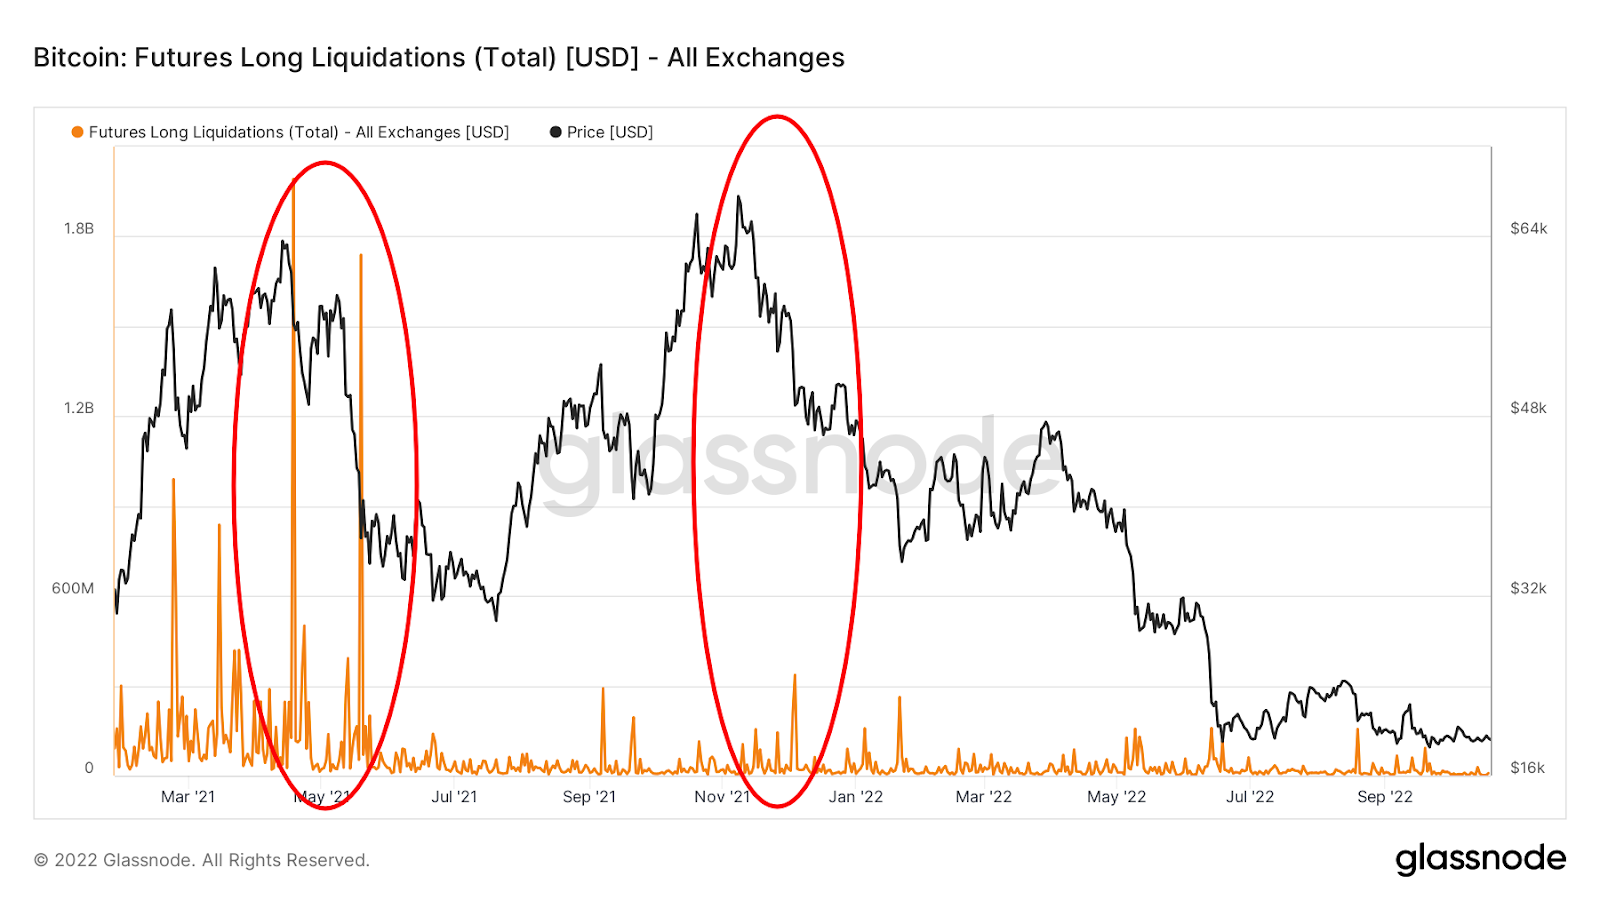
Long liquidations for Bitcoin futures. Source: Glassnode.
Bitcoin’s open interest is at an all-time high
Extremely low liquidating activity has in return rallied Bitcoin’s open interest. Bitcoin-denominated futures open interest has reached a new all-time high of 633,000 BTC, an 80% increase since the collapse of the LUNA-UST project in May 2022 (see the chart below).
This suggests that speculation and thus leverage have increased in the market even though the price of Bitcoin declined significantly.
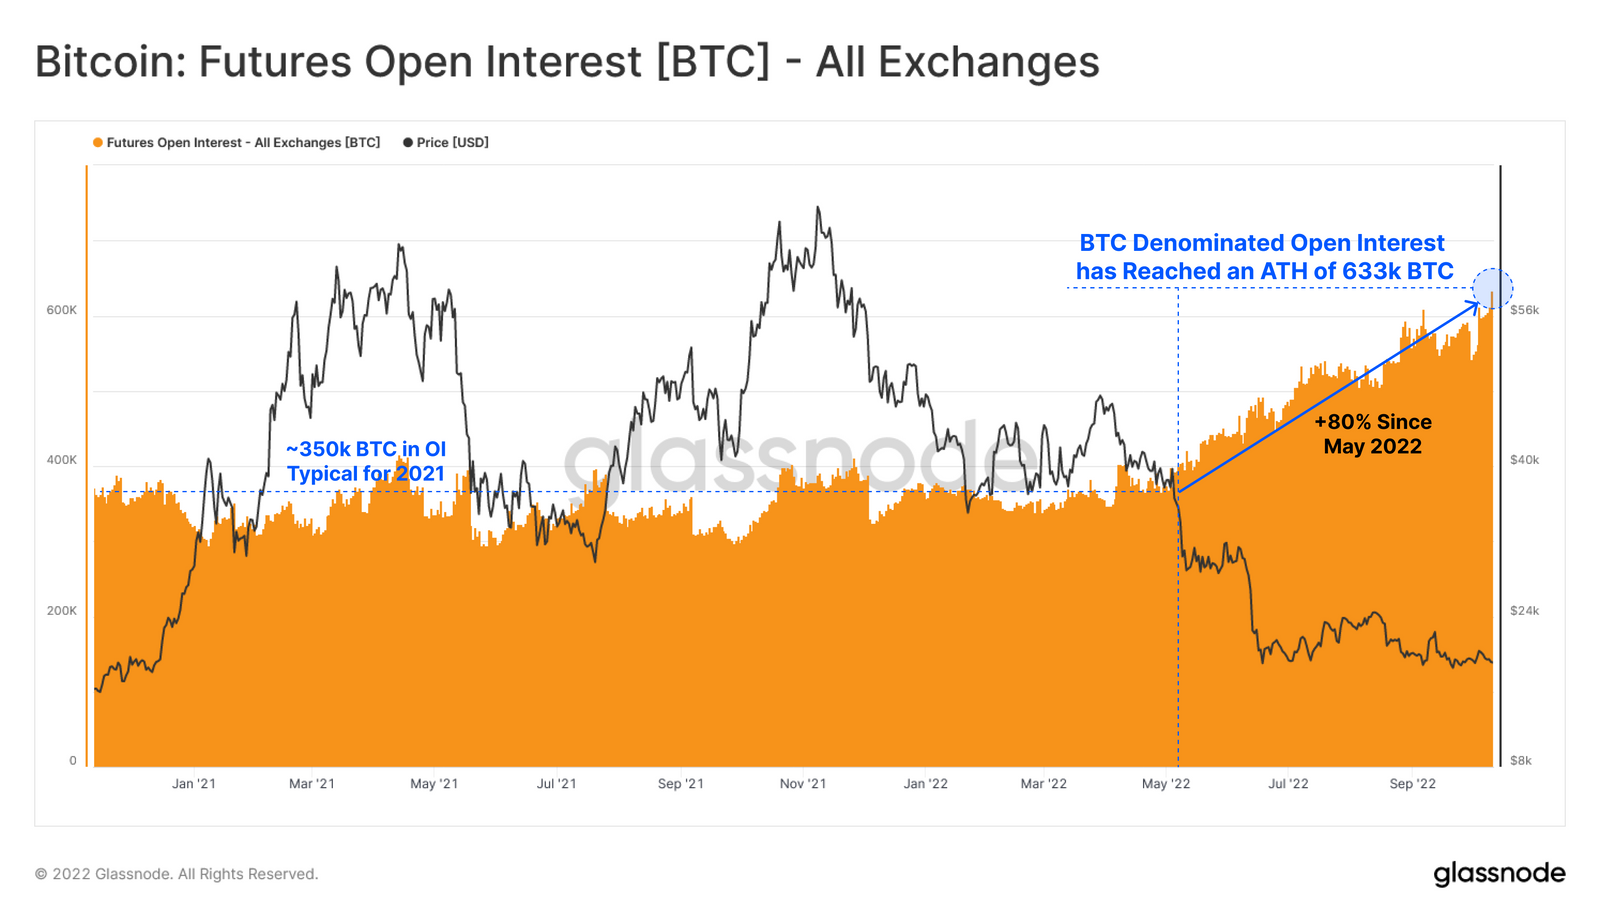
Bitcoin futures open interest chart. Source: Glassnode.
SOPR multiple
The Spent Output Profit Ratio (SOPR) calculates the ratio of realized profit or loss for all bitcoins over a given period.
A SOPR value above a certain threshold could indicate that holders are selling their coins for profit, while a value below that threshold could mean they are selling at a loss.
Since July 2021, the short-term holder SOPR (STH-SOPR) multiple has reached the same 8.0 resistance for the fifth time, battling for a shift to profitability (see the right-hand side of the chart below).
Each prior attempt to surpass the current level was met with rejection and a subsequent decline in the price of Bitcoin. However, the magnitude of drops in the STH-SOPR multiple has diminished over time, indicating an increased likelihood that seller exhaustion could be occurring.
In addition, the structure of the STH-SOPR chart following the July 2021 bottom has been following an ascending triangle (the green arrow on the right end of the chart), which is usually a trend reversal formation. Considering this, the fifth touch of the multiple to the resistance could finally result in the triangle breaking to the upside.
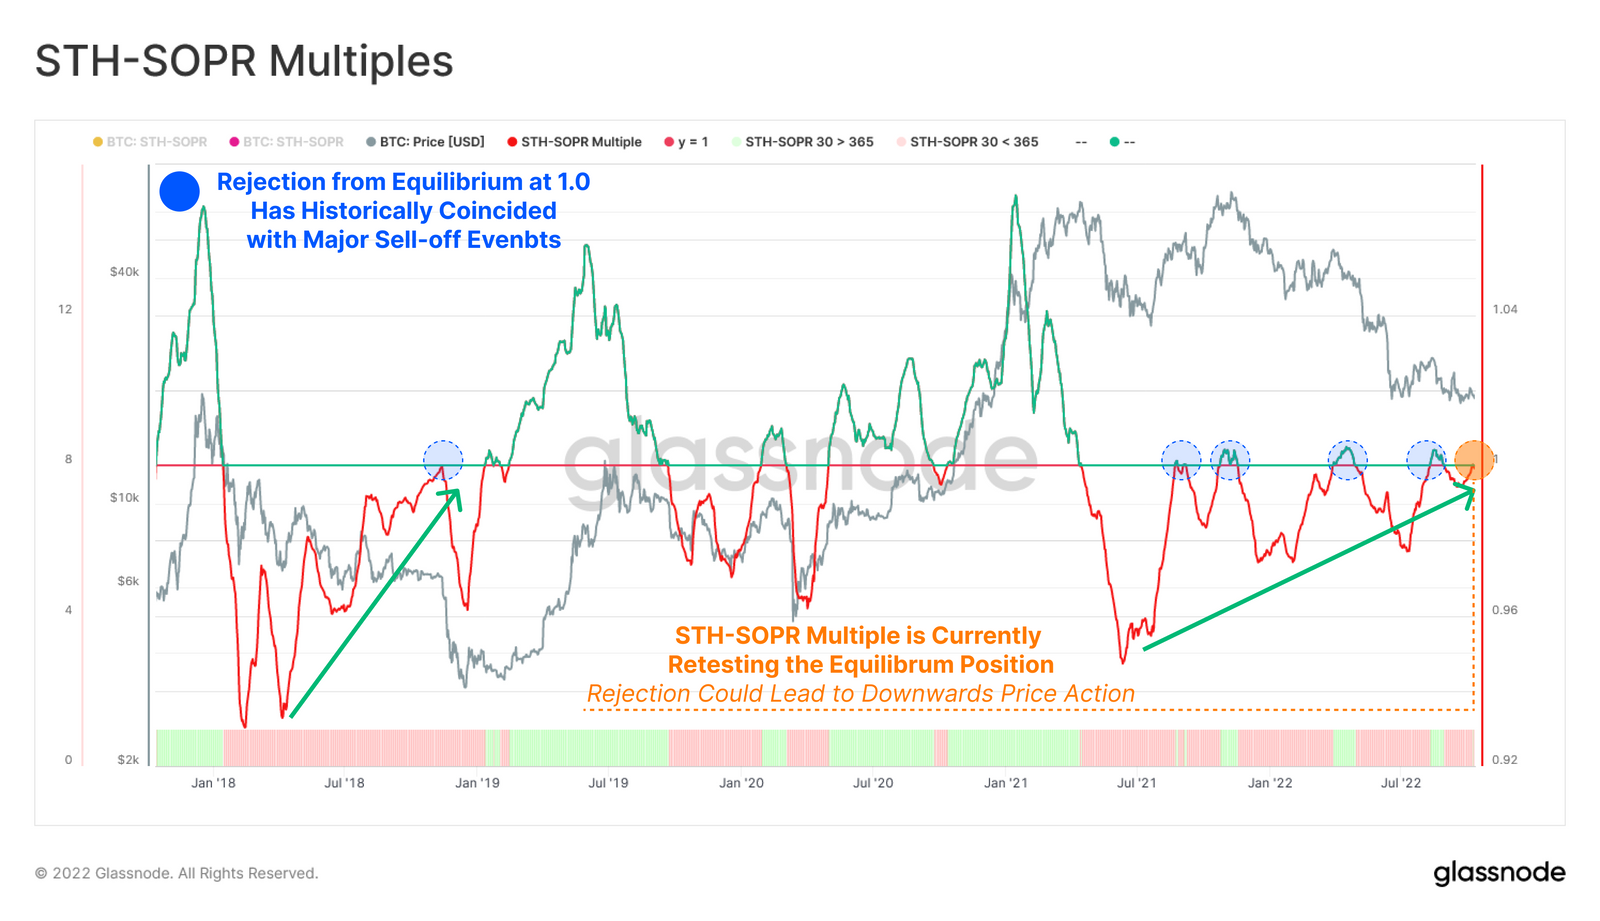
Short-term holder SOPR-multiple chart with the 8.0 resistance.
On the other hand, the long-term holder SOPR languishes at historical lows, with long-term investors locking in losses at an average of -52% (see the chart below). Considering the stable price of Bitcoin during the last five months, the majority of these investors could be those from the 2021-2022 cycle, who continue to capitulate their positions at a loss.
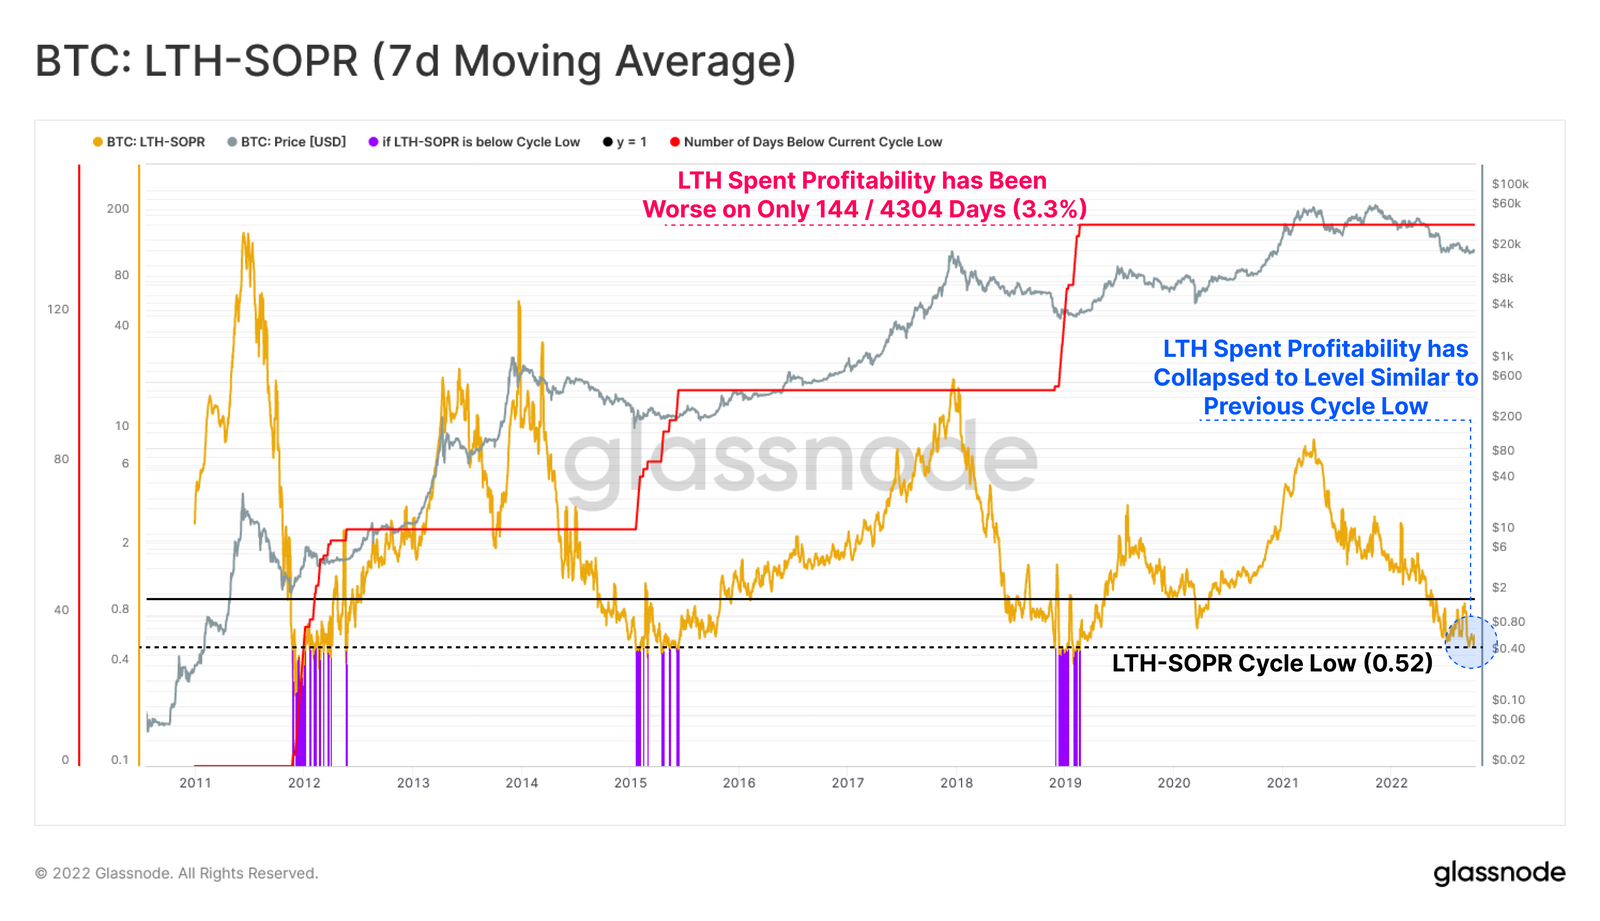
Long-term holder SOPR-multiple chart at all-time lows.
Tether is now backed by Uncle Sam
Tether has finally changed the heavily-criticized backing mechanism of its stablecoin, USDT.
The company eliminated $30 billion worth of commercial paper from its reserves and replaced it with U.S. Treasury bills.
Commercial paper is a short-term, unsecured corporate debt that usually carries a high credit risk. The largest stablecoin issuer has faced criticism over its dependence on commercial paper as the primary backing for its USDT stablecoin.
Tether has been battling to improve its reputation after rumors circulated earlier this year that USDT was as much as 85% backed by Chinese commercial paper.
The substitution of commercial paper with the “safe haven” U.S. Treasury bills could be a crucial relief for the cryptocurrency industry as USDT has long constituted its backbone, with millions of traders parking their funds at this stablecoin as a practical U.S. dollar alternative.
Aave continues to pump
Following the June 18 crypto market bottom, Aave has been one of the strongest runners with the price of its native token surging from $46 to a high of $116 on August 12.
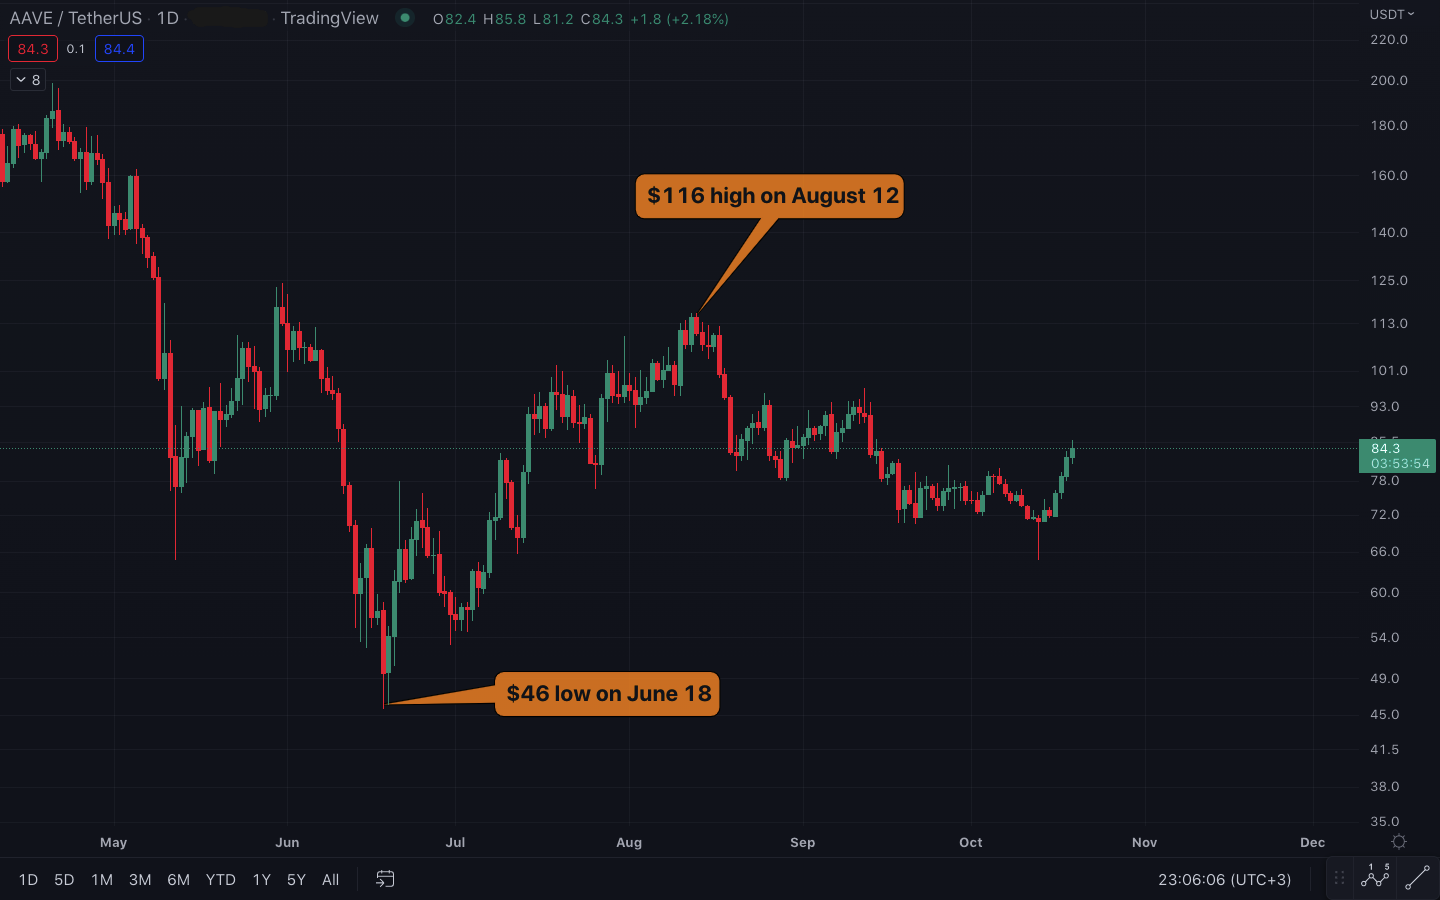
Aave/U.S. dollar price chart on a daily time frame. Source: Tradingview.
The main propeller behind this market-leading move was the announcement that Aave plans to launch a U.S. dollar-pegged stablecoin, called GHO.
Once the stablecoin hype cooled down, the price of $AAVE started correcting heavily (from $116 to a low of $65) before recently reversing with a big bear trap on October 13, the day of the U.S. consumer price index (CPI) announcement.
That day, Aave launched on the Metis layer-2 (L2) chain which brought about heavy buying activity at the $65 low and a subsequent 30% price surge. With this move, $AAVE broke above the short-term descending resistance in effect from August’s $116 high (see the chart below).
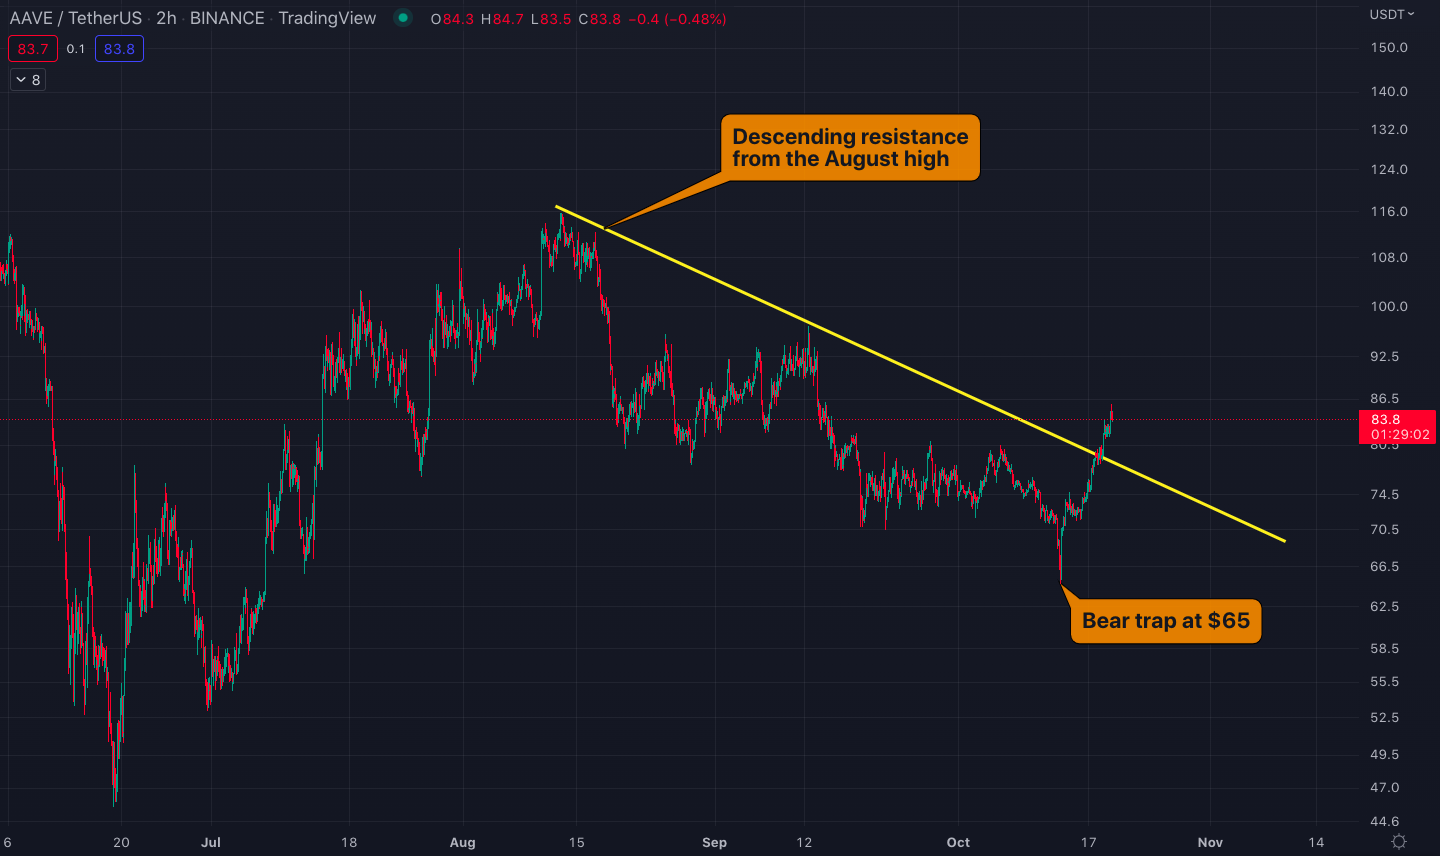
Aave/U.S. dollar chart with the price breaking out of the descending resistance.
If more catalysts keep pushing Aave in the upcoming days, the price of its token could march back to the summer highs and test $116 as resistance. Considering this, any updates on the Aave front could be worth keeping a close eye on.
Yuga Labs is next on the SEC hot seat
The U.S. Securities and Exchange Commission (SEC) is now eyeing Yuga Labs for further scrutiny.
The regulator is looking into whether Yuga Labs’ ApeCoin could constitute a security due to an unregistered sale during the coin’s launch. The SEC is also investigating whether the Bored Ape Yacht Club (BAYC) NFTs by Yuga Labs could be treated like stocks and should therefore follow the same rules that govern securities.
The SEC has been increasingly stepping into the crypto space in recent years. Besides its popular, high-profile case against Ripple, which claims the crypto project is a security, the regulator also came after nine separate listings on Coinbase last summer alone.
Yuga Labs however remains adamant that it is not the creator of ApeCoin (APE). It instead claims the ‘Ape Foundation,’ a board composed of Web3 builders, is its “steward,” although convincing the SEC of this could likely prove tricky.
In light of the SEC probe, APE is down by almost 20% this month.
Being a new cryptocurrency that just launched this year (March 2022), APE does not have much trading history, which translates to weak support and resistance levels. The only meaningful support that APE seems to have is the $3 level, which is a further 30% down from the current price.
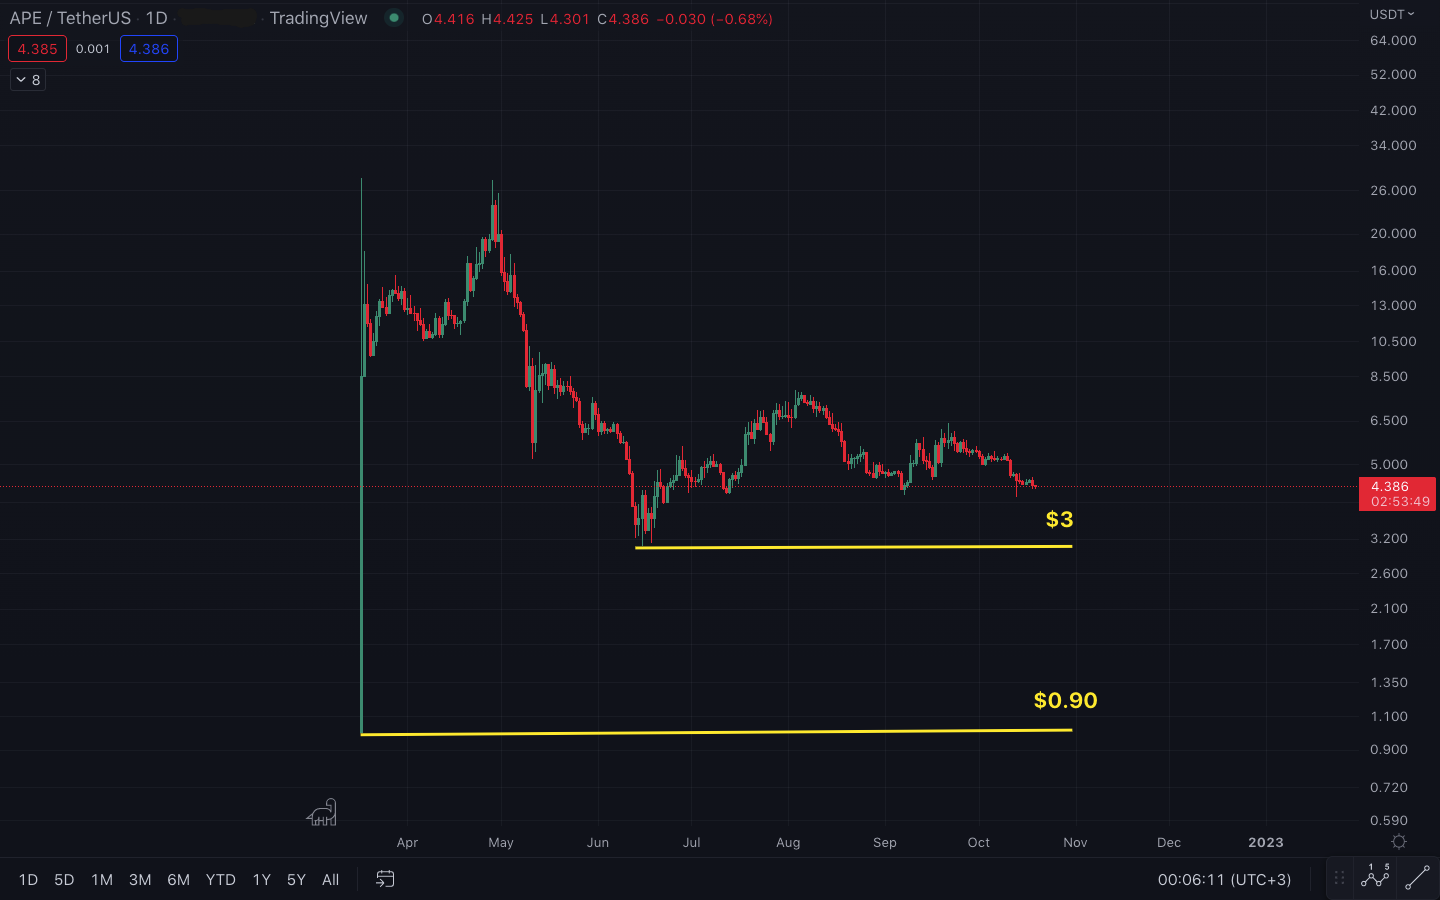
APE/U.S. dollar price chart on a daily scale.
And even $3 may not hold strong given the coin’s recent debut without much trading history. If the SEC decides to hit hard on Yuga Labs in the upcoming days and the $3 level is lost, there is little that could hold APE from not dropping to the $0.90 level, the price at which APE was first publicly traded.
Solana’s Mango poisoning
Solana’s Mango Markets DeFi platform was drained of $100 million in funds on October 12 after the protocol’s price oracles were attacked.
Upon taking control of the oracles, hackers were able to manipulate the asset prices to take out loans that were much larger than the value of their collateral. This ended up crashing the price of MNGO, Mango’s native token, by over 50%.
On the contrary, Solana’s native token, SOL, was barely affected by this incident, with its price only dropping less than 10% following the incident.
However, it is possible for price action to follow with a lag if further negative catalysts join the picture. Given its price movements earlier in the year, SOL could be on the verge of falling off a cliff, especially if Bitcoin loses the $18,500 support. In that case, the next material support would be at the $20 level, 30% lower than the current price.
While all these actions require a number of peripheral events to transpire, it will be interesting nevertheless to see which factors end up contributing long-term to the markets.
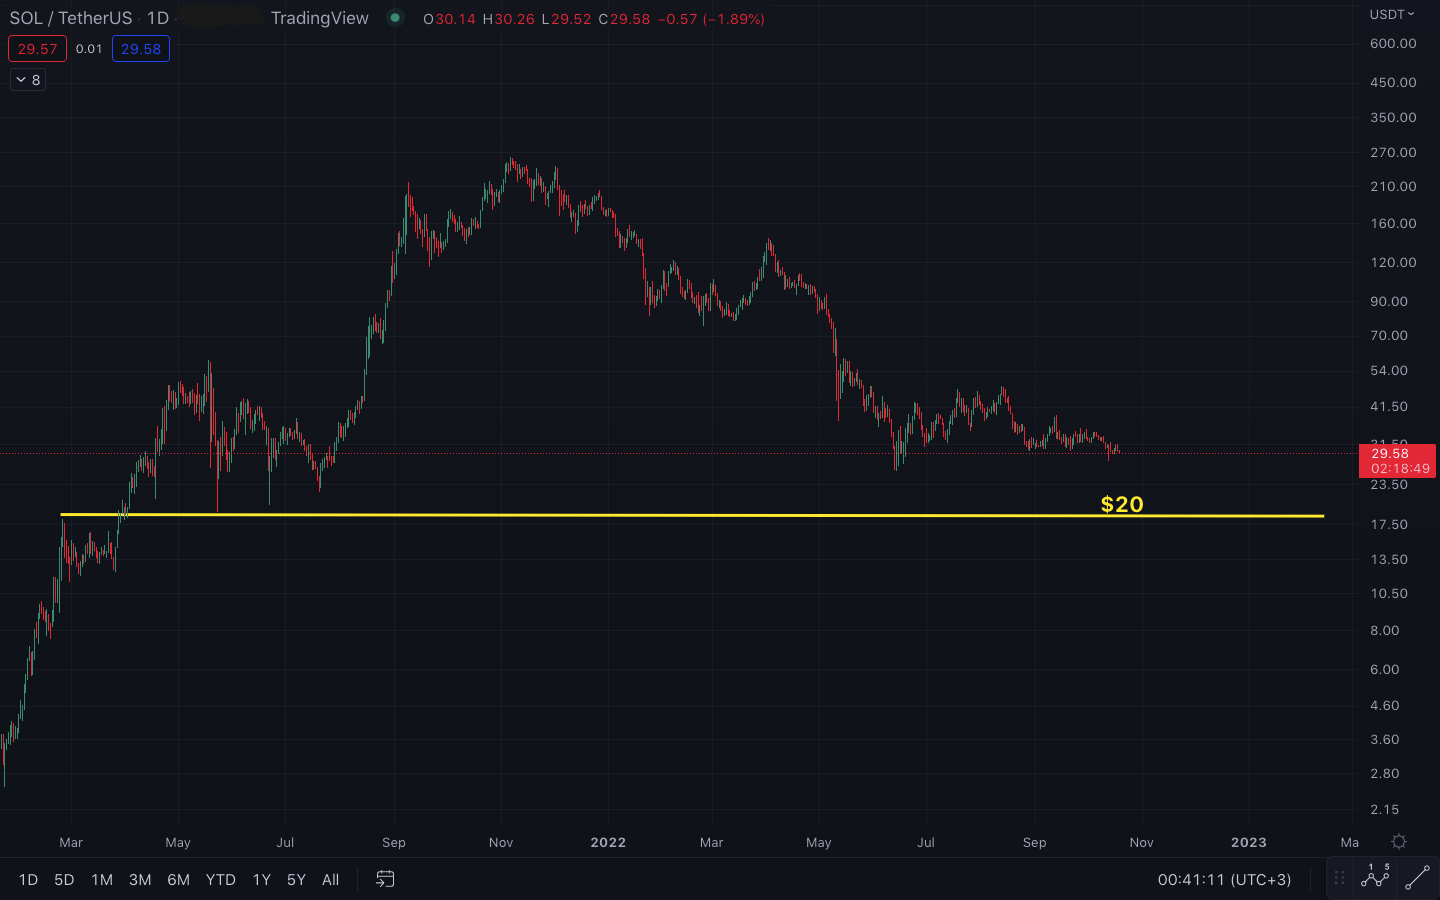
Solana/U.S. dollar chart on a daily scale
Tune in next week, and every week, for the latest CEX.IO crypto ecosystem update. For more information, head over to the Exchange to check current prices, or stop by CEX.IO University to continue expanding your crypto knowledge.
Disclaimer: Information provided by CEX.IO is not intended to be, nor should it be construed as financial, tax or legal advice. The risk of loss in trading or holding digital assets can be substantial. You should carefully consider whether interacting with, holding, or trading digital assets is suitable for you in light of the risk involved and your financial condition. You should take into consideration your level of experience and seek independent advice if necessary regarding your specific circumstances. CEX.IO is not engaged in the offer, sale, or trading of securities. Please refer to the Terms of Use for more details.