As we approach the midway point of July, Bitcoin and the surrounding cryptocurrency space has yet to make a decision. Sidelined traders remain patient while BTC channels between the $19,000 and $22,500 levels, unwilling to pick a direction. Many crypto analysts continue to point to evidence of a possible price bottom being formed, yet bears are still attempting to push down every local high.
Of course, Bitcoin continues to direct the market as other assets wait for it to make an aggressive move. The implications of this can be felt on the ETH/USD chart where ETH has also found itself in a price channel. With the much-awaited Ethereum “merge” still on the way, holders of this asset remain skittish in anticipation of either a price run or a “sell the news” event.
In the meantime, it seems that there is a plethora of activity happening across the entire cryptocurrency industry. So-called “bear markets” have always meant that companies are busy building, but we have witnessed a number of other narratives developing as well. In the aftermath of the Three Arrows Capital and Terra scandals, associated parties are left to pick up the pieces and move forward. We bring updates on these situations as well as the rumored Mt. Gox BTC reimbursements. Before anything else, let’s take a look at the crypto leader, Bitcoin.
BITCOIN ANALYSIS
Price Overview
- Last 7-day change: -5.97%
- 7-day low: $19,386
- 7-day high: $22,405
- Last 30-day change: -26.5%
- 30-day low: $17,625
- 30-day high: $26,515
Bitcoin Technical Analysis:
This past Friday, crypto prices overall looked promising with a show of strength heading into the weekend. After a six-day uptrend, Bitcoin reached a short-lived high of $22,500 before forming a long-legged doji candle and beginning a trend in the opposite direction. This was a clear opportunity for unbiased traders looking for weakness at a resistance level, and now BTC continues to teeter on the edge of the historic $20,000 marker. If we fall under this level, it’s possible that analysts will be calling for new lows.
BTC’s current position
There’s no denying that BTC remains in a precarious position. While optimistic bulls continue to wait patiently for a break to the upside, traders continue to sell every slight move, showing that bears are still very much in control. Many spectators would arrive at the conclusion that we are building momentum for another leg down in the ninth month of this bear market, and the charts seem to support this mindset.
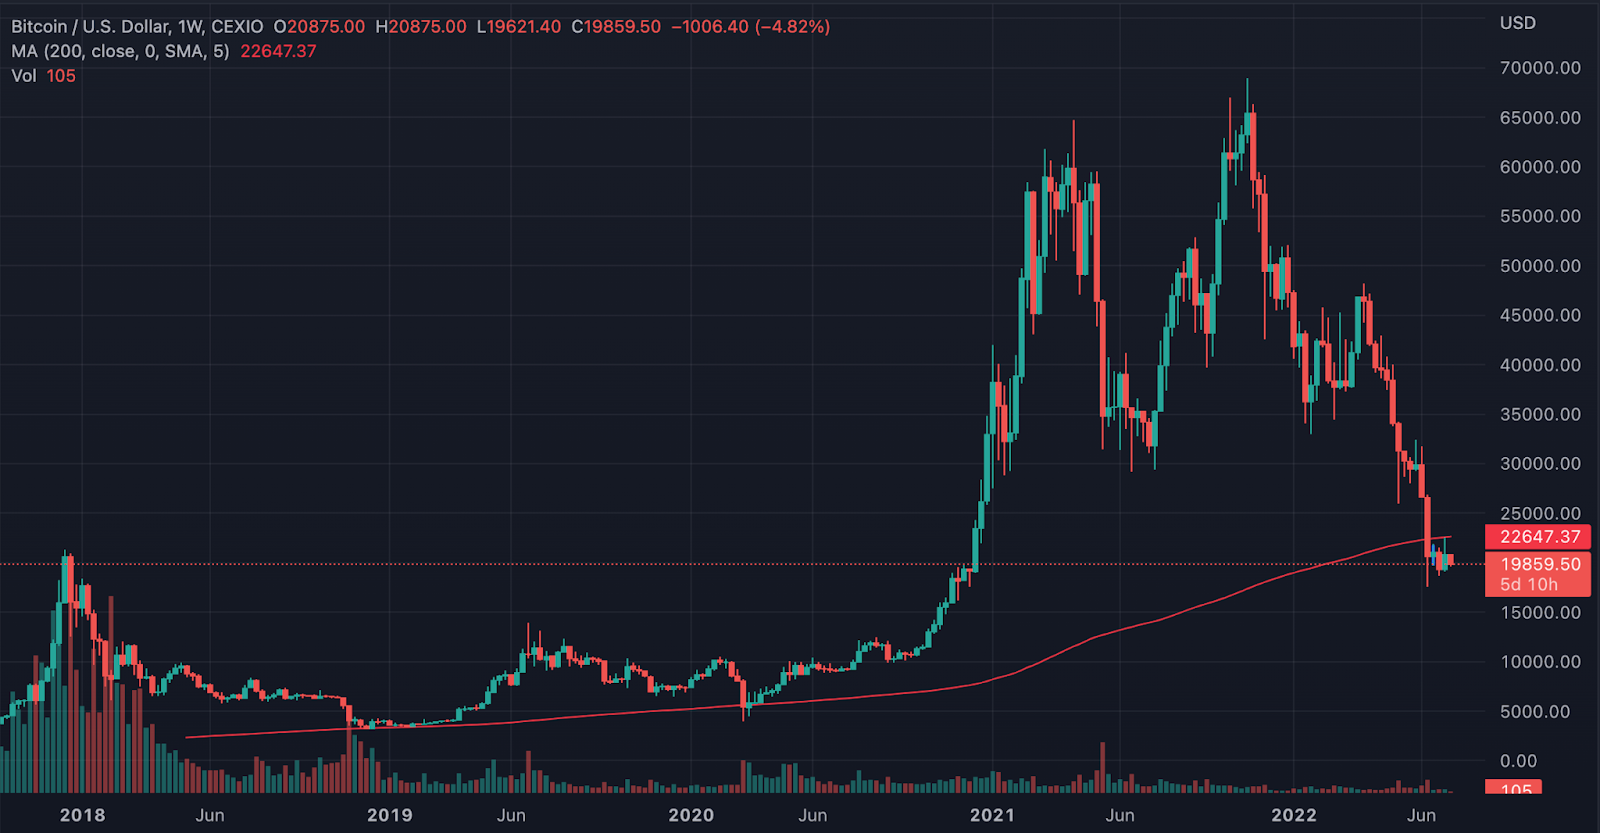
BTC price sitting below the 200-week moving average.
As it currently stands, BTC resides under the 200-week moving average. This is a position that hopeful bulls most certainly do not want to see. Although you could argue that the greatest potential is on the long side of a trade, the fact is that the macro trend is still pointing down until further notice.

BTC bearish pennant on the daily chart.
ETH bearish pennant on the daily chart, a breakdown is occurring.
In addition, a bearish pennant has clearly formed on both the BTC and ETH daily charts. The distinction between the two is that ETH has already collapsed through its pennant to the downside. BTC is holding strong at the moment, but a move through the bottom of this pennant could signal that further lows are inbound.
As ETH is representative of the entire altcoin market, any move to the downside could cause capitulation across the board. This would likely be the result of traders who stocked up during this recent accumulation and anticipated a move to the upside and are now rapidly exiting their positions.
Possible lower levels
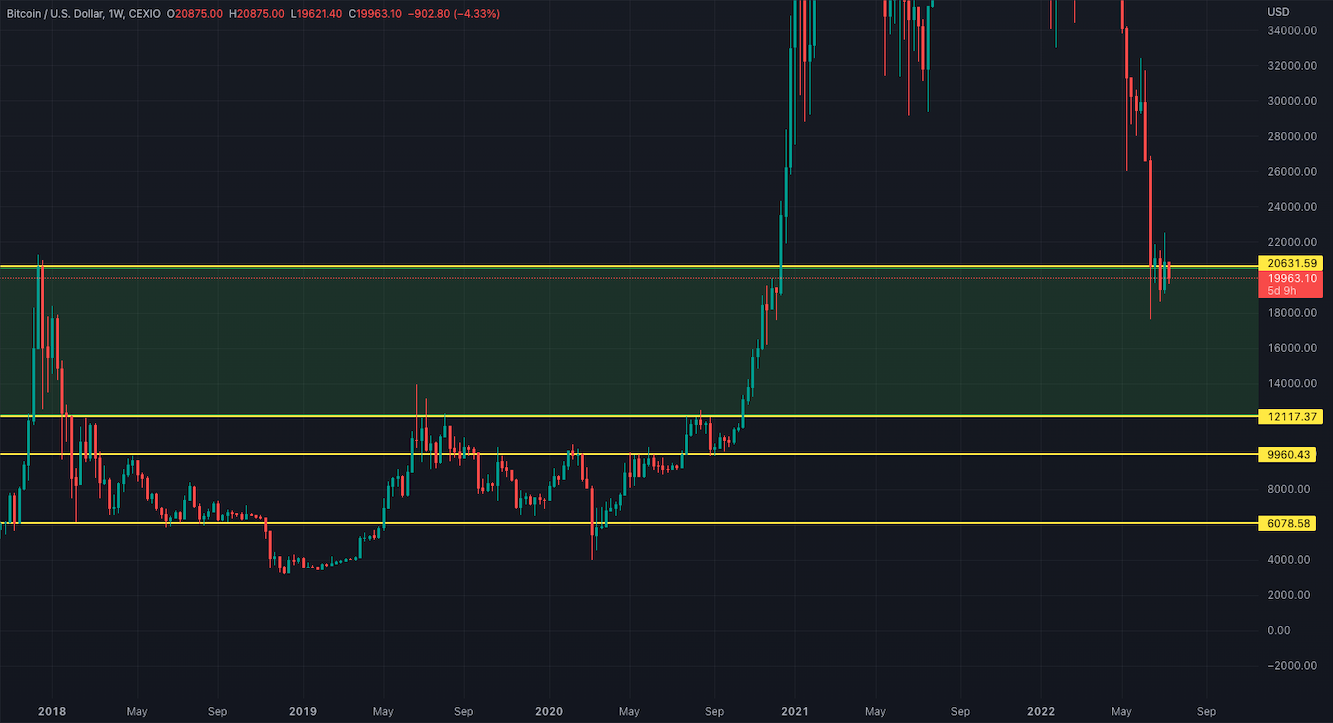
Trendlines from $20k to $6k and the channel BTC currently sits in.
BTC has found itself sitting in a familiar price channel. As long as BTC remains below the historic $20,000 marker, it is caught in the range that ends around $12,000. This is certainly not what bullish traders want to see, but without any major support areas until that $12,000 level is reached, the price could collapse if BTC does not make a break to the upside soon.
Indicators pointing to an oversold environment?
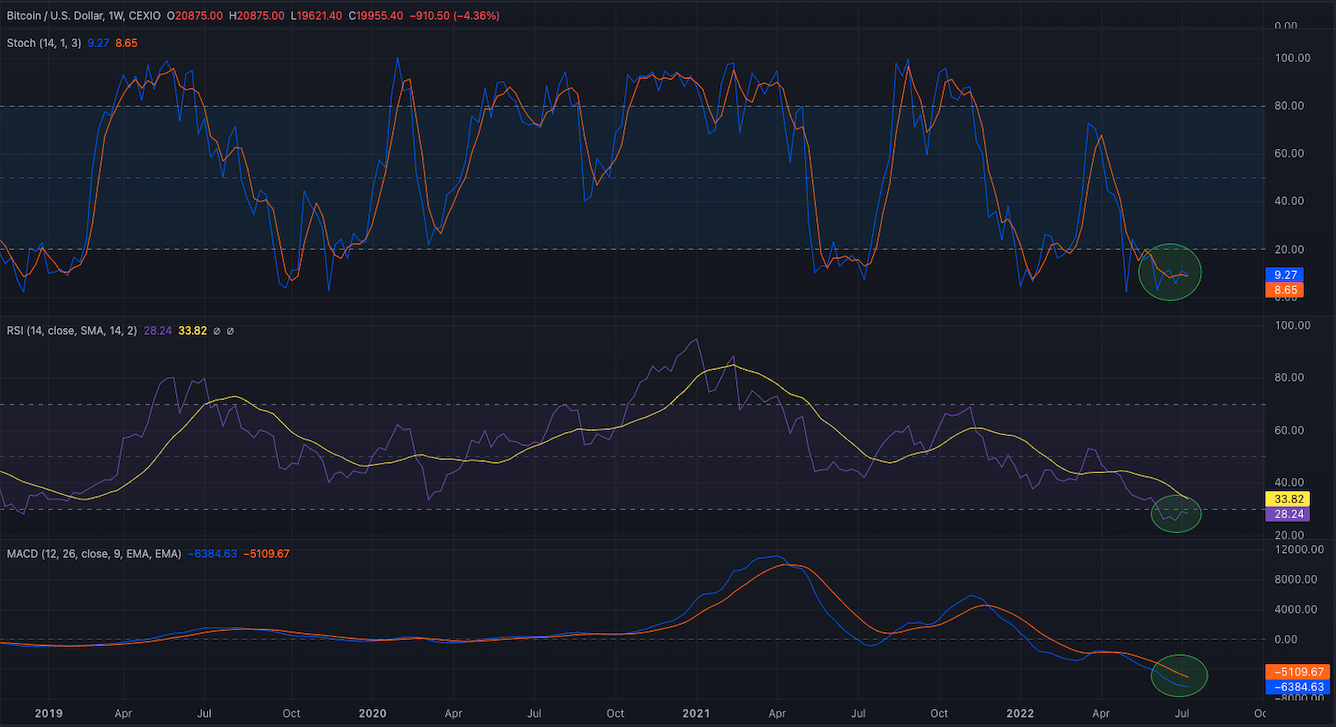
Indicators on the weekly chart remain oversold, while MACD could start to cross over.
Fortunately, there may still be some hope for bullish traders. Many analysts have been anticipating a much-needed relief bounce and there are signals that this could finally be on the way. Technical indicators like RSI and Stochastics remain in oversold territory, possibly demonstrating that a move in the opposite direction is due. On a weekly chart, this could still take time to play out, and further lows are possible, but many traders will be looking to jump into a long position if the opportunity arises.
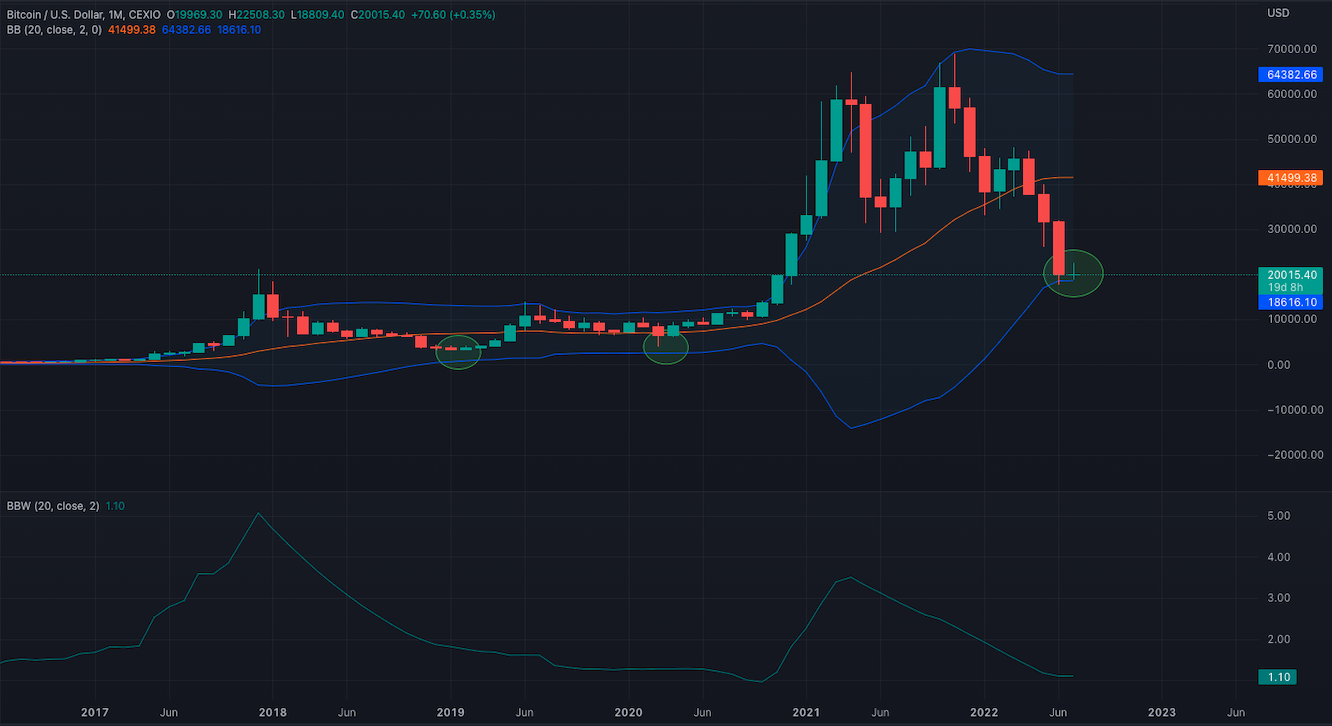
BTC has reached the lower Bollinger Band; it has not touched it before on the monthly chart.
Other metrics that may be worth taking note of are Bollinger Bands and Bollinger Bands Width. By design, Bollinger Bands also demonstrate when an asset is overbought or oversold as price reaches the top and bottom bands. Currently, BTC rests against the lower band on the monthly chart. Looking as far back as 2017, it has never reached the lower band.
While this certainly does not guarantee that a reversal is in order, this can be added to the overall technical analysis picture alongside other indicators. The width of these Bollinger Bands is also tightening, suggesting that we should expect less volatility, and ultimately meaning that a move lower is unlikely. In fact, when we compare the current monthly candle with the trend of the past nine months, it also proposes that a bottom could be forming. This is because we are not seeing the explosive price action that was marked by the large red candles of the past few months.
ETHEREUM ANALYSIS
Price Overview
- Last 7-day change: -12.18%
- 7-day low: $1,044
- 7-day high: $1,281
- Last 30-day change: -31.72%
- 30-day low: $879
- 30-day high: $1,539
Ethereum Technical Analysis:
The story for ETH does not differ much from BTC. After a long slide from its all-time high near $5,000, ETH continues its downtrend until it begins to show strength. Currently, the asset finds itself in a definite price channel as it refuses to break out in a direction. Spectators may consider remaining patient in this environment. As we have mentioned in past weeks, this is the type of landscape that normally only benefits scalpers and short-term traders. Others may end up losing funds from these choppy conditions as they jump in and out of a position trying to anticipate a breakout.
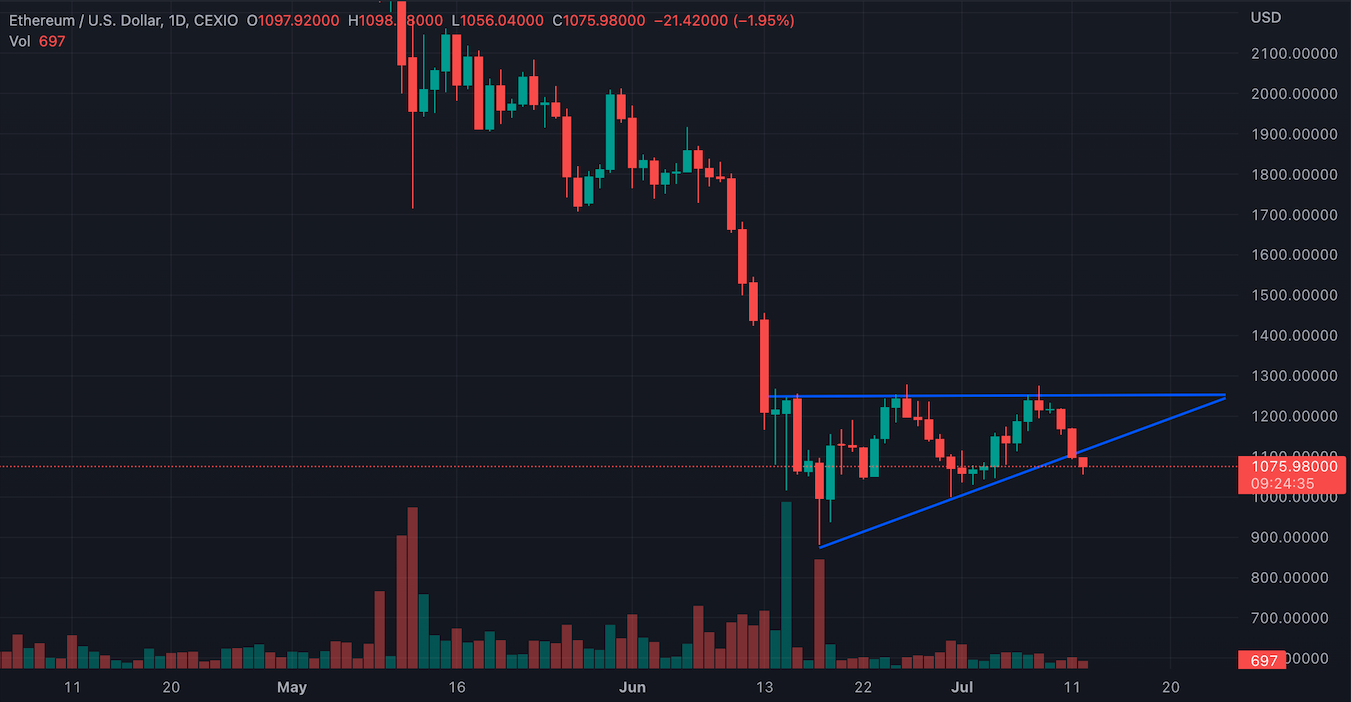
Ethereum daily chart
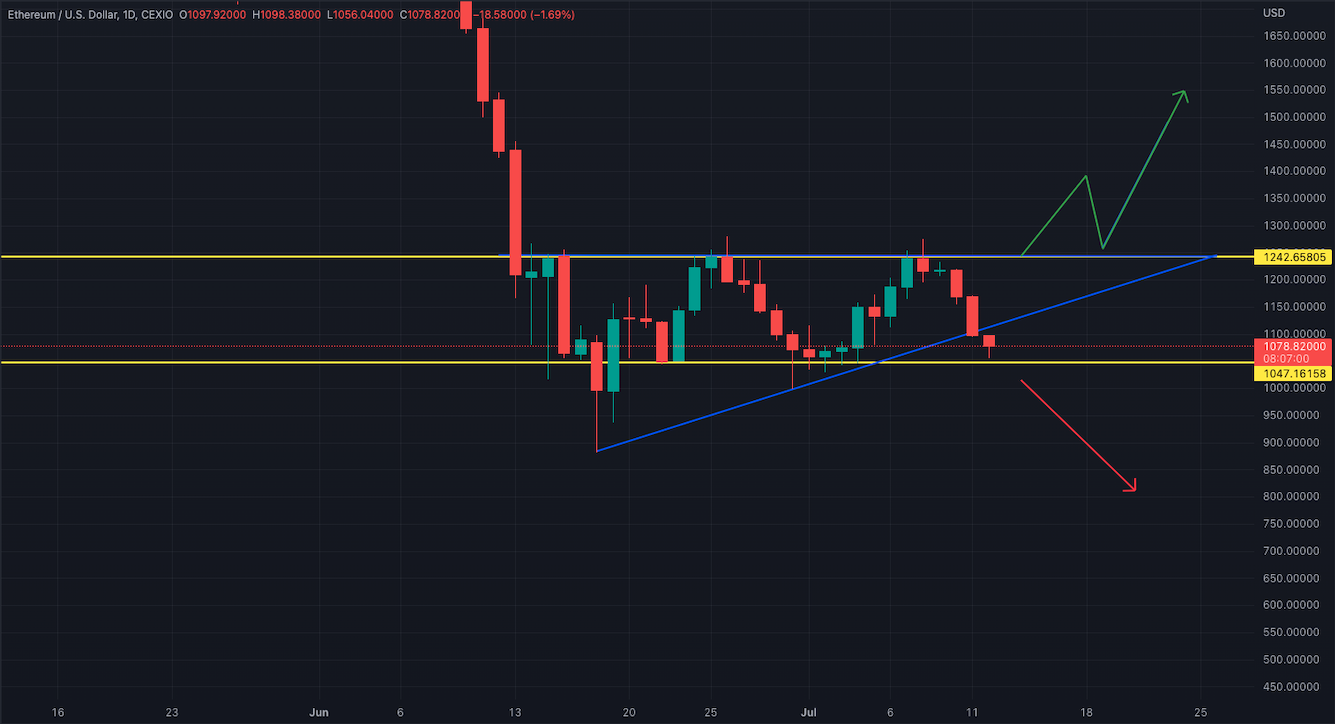
ETH breaking out of a bearish pennant, undecided if it will break under the trendline
Ethereum has broken through the bearish pennant that formed on the daily chart, but has since stayed between the $1,250 and $1,050 levels forming a clear price channel in the process. For unbiased traders, this makes for rudimentary risk/return plays. More than likely, these spectators will look to sell every top and buy every bottom in this range until a new direction is chosen.
OTHER ANALYSIS
Long Liquidations
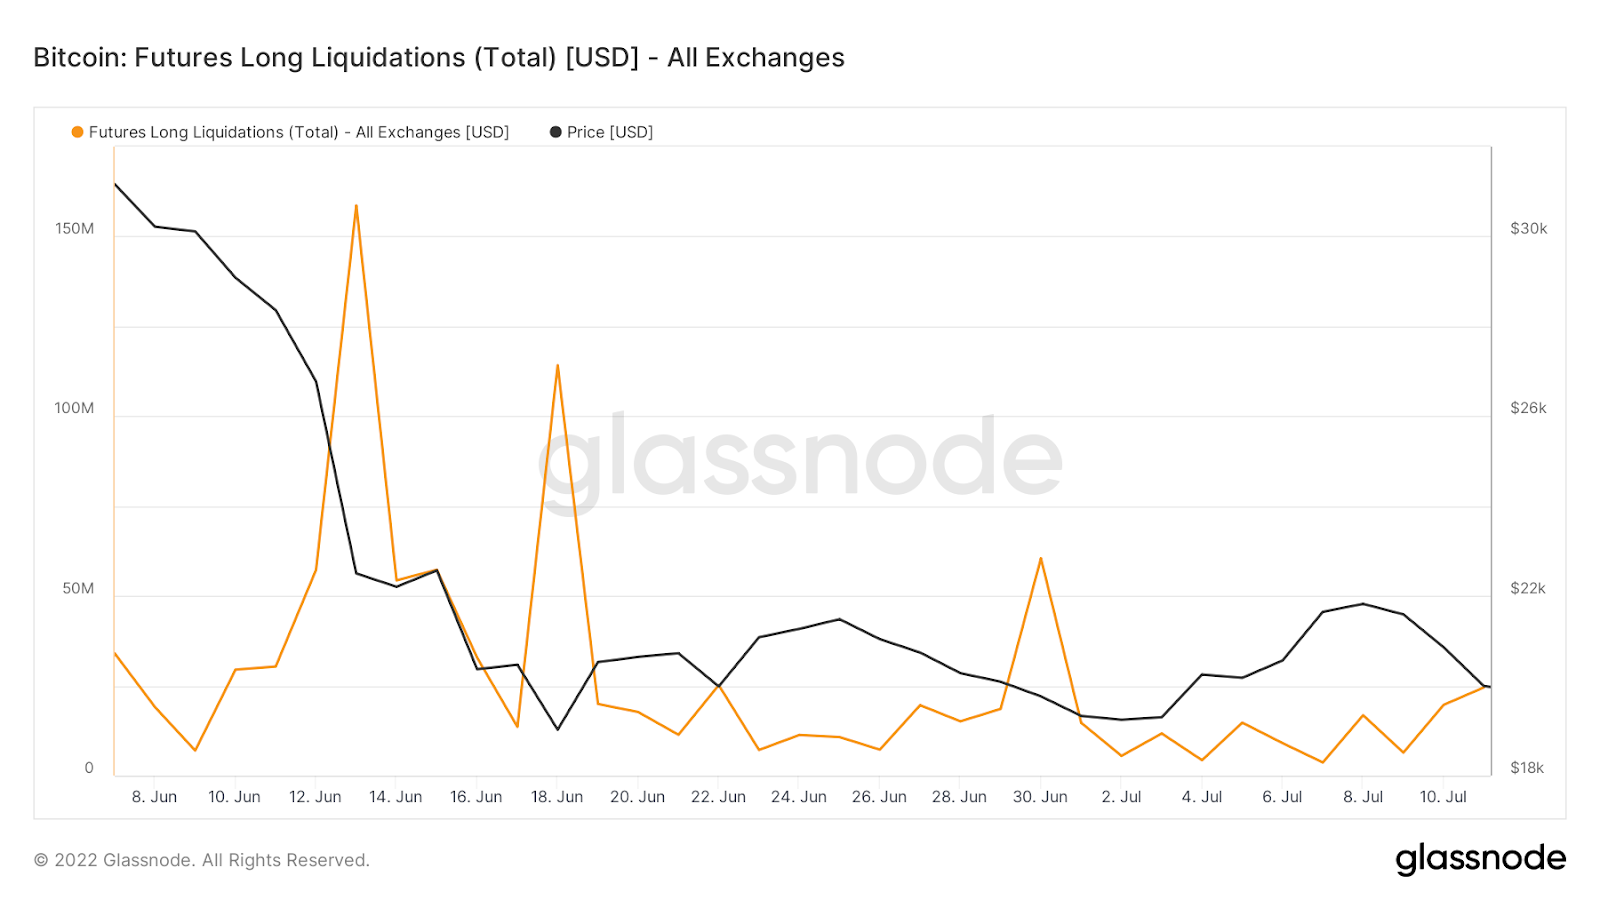
Looking over the past month, we can immediately see a clear trend of a declining number of longs being liquidated over time. When we overlay this with the price of BTC, we may be able to deduce that the majority of longs that were able to be liquidated in this range have already been closed. As BTC’s price has been bouncing between $19,000 and $22,500, the amount of liquidations recedes despite BTC’s peaks and valleys. This may be an indication that the selling pressure has reached a climax.
Holder supply
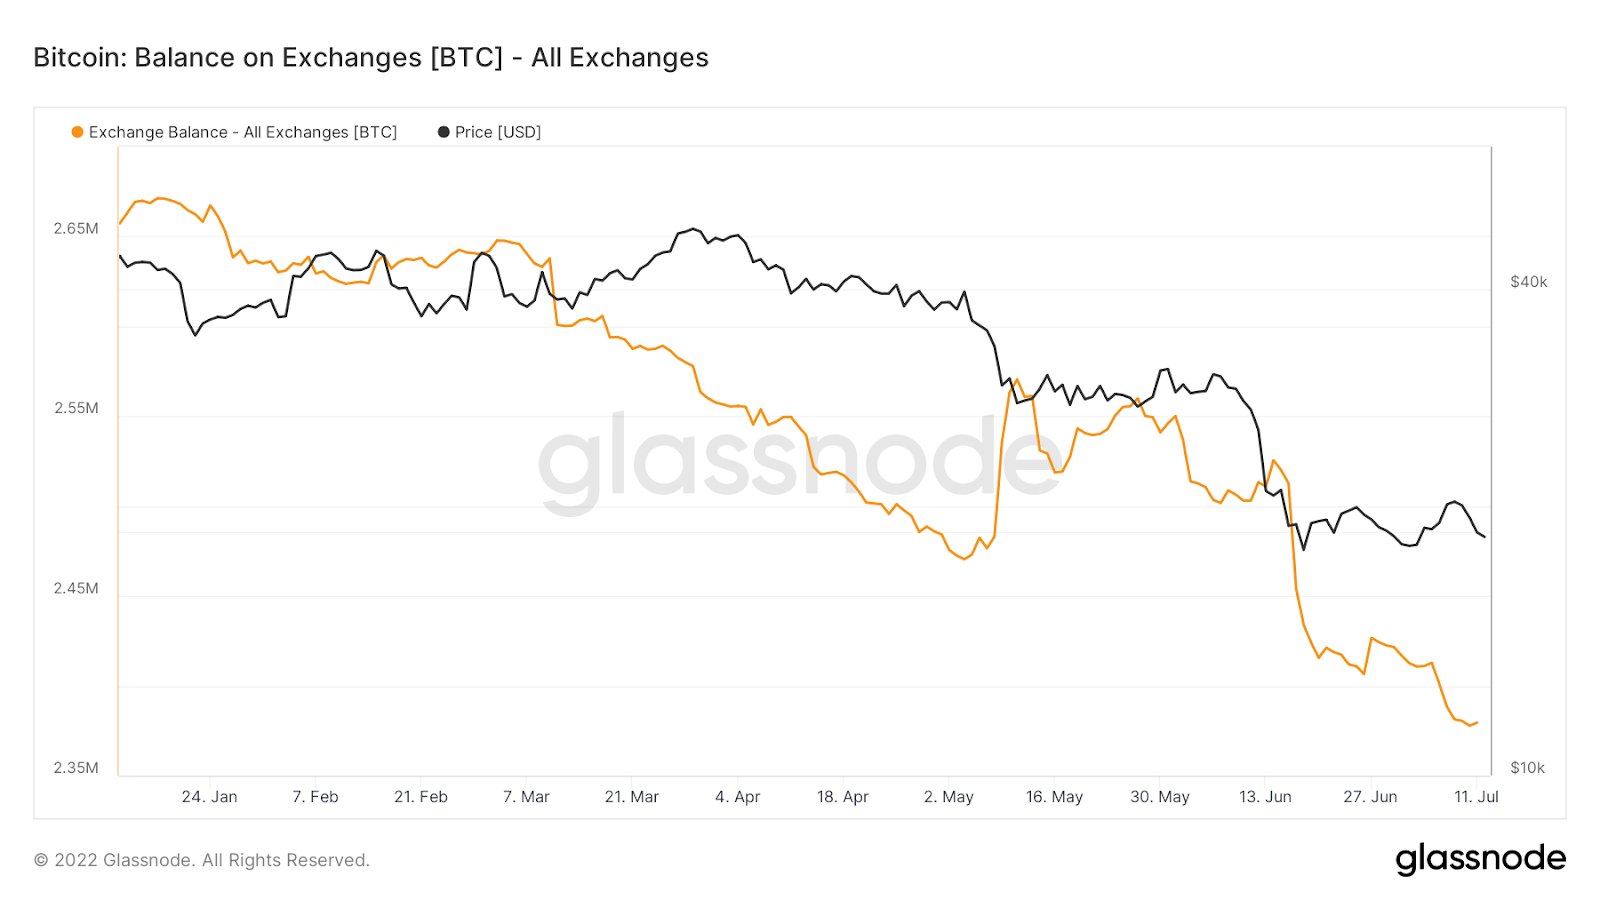
For other metrics that may point to a possible BTC bottom being formed, we can look at the amount held on exchanges vs the amount owned by long-term holders. Back in mid-May, we recorded a large amount of BTC being delivered to exchanges which most likely corresponded with the dump in BTC’s price that followed. Since this date, we have continuously watched as the total balance of BTC on exchanges has periodically dropped.
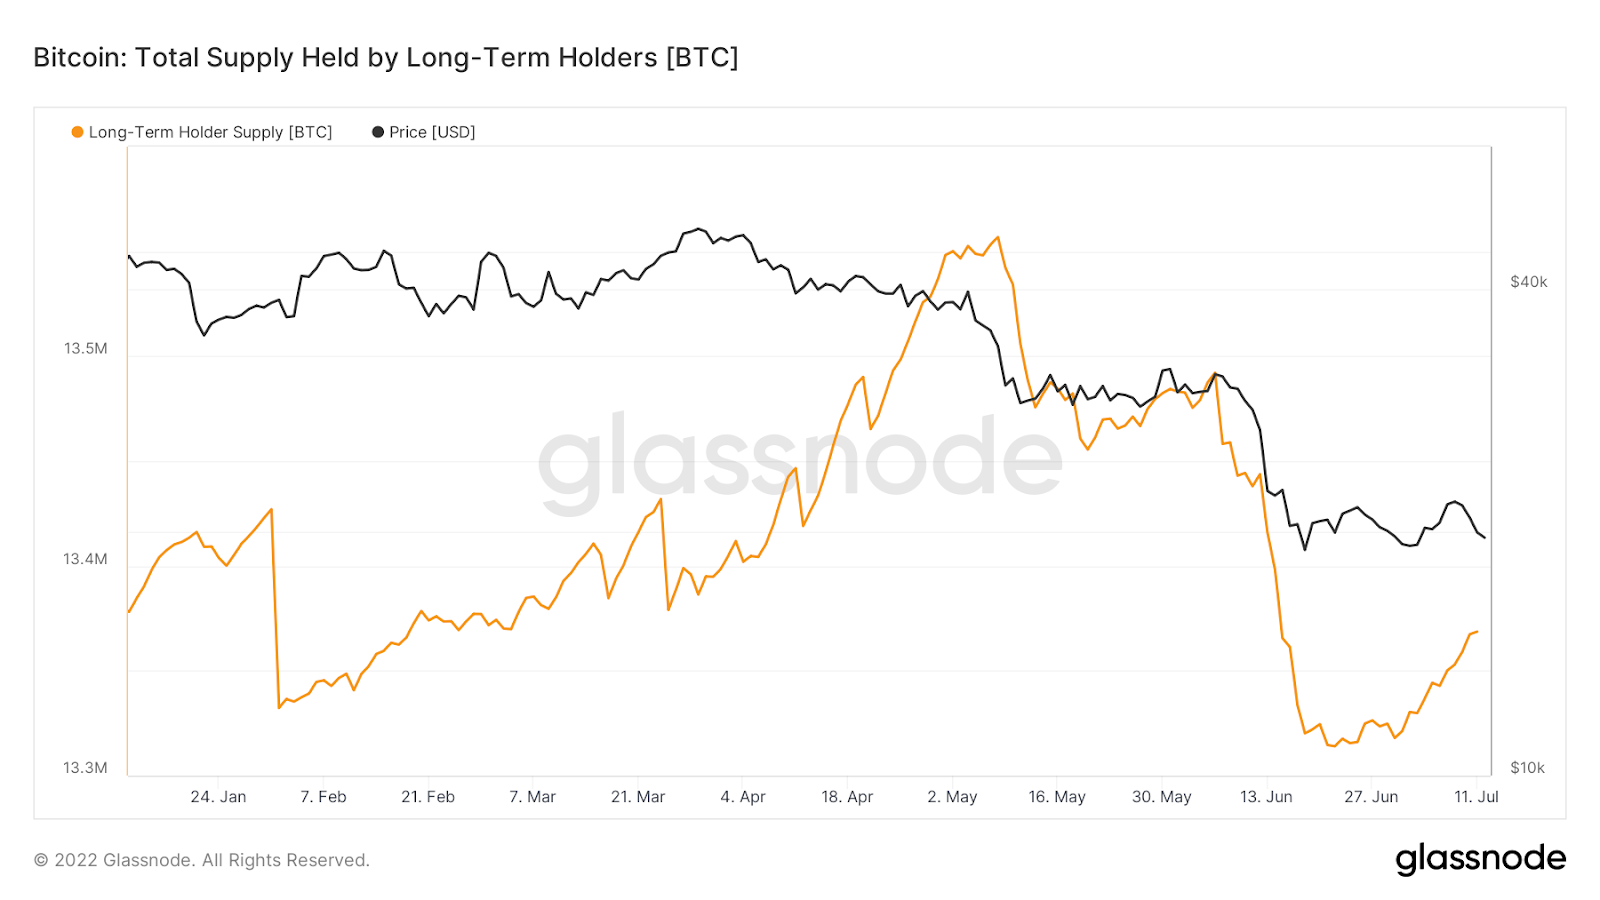
On a promising note, this is matched by a rise in the amount of BTC that is in long-term holder addresses. Overall, these are optimistic signals. It could be that selling pressure is being tapered off and a strong base is being formed that will be the foundation for bullish price momentum.
CRYPTO INDUSTRY UPDATES
Three Arrows Capital not working with liquidators
In the latest update to the ongoing Three Arrows Capital saga, it has been reported that the founders of the once-prestigious company are choosing not to work with the lawyers managing their liquidation proceedings. The situation has become a perplexing mystery as creditors, and the public overall, continue to wonder where founders Su Zhu and Kyle Davies are and what the status of 3AC’s accounts is?
Creditors have asked to freeze 3AC’s assets. Past weeks have seen a flurry of activity from the 3AC founders, including rumors of luxury property sales in Singapore, and the transfer of the Starry Night NFT portfolio estimated to be worth $4.2 million. Lawyers have asked the courts to subpoena Zhu and Davies and force them to provide a list of 3AC’s current assets including bank accounts, digital wallets, property, and records. This situation is likely far from being completed and we will inform you of new details as they develop.
Former Terra projects moving to Polygon
From one bear market tragedy to another, this one comes with some uplifting news. It seems that former Terra-based projects are banding together and taking a new path. An estimated 50 of these companies, including names like OnePlanet, an NFT marketplace, and Derby Stars, a metaverse game, have decided to migrate to the Polygon network.
In the aftermath of the Terra Luna collapse, this network rebranded to Terra Classic (LUNC), and a new project has been put forward, Luna2 (LUNA). However, these other dApps have understandably decided to find a new host network and Polygon appears to be the biggest benefactor. The CEO of Polygon, Ryan Wyatt, has expressed his interest in helping these projects along and has stated that he expects more projects to follow once this migration has proved successful.
Mt. Gox reimbursements may finally be arriving
The crypto space still needs some time to move on from the stain of the 2014 Mt.Gox scandal. After years of deliberation and litigation, it seems that Mt.Gox users that were affected in this fabled hack may finally be receiving reimbursement for their funds in the shape of 137,000 BTC.
This past November, Mt.Gox officials declared their “rehabilitation plan” that included returning lost funds to affected users. In July, we received an update regarding this plan as Mt.Gox trustee Nobauaki Kobayashi announced that payment options were available in USD, BTC, or BCH. Apparently, plans to release these funds are transpiring in August at the earliest. At current prices, the 137,000 BTC could be worth almost $3.5 billion.
Many crypto market participants fear that this release of BTC or BCH could cause immense downward pressure, ultimately resulting in the next leg of the bear market. Others have speculated that the upcoming Ethereum Merge could play into this as well, possibly propelling ETH ahead while leaving BTC behind. However, past experiences have shown that BTC tends to bring the entire market down with it.
The story of Mt.Gox is ongoing. We witnessed the first rounds of reimbursement and liquidation back in 2017 and this event marked the end of the bull run at the time. If BTC were to experience a similar effect, we could see extreme lows from here. However, with past months being a non-stop decline in crypto values across the board, there is also the counterargument that any further sales could be bought up instantly. This could potentially even launch BTC back into an uptrend. Regardless of how this scenario plays out, rest assured that the resulting price action will be heavily scrutinized by market analysts.