
This weekly piece of cryptocurrency price analysis and thought leadership is brought to you by the expert team at CEX.IO, your crypto guide since 2013. At CEX.IO, we’re committed to providing the latest price updates and thoughtful breakdowns to help our users make the most informed decisions along their crypto journeys.
This week’s update examines the ongoing market crash caused by the FTX turmoil.
Following Binance CEO, Chanpeng Zhao’s tweet on November 6 about liquidating all their FTT holdings, rumors went viral about the possible insolvency of the FTX exchange. The price of FTT, the native token of FTX, dropped by over 90% since that day.
The collapse of the FTT token took the entire crypto market down with it. The price of Bitcoin fell from $21,000 to a low of $16,000 on November 9 – a new low from the June 18 bottom at $17,600.
On the other hand, Solana, a major blockchain project closely related to FTX and its owner, Sam Bankman-Fried, also saw its native currency, SOL, drop by over 65%.
In our last Crypto Ecosystem Update, we stipulated that Bitcoin needs to break and stay above its 100-day simple moving average to start a sustained uptrend that could also encourage altcoins to rally higher. Although the price of Bitcoin did break and close above this resistance line on November 4, the crash on November 8 took it back down below.
So is the crypto market headed for new troubles and lower lows considering that it lost the momentum it has gained since the October 13 reversal?
Read along for in-depth breakdowns and enjoy reviews of correlated markets as we try to weather this storm together.
What happened to FTX?
According to Lucas Nuzzi, the head of R&D at CoinMetrics, Alameda Research might have gone bankrupt soon after Terra’s collapse, along with prominent crypto companies like Three Arrows Capital and Voyager. Alameda Research is the trading firm of FTX, which according to Nuzzi, was rescued by FTX back on September 28.
Nuzzi rested his argument on the fact that 173 million FTT tokens worth over $4 billion became active on-chain that day, which he exhibited in a Twitter thread. In the thread, he further demonstrated that all those 173 million FTT tokens exchanged hands within only one transaction, where the sender address belonged to a contract from the FTT ICO and the recipient address belonged to Alameda Research. So in other words, FTX injected into Alameda with over $4 billion worth of cash.
Considering this substantial outflow from FTX, the Alameda bailout likely put a dent in the FTX balance sheet to the point where it was no longer solvent.
Nuzzi further speculated that the folks from Binance heard about this arrangement between FTX and Alameda and deliberately started tanking the FTT markets to force FTX into a liquidity crunch.
Then, two days later, it appeared Binance was able to come to the rescue at a huge discount after Sam Bankman-Fried announced that FTX’s non-U.S. assets would be sold to Binance.
However, right on the next day, on November 10, Binance declared that it will not pursue the potential acquisition of FTX as a result of corporate due diligence as well as the latest news reports regarding mishandled customer funds and alleged U.S. agency investigations.
The backing out of Binance from the FTX deal has brought an additional wave of selling pressure on the market, creating a further 10% loss on average in all major cryptocurrencies.
So will the FTX turmoil create another collapse in the crypto market like in the Terra meltdown?
It is obviously difficult to say. However, the Terra situation was exacerbated due to the price of its stablecoin, UST, and its platform token, LUNA, being determined by algorithms, which created a vicious loophole during a market meltdown. Since the value of LUNA depended entirely on UST, once UST collapsed, there was no value left for LUNA.
Because the value of the FTT token is determined manually by the market, it is unlikely to face a demise like that of LUNA.
Could Solana be the next domino?
Sam Bankman-Fried has been the number one supporter and financier of the Solana project. Due to this, the turbulence surrounding the FTX exchange subsequently splattered into Solana.
Solana’s native token, SOL, experienced a much larger sell-off on November 8 and 9 compared to the rest of the market. It dropped from $37 on November 6 to a low of $12.5 on November 9 – a whopping 65% drop in a matter of three days (see the chart below).
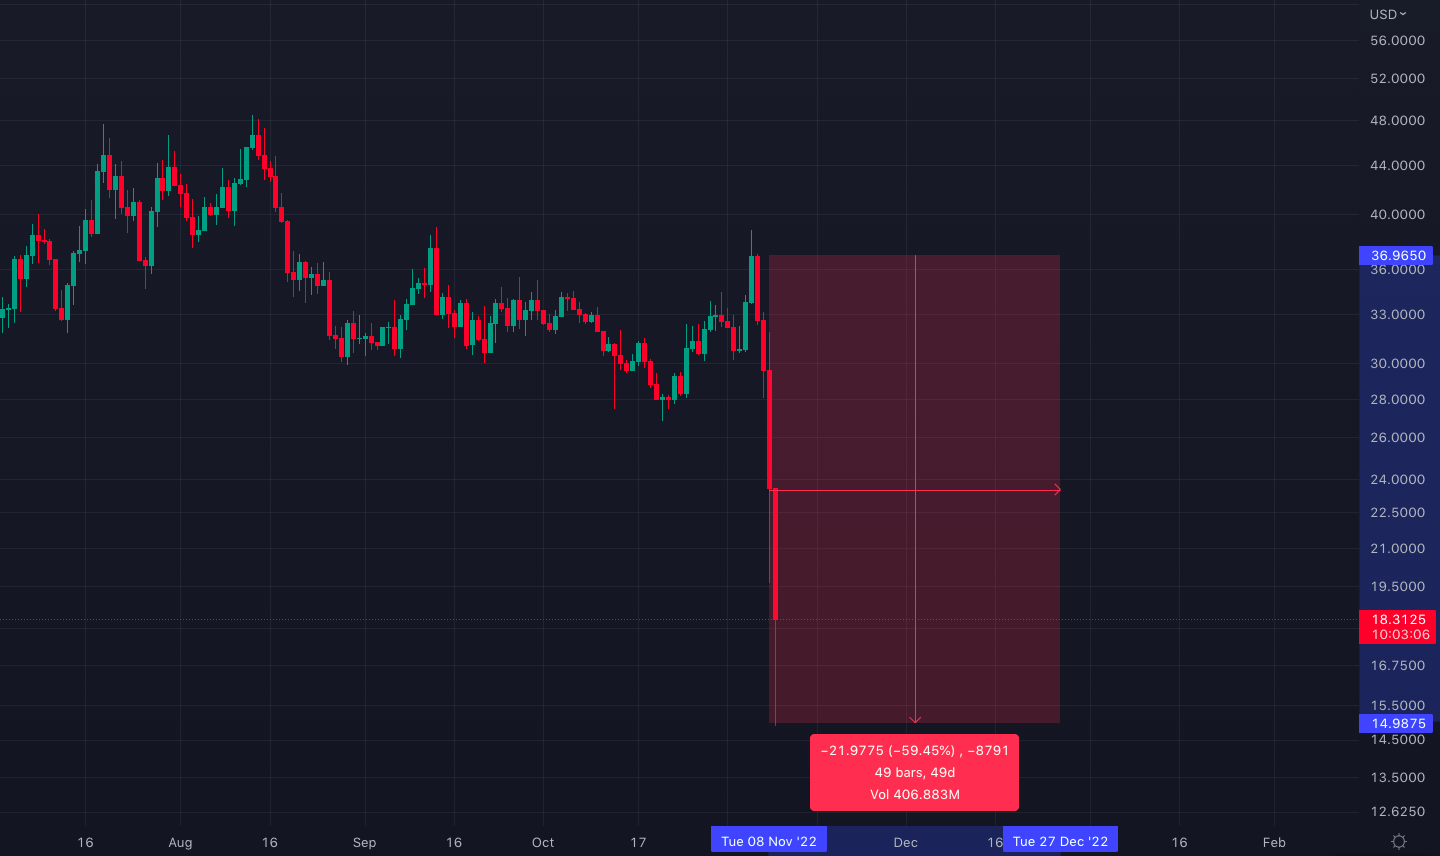
Solana’s collapse in the wake of the FTX turmoil.
To add salt to injury, around 70 million SOL tokens will be unlocked this week, according to Solana Compass, which constitutes 13% of the total supply and thus could trigger further downside in the price of SOL.
As a matter of fact, the current price is sitting on very critical long-term support. If the $15 support level is lost on a weekly close, it could be a freefall for Solana down to the $5 level (see the chart below).

Weekly Solana chart with the $18.50 and $5 support levels.
Bitcoin is on life support
The recent price rally from $18,000 to $21,500 had planted hopes in the entire crypto market for Bitcoin to finally start a sustained uptrend toward the $29,000 major resistance (2021 bull market support).
When Bitcoin broke and closed above the 100-day simple moving average (SMA) on Friday, November 4, many took this as the potential signal for a long-awaited bull market.
However, Friday’s move from $20,000 to $21,500 ended up being a bull trap when the entire move was negated by the crash on November 8 (see the charts below).

Bitcoin/U.S. dollar candlestick chart between November 4 and 8. Source: Tradingview.
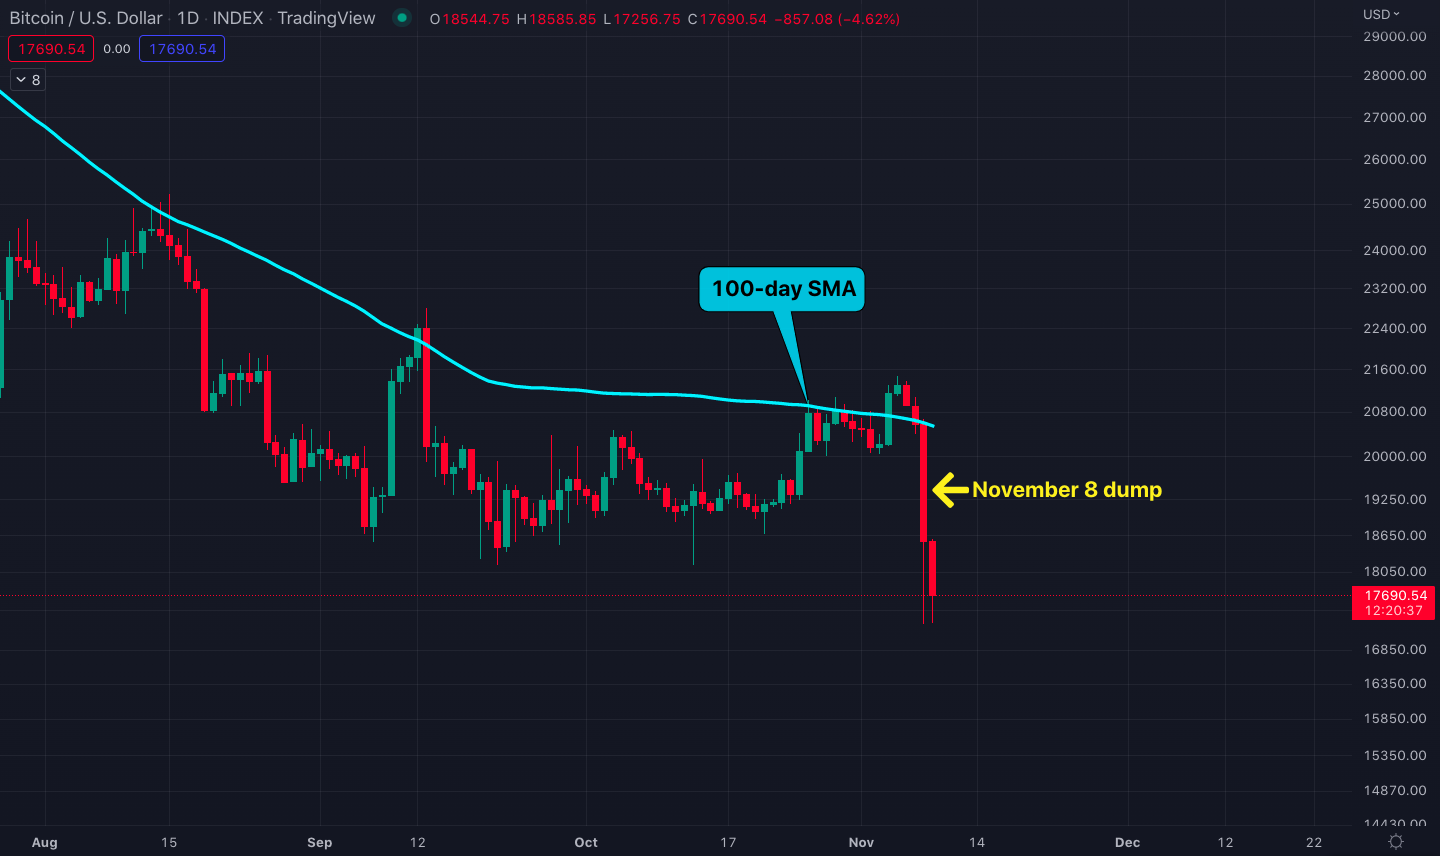
Daily Bitcoin/U.S. dollar chart with the 100-day SMA resistance line.
In the wake of the FTX chaos, the price of Bitcoin dropped as much as 25% by November 9, creating an even lower price than the June low at $16,000.

Bitcoin/U.S. dollar chart with the price breaking down the horizontal channel.
If the November 9 candle closes the day below the horizontal channel that Bitcoin has followed since the June bottom (circled in orange in the chart above), significantly lower levels could be on the horizon. The next move of the S&P 500 stock index this week could shed some light on whether we’ll go much lower or not.
S&P 500 is very critical this week
Going forward, the S&P 500 stock index, the asset class to which Bitcoin has been most closely correlated, could be very critical for the direction of Bitcoin.
The index is currently struggling at a major resistance, which is the rising channel resistance that it broke down from last summer (see the chart below).

S&P 500 index price chart with the rising channel resistance.
If, following the U.S. midterm elections on November 8 and the U.S. consumer price index (CPI) announcement on November 10, the index faces a serious sell-off from the channel resistance, it could drag Bitcoin down with it, considering the current weakness in the crypto market.
U.S. bond yields
The Federal Reserve has been heavily buying U.S. bonds, which is common practice before U.S. midterm elections. This has dropped the yield curves, and in return, boosted the equity and crypto markets since October 13.
However, we do not know if this trend will continue after the U.S. midterm elections. And if we see no new buying crypto volume follow for the bond market, it could trigger a sell-off for equities and cryptocurrencies.
Below is the 10-year U.S. bond yield chart. The yield dropped from 4.34% to 3.90% on the week of October 24 and has been climbing back ever since. If the 4.34% resistance is breached upon a weekly close, it could spell disaster for both the equity and the cryptocurrency markets.

10-year U.S. bond yield chart with the 4.34% resistance.
What if the $16,000 level is lost?
If $16,000 is lost for Bitcoin, the most obvious support level down below is the monthly support from the previous cycle, which is at around $14,000 (see the chart below).

Monthly chart for Bitcoin with the $14,000 support from the previous cycle.
The $14,000 level has long been anticipated by an overwhelming number of market players. Although Bitcoin often likes to surprise people, losing the horizontal channel that it has been following since June (a.k.a. closing November 9 below $18,000) could give the herd the opportunity to buy Bitcoin at $14,000.
Tune in next week, and every week, for the latest CEX.IO crypto ecosystem update. For more information, head over to the Exchange to check current prices, or stop by CEX.IO University to continue expanding your crypto knowledge.
Disclaimer: Information provided by CEX.IO is not intended to be, nor should it be construed as financial, tax or legal advice. The risk of loss in trading or holding digital assets can be substantial. You should carefully consider whether interacting with, holding, or trading digital assets is suitable for you in light of the risk involved and your financial condition. You should take into consideration your level of experience and seek independent advice if necessary regarding your specific circumstances. CEX.IO is not engaged in the offer, sale, or trading of securities. Please refer to the Terms of Use for more details.