
In this week’s crypto highlights, we explore the price movements of BTC, ATOM, MKR, and XRP. Additionally, this recap includes other notable industry news items that occurred over the last seven days. Without further ado, let’s dive into the latest market developments.
Noteworthy market events
Arbitrum announced its native token, ARB
On March 16, Ethereum’s layer 2 network Arbitrum announced the launch of the ARB token, and its airdrop. The token went live today, when block 16890400 on the Ethereum mainnet was found. The ARB token will be used to perform governance voting on so-called Arbitrum Improvement Proposals (AIPs).
Users can check whether or not they are eligible for airdrop on the official Arbitrum Foundation website. Essentially, eligibility and the amount of distributed tokens depend upon previous user activity within the Arbitrum network, prior to the airdrop announcement.
Within the airdrop event, 1.162 billion ARB tokens will be distributed to individual wallets, representing 11.62% of the total token supply, which sits at 10 billion tokens.
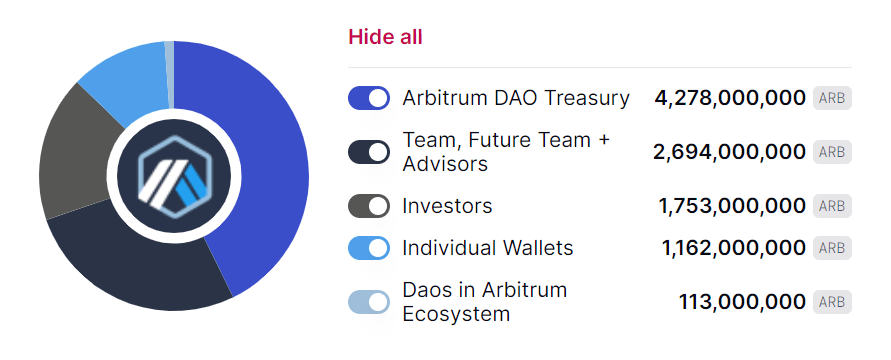
Source: Arbitrum Foundation
FDIC sold Signature assets, excluding crypto-related ones
A week after its collapse, Signature’s deposits and loans were sold by the Federal Deposit Insurance Corporation (FDIC) to Flagstar Bank, a subsidiary of New York Community Bancorp. However, the takeover deal did not include approximately $4 billion of deposits held by Signature Bank’s digital assets business.
Earlier, Reuters cited two sources who stated that any buyer of Signature would not bid for its crypto assets. In response, the FDIC told Reuters that “the agency would not require divestment of crypto activities as part of any sale.” However, the latest announcement confirmed statements provided by Reuters sources.
As a result, the accusation that shuttering Signature was a deliberate message to crypto companies seemed to gain strength.
Filecoin launched smart contract functionality in the mainnet
The Filecoin developers implemented the Filecoin Virtual Machine (FVM) in the mainnet, empowering users to deploy smart contracts. The platform is compatible with the Ethereum Virtual Machine (EVM), allowing developers to run applications from the Ethereum ecosystem on the Filecoin blockchain. According to the Filecoin team, various projects have already announced integration with FVM, including SushiSwap and Ankr.
Dates defined over the last seven days
- April 12 — The long-anticipated withdrawals of staked ETH are expected to occur on the Ethereum mainnet. The Goerli testnet has successfully completed the upgrade to Shapella. It’s the last testnet before the update is activated in Ethereum’s mainnet.
- April 18 — According to the draft agenda, the European Union’s Markets in Crypto Assets Regulation, also known as MiCA, will be the topic of discussion in the European Parliament. The final vote could take place the following day.
- April 25 — Zilliqa developers are planning to bring the first complete release of EVM to the mainnet. This will allow users and developers to deploy Ethereum-compatible smart contracts within the Zilliqa network.
BTC shows signs of the price correction
Bitcoin experienced its best-performing week since January 2021, jumping over 30% in price. This happened at the same time that the Fed lent $300 billion to support the U.S. banking system, and Europe endured its own mini banking crisis. Because of these events, Bitcoin has become more widely viewed as a hedge against inflation. People have even started to bet that Bitcoin could jump to $1 million in 90 days, anticipating U.S. dollar hyperinflation.
However, a correction typically follows such rapid price movements. And here are a few signs that indicate its possibility.
Fundamental analysis
First of all, miners may increase selling pressure. According to MacroMicro data, after a month of accumulating losses, mining costs have recently caught up with the Bitcoin price. As a result, miners could use this rally to sell more tokens and offset some of their past losses. They have already started doing so. When miners increase the selling pressure, the BTC price tends to go down.
Secondly, the BTC futures premium indicator remains unchanged at 2.2%, suggesting there’s been no additional demand from leveraged buying activity.
Technical analysis
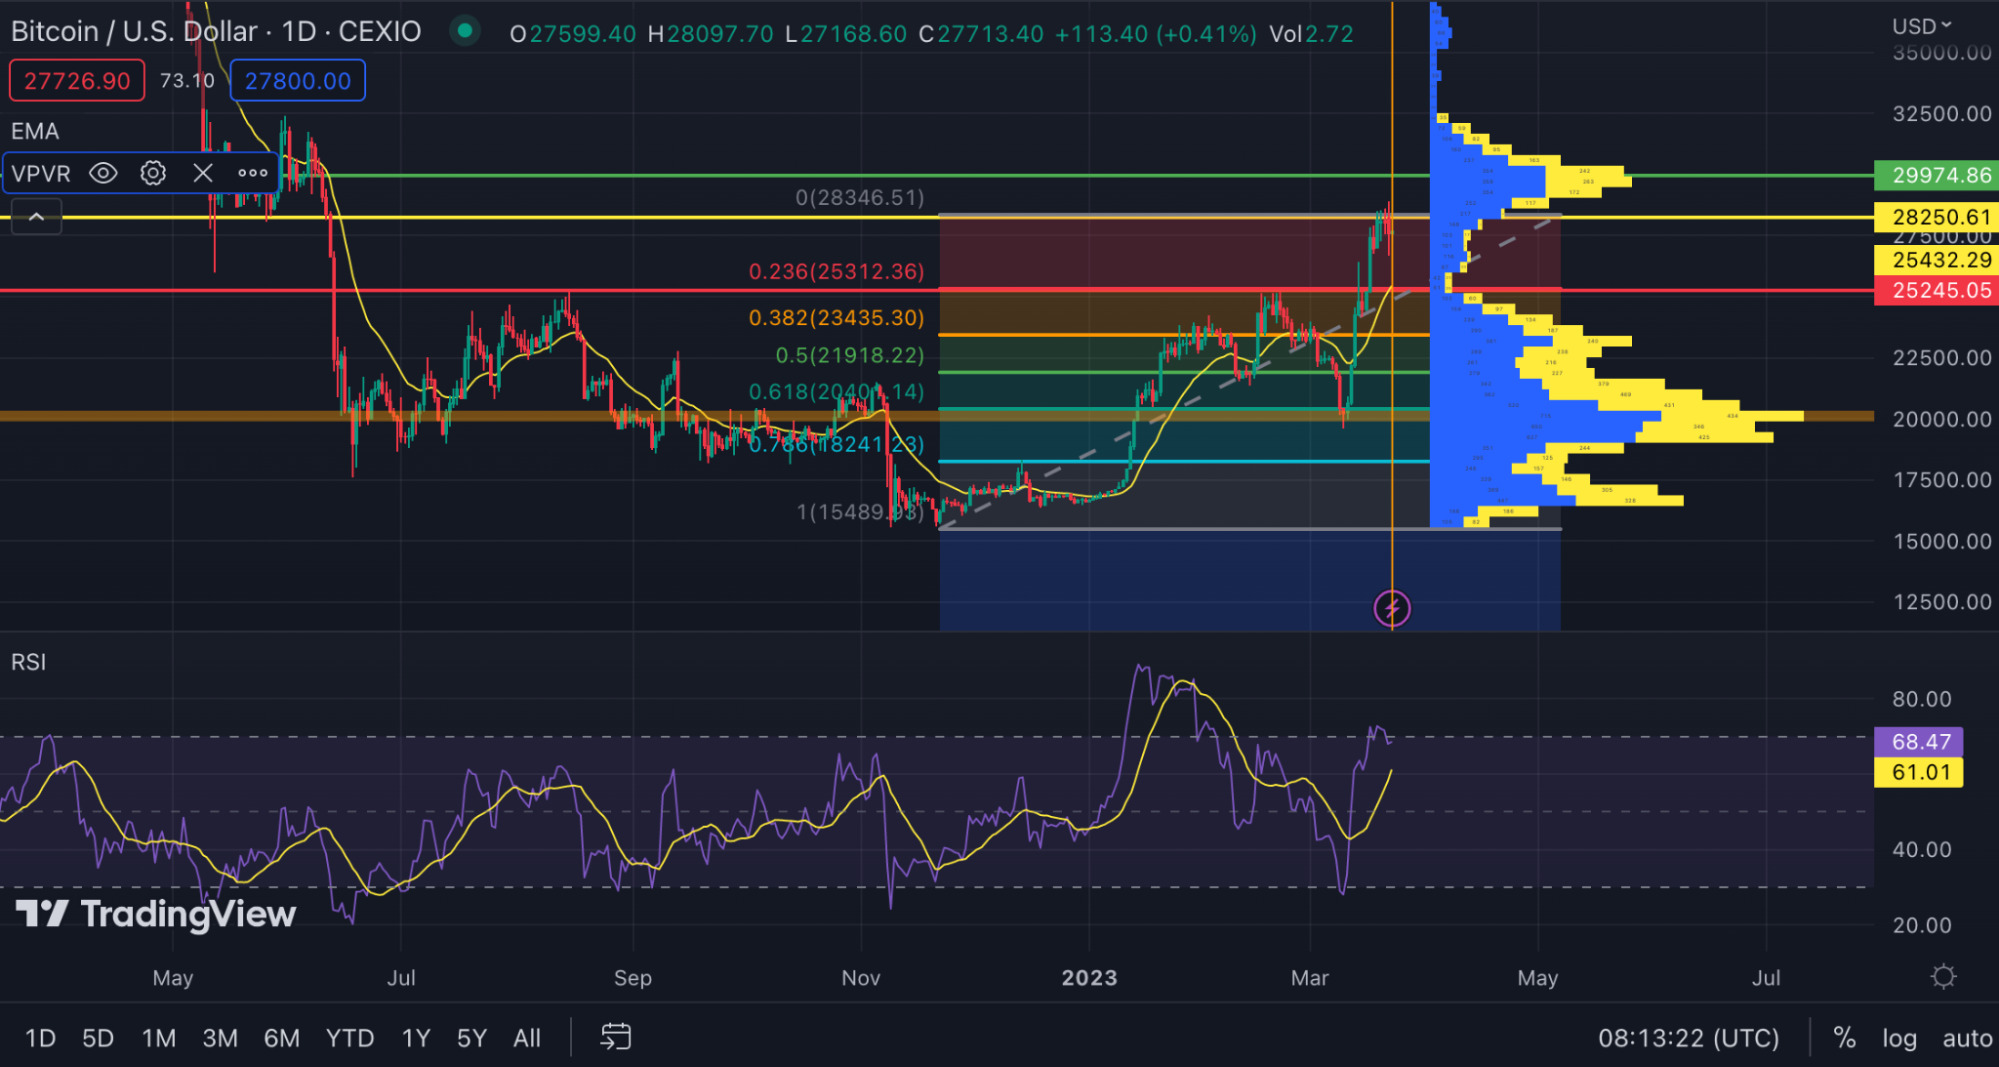
As we mentioned in our previous analysis, $28,250 could be the next potential target for BTC if the price breaks $25,000. At the moment of this writing, the asset is consolidating near this area.
According to the VPVR metric, moving above this level could be more difficult since the asset historically showed increased liquidity there. The highest local value is near $30,000, which could act as the next potential resistance area. If the price fails to sustain above $28,250, the asset may move to the $25,000-25,250 support zone, which corresponds to the 0.236 Fibonacci level.
Bitcoin also reached the overbought area on a daily chart, and the Fear and Greed Index hit its highest level since Bitcoin’s all-time high in November 2021. This indicates that the market could be overheated.
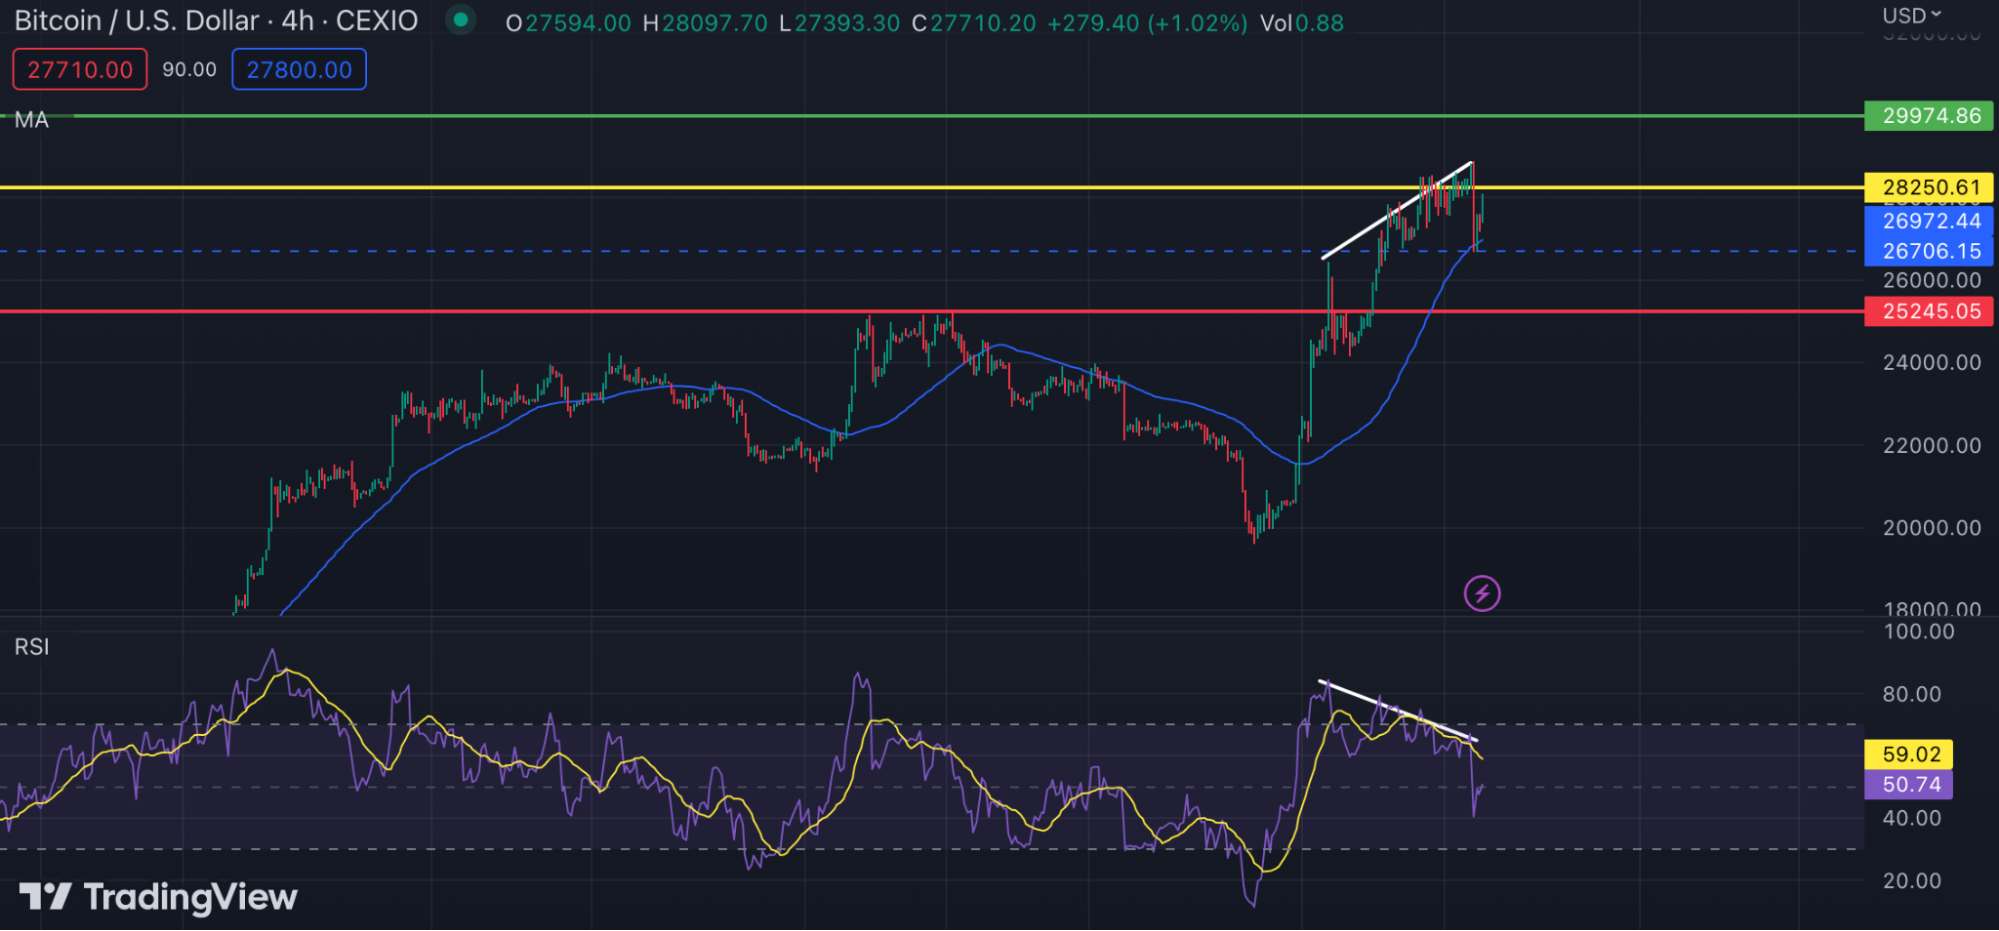
Looking at the four-hour chart, you may notice that the asset formed a bearish divergence (white lines). This may support bearish momentum. The $26,700 could be an intermediate target for bears if the asset rejects $28,250. This level corresponds to the SMA 50, which previously acted as dynamic support/resistance in this timeframe.
The asset has already tested this level after the Fed raised rates by 0.25% amid banking turmoil. If the asset drops below this moving average, bearish pressure may continue to prevail.
In total, Bitcoin may still have upward movement, but indicators hint that the asset could need to experience a correction, and validate new levels, before moving forward.
ATOM is trading within a symmetric triangle
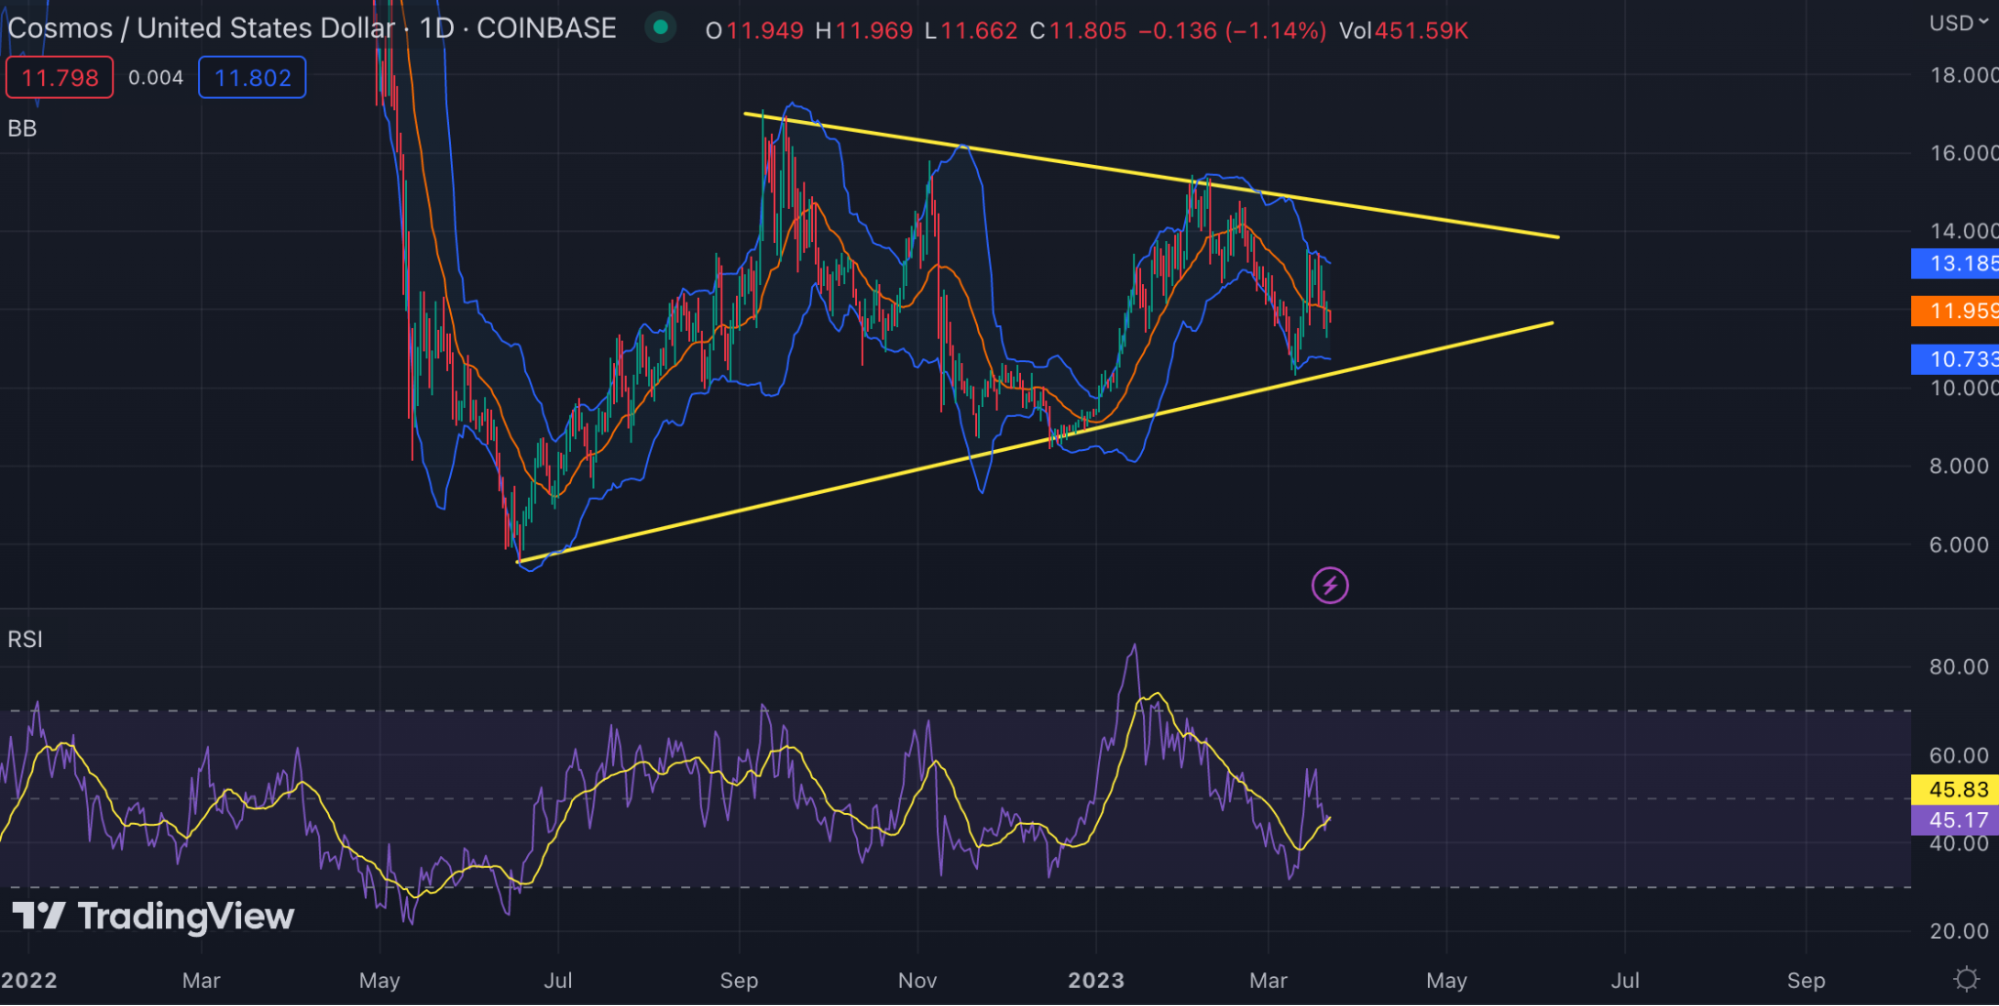
Cosmos completed the Lambda upgrade, which introduced replicated security to the network. This allows new chains to rely on the Cosmos Hub for security, enabling new chains to bootstrap security easily while in their infancy. However, the update didn’t boost the bullish momentum for the ATOM price.
The asset is currently trading within a symmetrical triangle, which is considered a neutral pattern. The ATOM price bounced off the support line, but the daily RSI is still in the negative zone. This indicates that the path of least resistance could be to the downside.
At the moment, the asset is trying to sustain above the middle of the Bollinger channel. If successful, the price may move to $13.5, or even the upper border of the triangle. If failed, the price may retest the support line.
MKR may continue experiencing bearish pressure
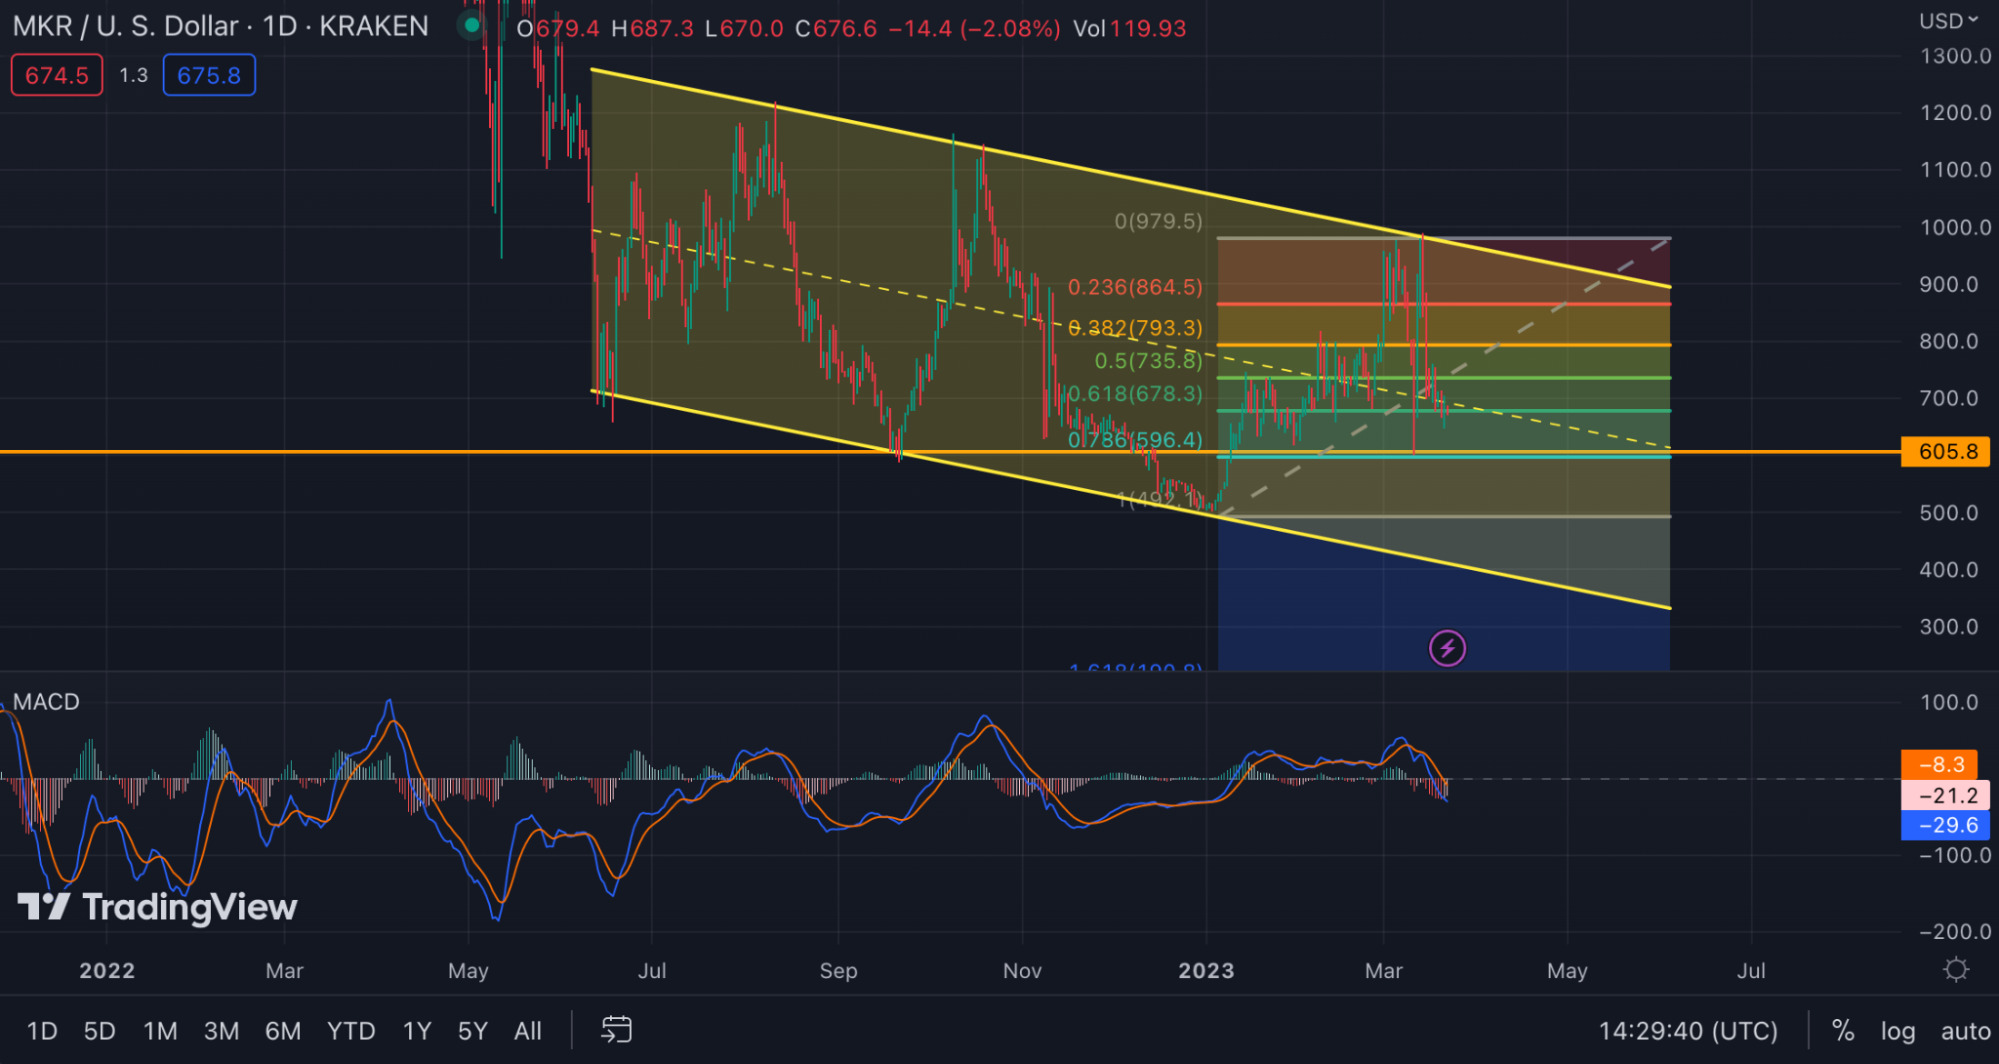
When USDC depegged on March 10, Maker’s DAI stablecoin also dropped by 10% because over 45% of its collateral was allocated to USDC. Although DAI recorded significant supply growth compared to other stablecoins, there were still concerns. As a result, MKR experienced one of the largest weekly price drops among the top 100 digital assets by market cap.
MKR is trading within an established descending channel (white line), and reached the middle of the channel after the recent drop. It also corresponds to the 0.618 Fibonacci level, which is considered a typical price target during corrections.
This means if the asset manages to defend this level, it could see increased bullish momentum. If failed, the next potential target could be near $600, or the 0.786 Fibonacci level. Daily MACD crossed the zero line, indicating that bearish pressure has the potential to maintain.
XRP made a 30% jump in a day
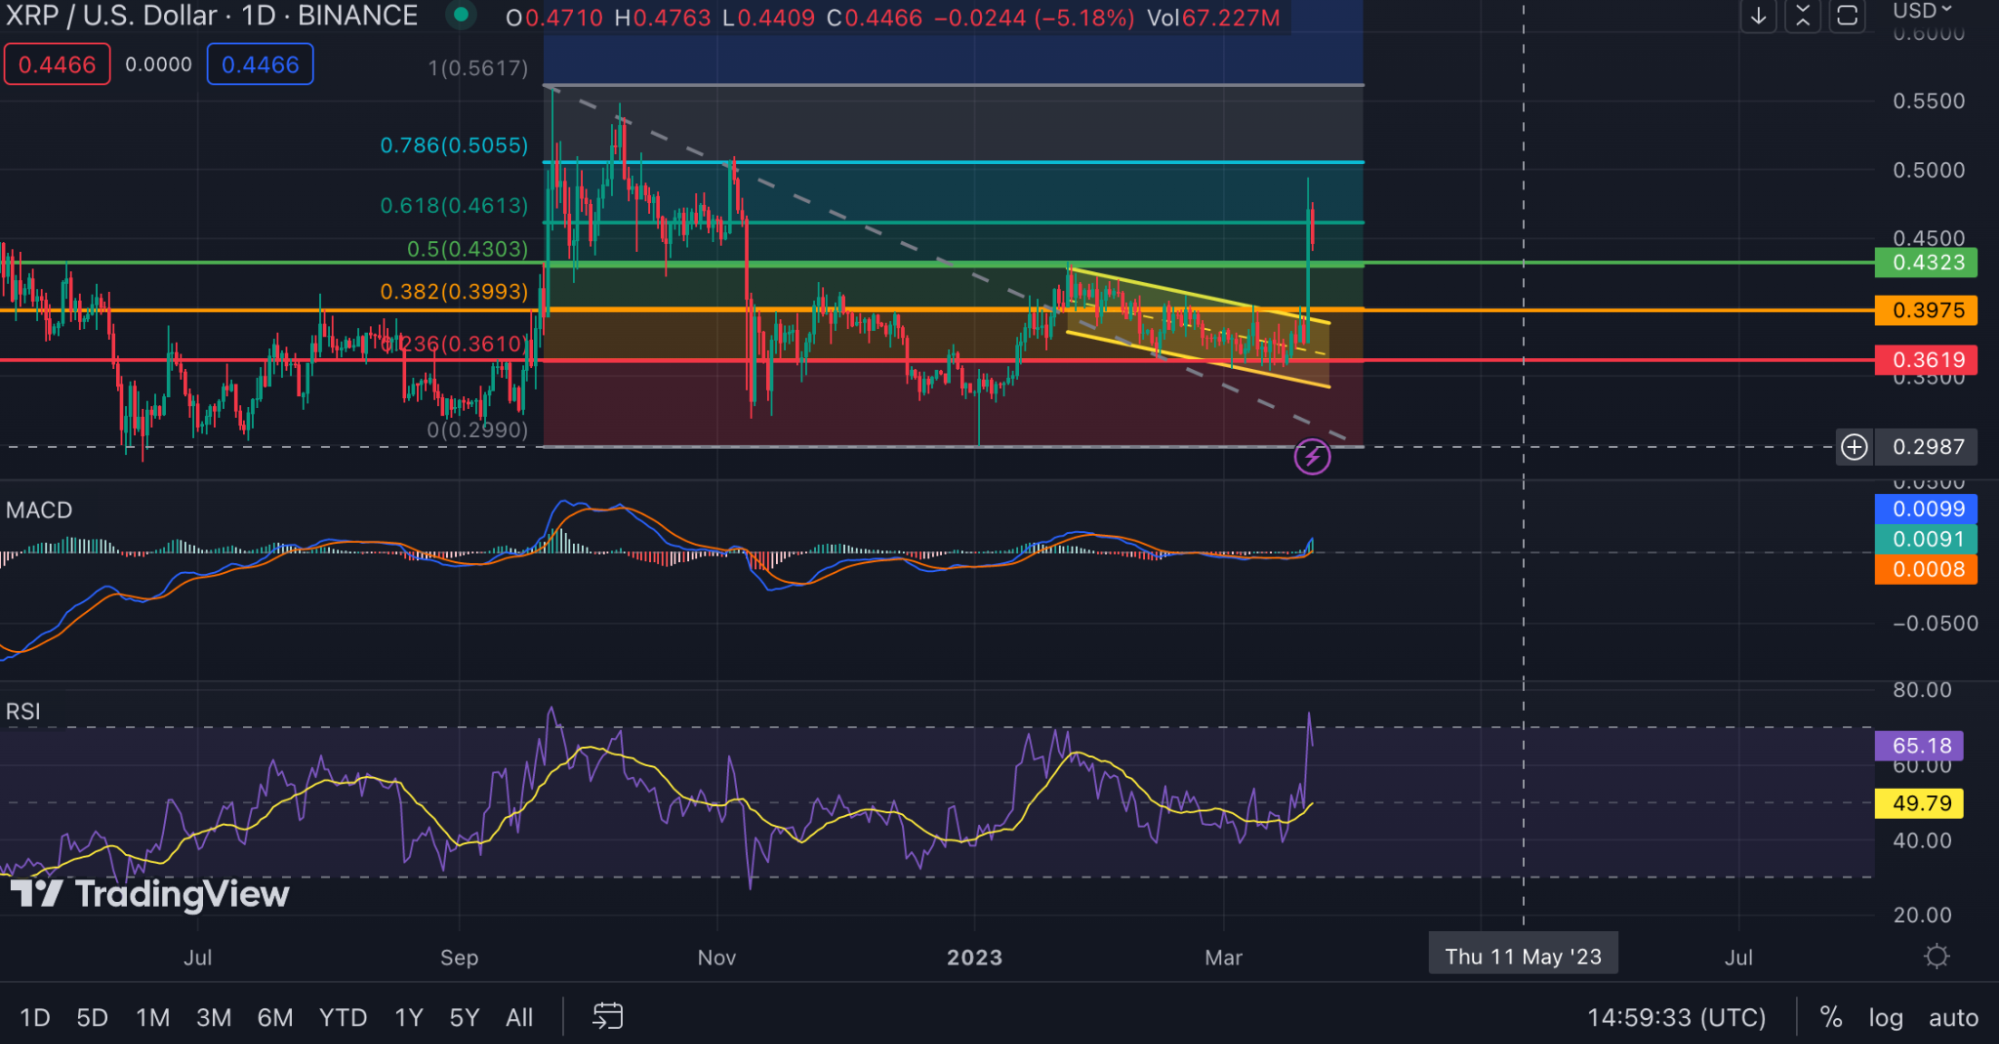
On March 21, the XRP price created a massive bullish candlestick, breaking the descending channel (yellow one). It is worth mentioning that there are no recent developments regarding the U.S. Securities and Exchange Commission (SEC) vs. Ripple Labs case. But there were rumors about a potential agreement.
The asset also moved above the 0.5 Fibonacci level, hinting that the asset may experience a bearish-to-bullish trend reversal. For that, the asset may need to defend the said level. The closest resistance could be near $0.51.
Daily MACD crossed the zero line, which may support bullish momentum. However, the daily RSI has already reached the overbought level, indicating that price consolidation, or correction, may follow, before further potential upward movement.
Tune in next week, and every week, for the latest CEX.IO crypto highlights. For more information, head over to the Exchange to check current prices, or stop by CEX.IO University to continue expanding your crypto knowledge.
Note: Exchange Plus is currently not available in the U.S. Check the list of supported jurisdictions here.
Disclaimer: For information purposes only. Not investment or financial advice. Seek professional advice. Digital assets involve risk. Do your own research.